Adding timestamp to the worksheet
I'm setting up a spreadsheet of the readings of temperature using DAQ Assistant. When I try to add a timestamp the value placed in the worksheet is always 77. What I am doing wrong?
Thank you!
Ben
In fact, you do not use the DAQ Assistant.
You use what is called the wizard of DAQNavi I've never heard before.
But the problem is in your code where you get the timestamp value while converting to string. You then convert the string into a byte array. So if your time is 13:01, you now have a '1' string ': ' '0' '1' 'space' 'P' "M" and they appear as the ASCII equivalents. The values in the ASCII array gets converted to an array of doubles and a type of dynamic data.
The 77 value is the value ASCII for "M". My guess it is afternoon and you basically send the value of 77 for the M character to your data file.
Try to get rid of the express VI and type of dynamic data and convert LabVIEW Real data types in your code as soon as you can. You should probably convert all your numbers to strings from the beginning because that's ultimately what you want to see in your text file. By converting strings, you can control the format of each of your pieces of data, then to combine these elements of the string in a table that you send writing to a spreadsheet file.
Tags: NI Software
Similar Questions
-
Adding timestamp to the dumpfile. Why do we need this space?
11.2.0.3/RHEL 5.4
When you run expdp on Linux, I tried to add the timestamp for the dumpfile and the following syntax worked.
There should be a space after the keyword date. Without the space, you will get the following errorDUMPFILE= PCFS_SIT-`date '+%d-%b-%Y'`_%u.dmp
Why is this?$ -ksh: date+%d-%b-%Y: not found [No such file or directory]Hello
When you typeDate + %d - %b - %Y
ksh (or depending on the shell you are using) looking for a file called date and then accepts various parameters to format this date
When you type
Date + %d - %b - %Y
ksh search a file called date + %d - %b - %Y
that does not exist - and throws the error.
Kind regards
Harry -
No timestamp in the log of TDMS files
Hello
I tried searching for this issue but has not found a matching thread. I use an NI USB-6218 data acquisition to monitor several analog channels and have trouble with the recording feature. I'm going on an example, I found and everything works well except the timestamp. When I opened the PDM file, I see the channels that I selected and their tensions but no corresponding time. The timestamp appears in tables, charts and digital indicators in VI itself, but not the worksheet with the tensions in the task. The time is also left empty in the main Excel worksheet (task is the second sheet of the file).
Anyone would offer a suggestion on why this is happening?
Hope to hear from you,
Yusif Nurizade
No, the timestamps are not saved. In the metadata for the group must be a start time (T0) and a sampling frequency (dt). Of those, we can calculate the time of each sample.
-
Multiple can write to screw the worksheet cause a change to rewrite?
In my program I use now two parallel loops, which have both a writing on spreadsheet VI written to the same file path. I did not really care order lines are added to the worksheet, as data from two different loops can be differentiated, but what I was asking, is that it is possible for the two live run simultaneously and have one change to crush the other, so there is a line missing in the final result. I have seen that it is a risk for writing in local variables in parallel loops, but have not seen anything be it specifically to write to an external file.
Thanks for your help.
Writing on a spreadsheet file is not reentrant, while an instance of the latter can run at a time. As long as you are concatinating, I don't expect any loss of data.
However, a better solution would be to have another loop to process your file IO. Then you can open it and keep it open. You send data may be written using a queue. And do not forget to close the output file.
-
chart of increment with the new data to the worksheet
I'm having a little trouble and could use some help if someone has a moment. My vi is streaming at 2 Hz data acquisition and adding data in a worksheet open. I would like to be able to view the data from the worksheet in graphic form, but I don't want to redraw all the data points whenever the worksheet is in graphic form. I have attached the section from vi which is dealing with this issue. I have included an incrementer in my loop (+ 0.5 each implimentation) to allow time (for (i = 0) that each data point is collected, so my spreadsheet has essentially 2 columns, one for the time (0, 0.5, 1.0, 1.5, etc.) and a second column of data point recorded. It all works very well. It's just the graphical representation that gives me. Assume that the broken wires are not broken in total vi. Any ideas on that?
For anyone interested, we solved this problem by attaching a waveform chart to the table converted out of my acquisition of data and define the history of this table to include the necessary length. It seems that a waveform graph is not enough, and each parcel will not appear unless the table is horizontally (columns instead of rows for each data point). Thanks to Jeff at home OR for the help on this one.
Matt
-
Cannot read the timestamp of the file LVM in table or export to Excel
Good afternoon!
Im having issues return timestamps from a LVM file and an excel file.
Ulitmately, I have a series of files LVM with 6 channels of data and timestamps of correspodning.
When I read the back files in a table, the channel values are analyzed, but the timestamp is no where. The channel data then exported successfully to an excel sheet (less the time stamps).
How can I extract the timestamps with the channel data and bring them into an excel sheet?
NOTE: I do not know you can open the file LVM directly in excel, however, information is not "analysable.
I appreciate the toughts. I have attached my experimental code as well as the data set, I am trying to extract. I have also included a spreadsheet excel destination.
Hi, ASAT,.
Is there a reason that you do not simply write it as File.vi to write your signal data in the excel worksheet? It is an easy way to put in your signal data to an excel spreadsheet (see file attachment). You can also view the code in this Express VI to see how this is achieved.
-
How to apply the timestamp and the whole barrel distortion correction?
Hi guys! My first time ask your question here and I hope to have your advice on this challenge edition. Right now I use Adobe Premiere Pro CS6 and FastStone Image viewer to make an image and video editing. I use GoPro Hero HD 3 cam to take pictures at certain intervals of time, and then then combine in a timelapse video. Capture settings are 7mp to average angle. I know that the GoPro take pictures at 12 mp W, but as you know the GoPro is infamous for barrel distortion, so with higher settings, it's even worse.
I'm loaded with fixed barrel and adding timestamp feature distortion on my timelapse videos. I used FastStone Image viewer to add timestamp or first CS6 to distortion correction. However, I was unable to do both at the same time. Now, I know that the CS6 has a kind of timecode function that allows timestamp to shown, however my timestamp time data must be extracted the original meta data, while the functionality of timecode CS6 shows just the total length of the video, not the original date and time when the data has been captured. Using the FastStone allows me to show a real progression of time on entering data from beginning to end (I work the JPEG images in this case).
Now because FastStone extract the timestamp of original image data and displays them in the text label format, when I tried to apply the lens correction on CS6, it would also distort the text label itself. I tried the other too, where I corrected barrel distortion in CS6 then imported the images to FastStone, but then I would lose the metadata of origin (the date and time of capture), FastStone is then compelled to work with date and time. Now usually I work with anywhere from 1000 to 3000 images and FastStone allows timestamping to add to the batch conversion. It also has this function to change hour date desired or specific to a time, however, this cannot be done in a batch, but rather on the image or the image and therefore is not very practical when working with thousands of images.
So my question is if there is a way I can combine distortion barrel and timestamp (which uses capture data)? Thank you guys.
Do two sequences, one without the stamp and corrected the lens distortion. The other with the timestamp and apply just cropping effect let numbers, overlay on a sequence. If it's the white numbers you might also add a key to Luna to clean.
-
file index.xml missing existing password protected worksheet the worksheet
file index.xml missing existing password protected worksheet the worksheet
What spreadsheet, Excel,...? What model computer/year? What if any error message? Did you create the spreadsheet? Have you checked with the developer of the worksheet for help, Microsoft for example?
Writing an effective question of communities of Apple Support
-
Why my sample rate does not match the output of timestamps in the waveform?
Hello
I run a simple application to read the data of two pressure sensors output signals 0 - 5V to a NI9215 module, and one connected to the 9237 module load cell. They are housed in the 9172 chassis.
I am new to DAQ and labview, and I find it difficult to reconcile the sampling frequency that I put in the sample clock and the apparent rate data (according to the timestamps in the waveform that I output to a text file). For example, if I ask 100 Hz rate (and 10 samples to read), the data appear to sample at 1612,9 Hz. If I ask the sampling frequency of 1000 Hz, outgoing data is 1612,9 Hz to 20 kHz, the data came out to 25 kHz.
Can someone tell me to trust the timestamps given in the waveform that is written in the text file, and if there is a way to check this? If this timestamp is correct, how can I force the application of sample data at the requested speed?
As a secondary issue, in my attached VI, you can see that I have an attached to an array of construction shift register. I can't understand how to initialize the array outside of the loop as it clears the table before the next time I run the program. Any advice?
My VI is attached.
Thank you
Claire.
Hi Marc, thanks for the quick response and the right explanation. It's all much more clear now.
Have a great weekend,
Claire.
-
Precise timestamp on the graph of the band with scrolling
I have a user interface with a set of synchronized graphics that operate in mode scrolling stripchart. The elevator of the x-axis is visible on one of the cards, and the operator has the ability to take a break from the update of this table (essentially locking the entrance to the chart) and scrolling in a bit of history. The width of the graph is about one minute of data, the number of points has been set to allow about an hour to scroll of history. Other maps which are synchronized with the main chart have the x-axis property nodes attached, so that they follow the scrolling of the main graphic.
Everything works fine with the current configuration, except for one small detail: the timestamps. I put date and time stamping visible on the x-axis of the main graphic, so that operators know exactly when any aberration in the data actually took place. I have seen a few entries in how add real timestamp, but none of them seemed to work properly. They work very well on a standard sight, but fail miserably once the scrolling action is activated, so I have to do something wrong.
Any suggestions on the best way to get this accomplished timestamp? It's absolutely crazy to me how much pain is to put a timestamp to the real real world in a graphic... As someone who constantly defends LabVIEW against colleagues who claim that it is "too difficult" to use it, it's kind of embarrassing when a thing so simple becomes so complicated in LabVIEW!

The short answer is that this is impossible with a graphic if you add the requirement to be able to take a break. The reason is simple - a chart stores data on its own, but it saves all the values of X - you give only values Y and for the X values he simply uses the index of the value and the most you can do is set a t0 and delta t for the X scale. This works normally, but does not work when you stop feeding data to the chart, because the value of X is not stored. I heard someone say once a waveform graph does not allow this, but I've never looked into it and I'm not sure that's true.
What you can do is use a graphic instead of a chart - in a graph, you provide values X and Y for each point, so you can have absolute time for the x-axis values. The key point is that, to a chart, you must provide all the data to draw, you must maintain a circular buffer of the data yourself. You can do this by using a queue with loss, when you preview the queue to get the data, but there are also some examples online, as well as in the finder of the example, if you search for 'XY Chart'.
-
Problem reading the worksheet after you use a DLL to write on the worksheet
Hello
I have a few problems reading a sheet DLL created in LabVIEW. The DLL is written in C++.
I'll dexcribe what do the VI in the screenshots:
For DLL_INIT = the first false steps the VI (LabVIEW) values and exports in a DLL initialization.
DLL takes these values and not some und calculation, then wrote the measured values and the new calculated values in a csv file called 'filtered_values' and a file 'filtered_values_complete '.
so, I have two files like this after initialization:1.0000000000; 1.0000000000; 18.8991610737; -3.2940000000; 0.0060000000; 0.9000000000; 6.5806287097; -3.2940000000; 1.0000000000; 0.0000000000; 1.0000000000; 0.0000000000;
So now on DLL_INIT = true.
For the calculation, the next step i read the "filtered_values" - file (LabVIEW), calculate the new values and write in filtered_values (DLL)
And in the "filtered_values_complete" - file I will allways read the DLL entry first, so that I can check later, if the DLL has obtained the values to the right of the front step and then add the calculated values.For i > 0 initialization has been made:
-the VI bed sheet "filtered_values" calculation and rotted the table 1 d in its unique values
-The last seven values in the worksheet have been exported in the dll as well as five new measured values.
-This DLL is still a few calculation
- then it replaces the "filtered_values" - file and adds a new line to the 'filtered_values_complete '.This migth be a bit of confusion, so a small example, afer five steps it loooks like this:
filtered_values:
5.0625000000; 1.0000000000; 18.9300200447; -3.2870000000; 9.7320000000; 0.8997597592; 5.9159054233; -2.6533532901; 1.0000000400; 0.0000000000; 0.8078703403; 0.0000000000;filtered_values_complete:
1.0000000000; 1.0000000000; 18.8991610737; -3.2940000000; 0.0060000000; 0.9000000000; 6.5806287097; -3.2940000000; 1.0000000000; 0.0000000000; 1.0000000000; 0.0000000000;
2.0625000000; 1.0000000000; 18.8330081064; -3.2940000000; 9.7270000000; 0.9000000000; 6.5806287097; -3.2940000000; 1.0000000000; 0.0000000000; 1.0000000000; 0.0000000000;
2.0625000000; 1.0000000000; 18.8330081064; -3.2940000000; 9.7270000000; 0.8999399568; 6.4077416273; -3.1451829134; 1.0000000100; 0.0000000000; 0.9480589053; 0.0000000000;
3.0625000000; 1.0000000000; 18.7932988441; -3.2870000000; 9.7280000000; 0.8999399568; 6.4077416273; -3.1451829134; 1.0000000100; 0.0000000000; 0.9480589053; 0.0000000000;
3.0625000000; 1.0000000000; 18.7932988441; -3.2870000000; 9.7280000000; 0.8998799074; 6.2394046705; -2.9768465052; 1.0000000200; 0.0000000000; 0.8988158138; 0.0000000000;
4.0625000000; 1.0000000000; 19.0445703499; -3.2870000000; 9.7320000000; 0.8998799074; 6.2394046705; -2.9768465052; 1.0000000200; 0.0000000000; 0.8988158138; 0.0000000000;
4.0625000000; 1.0000000000; 19.0445703499; -3.2870000000; 9.7320000000; 0.8998198333; 6.0754981785; -2.8129479844; 1.0000000300; 0.0000000000; 0.8521305805; 0.0000000000;5.0625000000; 1.0000000000; 18.9300200447; -3.2870000000; 9.7320000000; 0.8998198333; 6.0754981785; -2.8129479844; 1.0000000300; 0.0000000000; 0.8521305805; 0.0000000000;
5.0625000000; 1.0000000000; 18.9300200447; -3.2870000000; 9.7320000000; 0.8997597592; 5.9159054233; -2.6533532901; 1.0000000400; 0.0000000000; 0.8078703403; 0.0000000000;So it's good enough that the VI and it works fine until some point when the just VI reads more calculation and x = sheet! There? becomes true.
Most of the time it happens when the csv file is about 1200 lines
Someone knows why this happens?
Best regards
Stefan
Hello
understood, that the error occurs somewhere completely else. the thread may be closed
BR
Stefan
-
bug in the worksheet to the table?
Hello!
"So, reading a html file and extraction of a table, I used the string to the worksheet with.
"In some way, I got a blank line and a column blank and it is reproducible with a starting chain control by.
/ Yamaeda
I think what you're saying, is that if the string begins with the delimiter, you get an empty element (if you set the separator ',' and feed him ', 5.8' you get ['',' 5 ', ' 8']). I call not this bug, as there might be cases where you want an empty element (for example, an empty string) in a list, and this empty element could be the first element of the array.
-
write on the worksheet with formatting
Dear LabVIEW Forum,
I'm having trouble with something that should be fairly simple however the online help was not able to help me after spending several hours looking.
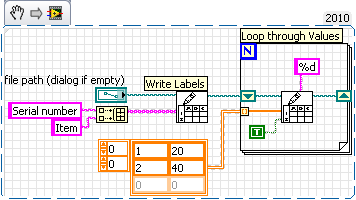
I am trying to configure a LabVIEW program to write the following sample data in a spreadsheet file (two columns with serial number of first input line and point, and then under this various data) I intend to extend this option to add more data, but just need to get the fundamentals of marketing in the form of work :
Item serial number
1 20
2 40
I have attached my .vi effort to date, however, I can't figure out how to get the formatting to work (i.e. remove the zeros, carriage return or tab). If anyone can help it would be appreciated.
Kind regards
Altenbach says:
I don't see any code that generates the zeros, carriager returns, or tabs.
%f used as a format string actually gives you % .6f, should be %d if no zeros on the right are sought.
I'll add to the endless possibilities, assuming that build you a file over time. Write labels at once, and then add the file in a loop. I find this method is safer, then creating a string if the program takes a long time to run.
If you have all the values at once, follow the other suggestions to build a string and write it then. A simple way is to remove the loop in my excerpt and the wire of the array 2D directly to the second write in File.vi of the worksheet. Without looking, I bet that something similar is one of the mods of altenbach.
-
Structure of the problem of the worksheet
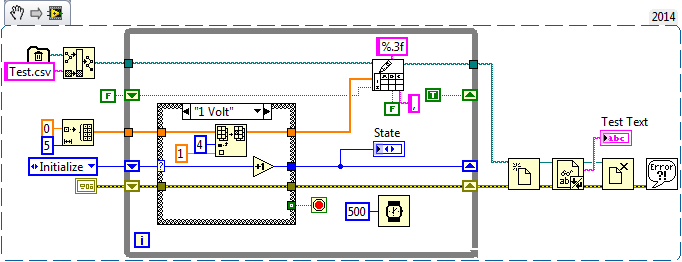
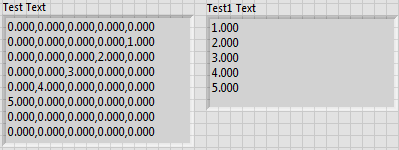
Hello to all and many thanks for helping me to get as far as I am, on my first LV project. I have attached my project below. My program is running good, however, when he wrote in my spreadsheet, it gives adverse effects. I open the MS Excel spreadsheet. What I'm trying to do is to get all of my reading (entries 1 - 5V) in the same column, one under the other, starting of course with the 1 volt. I put the transposed to "T" and it has at least put in order but not in the same column. I have read the help file to this topic and tried a few different things, but it is having no effect. Any help would be greatly appreciated. Thank you
I have "simulated" your code, get out all the DAQ stuff, just to test writing to the worksheet. The code below gives the results presented in the form of text of the essay. In addition to the extra lines of zeros, it seems curious that you do not want to write the data in this way (but there may be a very good reason to do so).
I made a trivial change in the code (I think Taki has made a similar suggestion) and got the output displayed in the text of Test1. If it is, in fact, what you hope to achieve, then you are close...
Bob Schor
-
Write to the worksheet only if the file name is different
Hi all
I'm trying to write some code, but to no avail. Basically I have a file name to each time interval (say 2 seconds). I built a small table for example.
The names of files in the table are repetitive and I don't want to write the data in the worksheet, if the file name is the same.
Bascially, I need to write the header and the table for the 1 c:\1.txt files and after c:\1.txt the data (more than 3) I want to only write the table only (no header) and add it to the worksheet.
That is to say for c:\1.txt file, it will consist of 1 header and 4 sets of table.
Then the process is repeated again until a newfilename (c:\2.txt) is encountered.
c:\2.txt will also include 1 header and 4 sets of data.
Can anyone help on this?
Your loop is you allowing to read beyond the end of file names in your table. This passes an empty file name write it on the spreadsheet VI which requires to ask the name of the file. You should test this condition.
Maybe you are looking for
-
With the add-on armor, it was possible to send a command via the Console error remove all data from your server without having to "start over" with your profile. Is there something similar available for Firefox Sync?
-
What is the best video card for h8 1280t? Because it does not support 700s GTX :(
I bought a GTX 770 and found HP does not update the bios to take account of the series of video card. TOTALLY LAME. In any case, what IS the best card video, the MB - t supported? (Pegatron ECA2) I have a 550 2 GB GTX OC now so I would like to move t
-
How can I correct virtaul memory?
I get the message, that I am virtaul memory. How can I solve this problem? Please help me! .. Thanks a lot...
-
I downloaded malware to microsoft. Later (Odile is one). My problem is: if I start the laptop (XPS M1210) normally, when I want to start "Odile" - "Microsoft tool emergency response" (which seems to be the solution), the "personal shield pro 2.2" a
-
Ctrl + alt + delete: instead of a menu of auto start Task Manager?
I was wondering how to do ctrl + alt + del open Manager tasks immediately instead of a menu to open upwards and then having to choose the Task Manager. Thank you.