Analysis of vibration frequency
Hello world.
I have a little problem of frequency analysis.
I have to analyze the vibrations of a device and captured at normal product signals
a vibration using Laser and this in the but to just control of product quality
(be able to just using the vibratory signal to tell if the device is defective or not...)
Who has an idea of how I should proceed?
I have attached here is an example of what signal you can complete.
Thank you for your help.
Lauvia LabView V.7.1
Tags: NI Hardware
Similar Questions
-
I need help! Analysis of the components of the accelerometer Vibration frequency
Hello
I'm trying to analyze a signal voltage output of an analog accelerometer using Labview Full Development System.
I have no Sound and Vibration Toolkit, I am new to Labview and also new for the treatment of the Signal and analysis. It would be useful if someone could tell me if I'm doing it wrong. (or right...
 )
)My goal is to identify the components of the vibration frequency.
I enclose a file .doc showing the block-scheme of the code and sample readings I get. Could you please look and tell me if there is something wrong with the way I did?
Sincerely,
Ray I. Jason Crispo
jyang72211 wrote:
1. to increase the resolution, you look at the formula of resoluation, Delta f = (sampling freq) / (number of sample read). For you, the result is 1 k / 20 k = 20. You can increase the number of samples read to increase the resolution.
2. Yes, you must rename the axis.
3. I think it's just an artifact of the FFT. Tent to subtract the mean of your data and see you always get the point or not. Maybe someone can share more about this?
@jyang, thank you very much for this. I didn't know the formula for resolution. That's why I like forums. I would have never thought than mine.

I'll try what you say on #3 and post back the result here.
-
Analysis of low frequency - great obstacle, easy solution
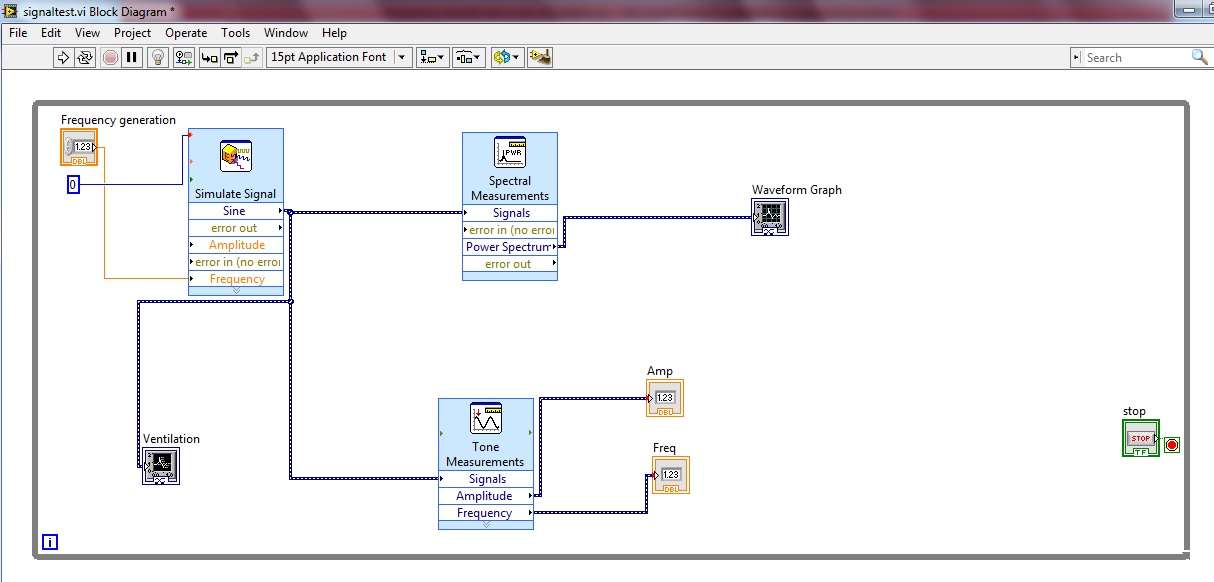
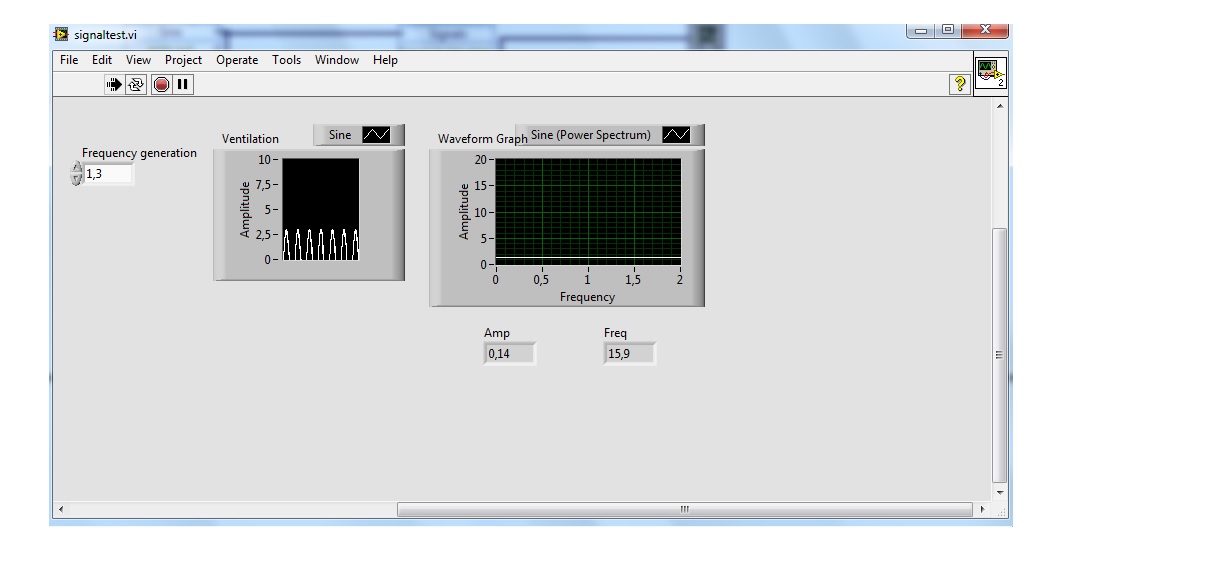
I'm trying to analyze a signal between 0-2 Hz. The signal is a clean sine curve where the amplitude and frequency changes.
I wanted to use the ExpressVI which is called "Your measurement" as I am not that experienced with Labview.
I used a signal generator to simulate, and it seems that it works very well for signals above 10 Hz. lower than that returns the high frequencies and amplitudes of false.
Please help me out here. The signal I'm generating is sampled at 100 Hz, with n = 10.
Well, I sort of figured it out by reading my own question. Increase the number of samples done...
-
Analysis and sampling frequency
Hello
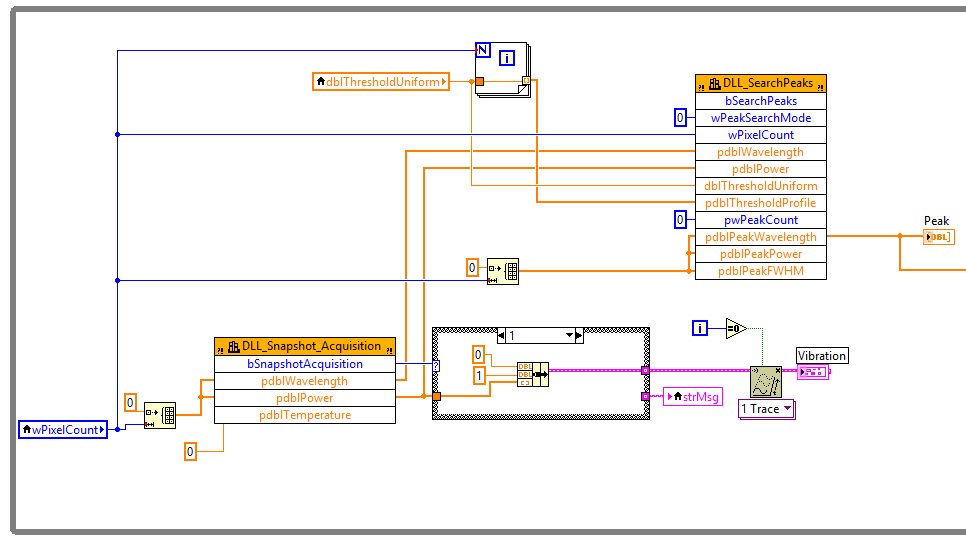
I had a device that could do 5000Hz sampling rate to get a spectrum each sampling. I put it in a while loop with vi Peak Search to find the spectrum peaks. Therefore, I would be able to get the value of 5000 peak seconds. However, the truth is, only, I could get a value of 40 peak per second. I guess there could be delays on the tops of the research.
Can someone tell me it would be possible to eliminate delay separating the part of sampling and part of the analysis? I think two while loops, first one collects all the spectra and the peaks of a seachs second. But do not know how to temporarily store data between these two parties.
It's a great idea! It's called a design ' producer/consumer '. LabVIEW is an example and a model if you want to give it a go. We are standing if you need assistance!

You have to invent it independently, however.
-
Help with fft vibrations without using the package of noise and vibrations
I'm looking for help in the analysis of vibrations. I use an example updated NI 9233 VI, to get a signal from the accelerometer for display using a FFT power spectrum. I'm not entirely sure if it works, because it's the first time I've ever done vibration analysis on LabView. So if you could explain a thing or two about vibrations or TFF, I'd be more than willing to hear from you. I have included my code along with a photo of an analysis of vibration of the computer, I work with. (even when I don't know if his work that I just thought it would be good to show an output)
Brandon
Data sheet:
I have LabView 2011
I FPGA, real-time
I have a model of research of Wilcoxon accelerometer 797-33
With an NI 9233
On a cRio-9012
Hi Brandon,.
You can use the FFT Complex (photo attached) to calculate the magnitude of the acceleration at different frequencies. You will need to take a little further to build a new waveform with this release, which includes d0, df and the output of the FFT. In order to calculate the df, please refer to the user manual on page 10-3. With respect to the scale that is output by the FFT, it must be same as input. Hope this helps to answer your questions. Thank you!
See you soon,.
CARISA Leal
-
Acceleration in the frequency domain
Hello
I enclose a vi that I already modified the existing example. I will use this vi to measure pressures (pressure sensor) and acceleration (from an IEPE accelerometer). Each of the two sensors is connected to a housed in a chassis CompactDAQ C Series module connector 4. The pressure sensor measures the pressure of the water flowing in a pipe while the accelerometer will simultaneously measure the vibration of this pipeline caused by the fluctuation of water pressure. In this vi, I am connecting a signal of pressure and acceleration TDMS file and then read the two signals on the cards of distinct waveform. The acceleration signal is written and read in the time domain. I need your help to make change more on this vi to take the acceleration signal and read on a separate table in the field frequency and written also the frequency of the field values in a file of PDM. After this change, the vi is supposed to have three graphics of waveform (pressure, acceleration time-domain and acceleration in the frequency domain and opens two tdms files, one for pressure and acceleration in the time domain and one for acceleration in frequency domain.)
I tried many ways all failed because I'm not very familiar with the measurements of vibrations.
I thank in advance.
Hello
It is important that you should decide if the frequency data you are interested in are constants based on time, or if you need to know how the data of frequency changes over time.
For constant frequency over time, take a look at the Fast Fourier Transform: http://www.ni.com/white-paper/4541/en/
If you need to know how the frequency display, take a look at the analysis of the frequency of the common time: http://www.ni.com/white-paper/3548/en/
-
Transient analysis fails: Timestep too small
I use Multisim 10.1 to assemble logic gates of transistors for an undergrad Electrical engineering class. Part of the specification is that doors should drive a 1 or 8 pF capacitor at the output in the 1nsec voltage. (I think that the circuit, which I've made available is the version 8pF).
"Circuits work very well when I test for logical functionality with a frequency of input measured in seconds, but when I try to measure the time of release of a Ghz entry, the transient analysis invariably fails with a ' no time too small" error.
I looked through the site or all kinds of possible fixes (adjustment of the values of the relative and absolute error, etc...), but no luck.
for example, the project in question are: http://dl.dropbox.com/u/4286123/callforhelp.zip
I would appreciate any advice, anyone can give me to help get the circuit able to run a transient analysis of higher frequency.
Thank you!
Brian Lojeck
Student in EE, CSULB
Hi Brian,.
I took a glance at your circuit and it seemed that your cmos_andx8_timing_test_circuit.ms10 file generates errors of convergence. I did the following two changes in the settings of your transient simulation and circuit simulated very well:
- Scan options > SPICE Options > Use Defaults Multisim
- Crawl settings > settings > no time maximum (TMAX) = 1e-13 s
As a general rule, you want to set the TMAX parameter to be substantially less than the smallest feature of your signal. In your case, the smaller is the rise in V1 (1ps) time. If possible, try to simulate with slower rise/fall times and slew rates. It is much easier for Multisim to converge semiconductor solutions if these settings were larger. I guess you do not have the luxury here, but if you were to just test the behavior of your circuit, it would be desirable.
Hope that helped.
-
I am LV 8.6 and MIO-16-E-1 data acquisition.
The DAQ Assistant to IO works perfectly.
I tried extensively - in vain - to display a graph of analysis of spectrum frequency of data acquisition (which displays the voltage only when you use the DAQ Assistant to e/s with this DAQ card).
All the efforts I made results in a time axis X instead of wanted ffrequency X axis.
I tried vi Express 'Spectral Measuments', of various FFT vi, the add-on 'Spectral Measuments' and the 'Signal Analysis' Signal Processing.
All of them were issued to a graph of waveform, in part by a cluster of power spectrum wire, in part through a wire double complex and partly by a thread of dynamic data.
All my attempts produced a graph of form of wave, but only with a time axis X, none freq X axis.
Of course, I monitor something very basic.
Any help would be appreciated.
The x axis 'Time' is just a text label that you can change to anything you want.
If the data is not correct, it's another story. I don't understand what you mean by 'Party'. There should be a single wire from the Express VI to the chart.
-
Report inaccurate frequency in the section analyzes frequency
I use the frequency analysis tool. While I can hear the note is at about 480Hz, the frequency said analysis is 3352Hz frequency and is a c# language. I'm sure I'm getting a partial stem, but do not know how to refine what it is reading so that it is correct. Someone at - it experience with this?
You can reduce it by putting the mouse just under the bottom line (corresponding to the scale) and by doing a right click and do drag the section you want to see (it turns blue as you drag so you can see how you have selected). If you want to restore, and then right click on the scale will give you options.
-
Installation of bench beginner for the introduction of analog measures
Hello world
I'm looking to install a system to help make some simle measures. This configuration will be used only by me at my desk/Workbench to help me better understand some parts of machine, that I as well as various other hardware troubleshooting. The I want to be able to take common measures are: stress/strain, vibration, temperature, force, torque and movement.
At this stage, this project is on a small scale. I'm not running from PLC or using data in order to operate a plant. This configuration will be about just myself, my computer and a piece of equipment, I need to test.
I currently have one 6003 NOR for my use that would be preferable to use, but if I need a stronger DAQ so I can get to the need.
My main question is if I can get aqeuate with hardware DAQ 6003 and results if I would be able to condition enough signls accompaniment or if I need a DAQ with higher resoluion and a signal conditioner sufficient. My concern is whether or not I will be able to properly signals on status of piezoelectric sensors at vibration action. Is there a way to produce viable results, or I'll have to come back a more capable DAQ? I wish I could do an analysis of the frequency on trees engines operating normally at about 60 Hz. It would be nice if I had the Betacam to observe signals of up to 150-200 Hz at least. In my case I don't need extremely accurate results if I can go out with an afforable configuration more. I think that a level of trust of value p final (90%) will go well at this time.
I'm still quite new to data acquisition and signal conditioning. My purpose behind this, especially to learn how to take the right steps correctly more than I worry accurate results.
If someone could give me their thoughts about this I would be very grateful.
Thank you kindly,
James
James
I think you need to split the signal conditioning in data acquisition. I suggest you watch the series 7B Analog Devices and some of the imitators, for example Acromag.
http://www.analog.com/en/products/landing-pages/001/7B/7B-Series-Overview.html
Essentially, you choose a module specialized for each measure of your choice. The modules are isolated, at least reduce signal interference problems. Sensor excitation, e.g. for the strain gauges is provided on certain modules. You will need to study the performance of frequency to get the 200 Hz on some modules.
The modules plug in a motherboard that can then be connected to any data acquisition system that you like.
Or the versatile NI9219 can better meet your needs.
-
Looking for set up the NI 9233 module, well through which bus?
I'm a bit new to conducting analysis of vibration at high speed... I see a ton of information on the programming side of things software, although my main concern now is getting the correct 1st place material.
Right now my apron for the acquisition of data consists of the following: 1) a main office or a laptop with a LabVIEWsoftware platform that integrates a live view of bench test-data acquisition & control, as well as analyses of multiple entries of aircraft during and after the test. Joined this office/computer laptop peripheral multiples are the following:
1) dedicated output options control & daq device with 2 semi-PLC data: a) medium... Data USB 1 sample per second... it is for read-only purposes, & b) CAN input/output... 10 samples per second output of data and allows a command input from the desktop/laptop via a CAN of NOR-8473 USB converter.
(2) NI DAQ hardware entered via MAX configuration.
My main concern is that I don't want to create a bottleneck for the input of vibration DAQ data. If I'm looking for a sampling up to 5 000 samples per second max and 200 samples per second minimum for vibration analysis, will I be able to get this amount of data per second using the NI 9233 module through the USB configuration? I have several USB devices connected to the desktop/laptop PC computer (such as the other USB DAQ modules input/output) will limit these the input of the speed of the NOR-9233 module?
My next concern is to know how to set up my present VI during the execution taking all the entries data acquisition (which some 1-sample per second, others to 10 samples per second)... when I start taking at a sampling frequency of 5 kHz for the diagnosis of vibration, to, I just average on the other zeros that will be read from other devices? And then I'll most likely need to add another temporal loop controlled to allow only once 4 / per second output outside remote so no timeout for this device.
What would be more efficicent this setup for the 9233 module that I could use in a satisfactory manner? USB, PXI, CRIO?
Also, is the Sound & Vibration Analysis toolkit useful? I didn't check yet but it it has a cost of deployment for each executable?
Thank you.
I thiink you'll be suprrised with high speed USB features. For example, when we went out first with CompactDAQ, we put 8 the 9233 modules in a chassis and down them to full (32 channels at 50kSA/sec).
If you have a laptop dual core, with good USB 2.0 ports, you can use a port for the USB - CAN (which is relatively slower), the PLC is a slow sweep (100 Hz or more) and then a Compact DAQ chassis for all your stuff really high speed, you should be fine.
It is difficult to reference without having the full application. My experience suggests all data enter the PC will be the easy part. How you manage and analyze the data will determine how much control you are able to do.
-
Ridge SVFA and the Relative Phase amplitude must be reentrant
I think I found an obscure problem with one of the "Baseband FFT" s VI on the 'Frequency analysis' subpalette of the Sound and Vibration Measurement Suite. "
The "Peak Amplitude and Relative Phase SVFA" is set to no reentrant run, but I think it must be defined on preallouee clone running reentrant. All the other "Baseband FFT" Vi on the 'Analysis of the frequencies' subpalette are implemented reentrant preallouee clone. This is crucial, because if you use multiple instances of the same VI on a block diagram and feed each instance of another set of entries of waveforms, each instance must maintain its own internal state FYI channel, sampling rate, on average, etc.
I just found out the hard way after a lot of debugging this including VI has been implemented not reentrant. On average maintained automatically delivered to zero with warning 1908. Of course, I had two instances in my diagram, each receiver signals a different set of channels. Because the VI is not reentrant, he was running an instance with a set of inputs of waveform, then execution of the other instance with a different waveform entries together, then in back and automatically reset on average to each time because the channels kept alternating.
Don't I have that right?
Jeremy,
Looks like our test coverage can use some improvements. You're absolutely right - this VI was to have been put to preallouee clone environment. EI which was originally filed repsonded CAR # 570225 to our development team and it's been fixed for the next version of the software Sound and Vibration.
Each new version, we write one articulates KnowledgeBase documenting these fixes, for example: the list of fixed bug in 2015.
Keep an eye on fixed bug list for the next version and this CAR ID to appear in this topic.
-
DASYLab how to write data to a file every 15 minutes
Hi all
I use dasylab and datashuttle/3000 to record data. What I want to do is to write data to a file every 15 minutes. I use the milti-file, which can write data to the file diffenret, but how do I control the timing, as the journal data every 15 minutes automatically.
The other problem is that I use FFT analysis of the frequency spectrum. How can I determine the value of frequency where the peaks that happens.
Thank you
Write less data in the file that you have collected requires the reduction of certain data.
There are three techniques to consider.
With an average or an average of block - both reduce the data by using a function of averaging, defined in the module. To accomplish the reduction of data, choose block or RHM mode in the dialog box properties, and then enter the number of samples/data values that you want to reach on average.
Average - when you reduce the data, you also should reblock data using the block length of the change in the output parameter. For example if you enjoy at 100 samples/second with a block size of 64, the average module configured on average, more than 10 samples will take 10 times longer to fill a block. The initial block represent 0.64 seconds, the output block represent 6.4 seconds at a sampling rate of 10 samples/second. If you change the size of output in one block, the program remains sensitive.
Average block - average values in a block against each subsequent block, where the average is based position. The first samples are averaged, all second samples are average... etc. The output is a block of data, where each position has been averaged over the previous blocks. This is how you will be an average data FFT or histogram, for example, because the x-axis has been transformed in Hz or bins.
Second technique - separate module. This allows to reduce the data and the effective sampling rate jumping blocks or samples. For example, to reduce the data in 1000 samples / second to 100 samples per second, configure the module to keep a sample, jumping 9, keep one, jumping 9, etc. If you configure to skip blocks, you will not reduce the sampling frequency, but will reduce the overall amount of data in a single block 9, for example. It is appropriate for the FFT data or histogram, for example, to have the context of the correct data.
Finally, you can use a relay and a synchronization module module to control. For example, to reduce a sample data every 15 seconds, configure a generator module of TTL pulses for a cycle of 15 seconds of time. Connect it to a Combi trigger module and configure it to trigger on rising and stop the outbreak directly, with a trigger value after 1. The trigger output connects to the X of the relay command input.
In addition to these techniques, you can change the third technique to allow a variable duration using a combination of other modules.
Many of these techniques are covered in the help-tutorial-Quickstart, as the data reduction is one of the most frequently asked questions.
In regards to the FFT... use the module of statistical values in order to obtain the Maximum and the Max Position. The Position of Max will be the value of the frequency associated with the Maximum value. The output of the statistics module is a single sample per block. Look at the different FFT sample installed in the worksheet calculation/examples folder.
-
Detection of overruns of vibratory limit with FFT
Hi all
We follow a piece of rotating machinery for vibratory limit overruns. Our acquisition of digital data is running at 3333Hz with anti-aliasing in front of the ADC analog filters. We sample at least 5 times on the highest frequency of interest. We then duplicate the measured data and apply several sets of filters band pass to divide the specrum in several frequency buckets watching us then for exeedences the limits defined.
We head to dedicated hardware for our analysis of the frequency of a solution all digital. I have a display FFT showing the linear magnatude of the signal over the frequency. Then, I want to implement limit control on the output of the FFT for real-time tracking. We will always post our data in frequency bins and will have a second look to limit cost overruns after the fact.
As most seems, I had trouble doing exact enough amplitudes of the FFT. Not sure if my problem is spectral leakage or a total lack of understanding FFT. I think it's the latter.
My sample VI has a capture of dynamic data with a real overtaking in the bandwidth of 4-50 Hz. The limit is 5 across. Amplitude in this bandwidth was almost 10. I've included a screenshot of exceeding the limit on the face before of the VI for reference. I have also indexed data saved to the point where the excceedence is visible on the raw data.
I tried using a FFT to visualize this limit so that I can detect the overflow, but I have not been successful. FFT tried several methods and all do not reach the height. Those smarter than me could give it a try? I don't want to run multiple filters of past band by signal in real time, as we do post-processing. I am trying to monitor and display data between 8 and 24 channels. I am concerned about the limits of my processing power to stand in a real-time environment close.
Thanks for the help! And I would like to know if it's just the misapplication of an FFT and if something is better in order.
-Chris.
Lynn,
Thanks for the reply! I tried the inverse FFT road as well, but my implementation was nowhere as clean as yours. I had to spend your complex 1 d inverse FFT block to match the data source however. The actual parameter was twice the amplitude of output. Update attached VI.
I like this solution and you will use Fortunately!
I have an another question though. My company uses not rms. All our limits are in peak (peak-to-peak) / 2. We can also assume that all the waveforms are sinusoidal and so impossible to convert from rms to crete with a root of 2. I'll need a FFT function that does not export in rms. In Matlab, our guys had to code our own FFT function as rms output all built-in functions.
Any ideas on where to find a FFT function that does not export in rms? Annoyingly, I need then inverse FFT in rms as well to match.
-Chris.
-
condition of gearbox fault indicators
Hello, I was given a few files to read and perform the signal processing to estimate the 4 lights for a gear box fault status. Also asked me to perform a frequency analysis using advanced techniques. I have used labview for the first time this week and the need to understand how to go on this issue.
Will be really grateful for the help for the lights of breakdown and analysis of the frequency
It looks like not LabVIEW is limiting your factor. Nobody's even immediately LabVIEW.
Instead, understand your algorithm. Just don't you said will allow someone to help you. This means that you probably don't understand the problem.
Signals how do you read?
What defines an error condition? (In other words, how would measure you a fault? Is it a fault if it exceeds a threshold? Is it a fault if she moves too fast? Is it a fault if it does not evolve?)
Are what is your analysis of frequency you supposed to do? Is there an 'Advanced' operational need in any specific technique or is it your way of saying that you want something more than just to see what is the frequency?
Maybe you are looking for
-
Why FF accesses the Internet almost continuously?
How can I stop FF accessing the network once a page has been downloaded? I tried to turn on/offnetwork.dns.disablePrefetch Boolean false to true, andNetwork.prefetch - next boolean true to falseusing about: config, but it did not help. I'm afraid tha
-
Being in China, all pages with forbidden sites take minutes to load; most of the time, firefox displays for a while 'loading platform twitter' or something similar, before finally to display the page with "small holes".So I would like to ban complete
-
HP ENVY 17-j184na Notebook PC: problems of wireless connection on the new laptop
I bought a new laptop a few days ago and tried to connect to the network without wire in our apartment for 2 days but nothing helped. So far, I did the following steps: -Restore the system to factory settings. -Powercycled the network. -Reset the TCP
-
How to find the owner of an iPod Nano?
Hello world Back in November-ish 2015, one of my friends found an iPod Nano home from work. As it uses no products Apple, but I do, he passed it on me to see if I could work to which he belonged. I've been able to determine the serial number and the
-
I'm not exactly computer savvy, so I hope someone can help. I bought a hp2000 a year and half ago. I don't know if this model is supposed to turn on with just the adapter or not. If so, then it is not. It turns on only with the battery. Also, I recen