cwgraph
IAM using cwgraph3D in my Vi. Apllikation (exe) works well on some PCs, but on others that the CWgrap3D is not loaded.
The Vi is runnning without any problem that only the CWGraph3D is not loaded.
Error message that is shown in the Panel before 'konnte nicht werden loading Element '. "
What should I do to fix this?
Hi CKoch,
Did you use an executable distribution or distribution of the installer?
If you used the executable distribution runtime on the client computer is probably missing the cwgraph3d and as a result the customer will be able to display this graph.
Solutions:
1 make an installer for the application
2. install the complete LabVIEW runtime engine on client computers (download version 8.6 here)
If you have an installer, I suggest that you download the full version of LabVIEW runtime engine and install this on the client.
Best regards
Peter S
Tags: NI Software
Similar Questions
-
I am trying to use the CWgraph to display data from the serial com port but there is no chance. I used the mschart1 but that comes with VB6 and everything works very well, because they need to acquire 3 hours of testing, I would prefer to use Measurement studio.
I'm going to fix my code, Hope you can help me guys.
PS: I'm using VB6 with M-studio v 2.1
kmous,
Yes, zoom out on the 2d chart, you want to
the value of the TrackMode to TrackZoomRectXYWithUndo so you can cancel the zoom.
It's the best way to essentially to zoom out. To obtain your code, you can
to add a control to your timer code to check the valid data before
draw you it then you are not drawing the leading 0 before getting your
data. Together perhaps a sort of boolean flag as soon as you receive data
is not 0 (rather than throw all 0s, so you can always trace 0 s
later if you get them) -
Ladies and gentlemen,
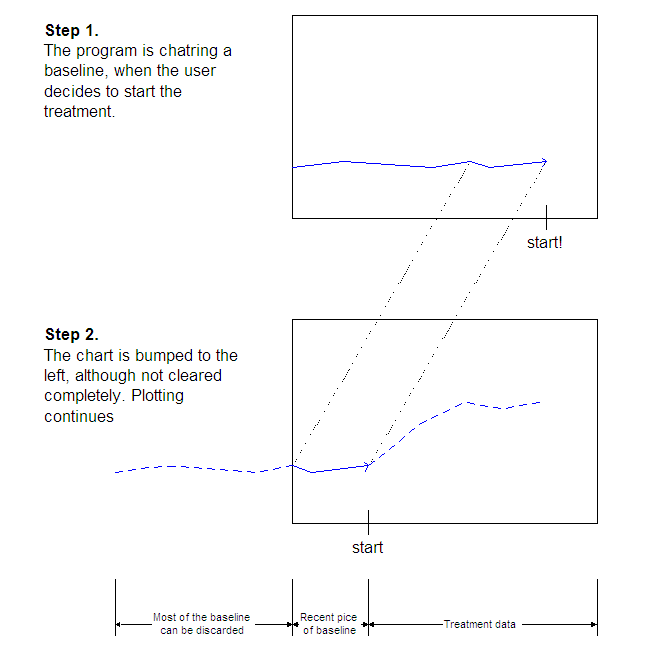
Does anyone know how to scroll through the control CWGraph? This is the behavior I want to achieve:
1. the axis of the graph X ranges from 0 to 3000. In the beginning, is to trace a base line (using the charts).
2 suppose that it was rated at 2500, when the user starts an experience.
3. graphic has immediately Scrolls left leaving only the last 500 points of the base line - that's the part that I do not know how. The rest can be thrown.
4 tracing experience continues to 500 from.Could someone give me some suggestions?
Thank you
-NickP.S. I use VB6 and Measurement Studio 8.1.11.
This is the same behavior on a table of Storyboard:
Hi Nick,
One way to do would be to set the lower limit of axis to the current x position - 500 and above all linked to the lower limit + 3000. If your question relates to the implementation, or if you have any other questions, let me know so that I can continue to help you!
-
Save CWGraph.GraphFrameImage in file bmp
Hello
I want to save CWGraph.GraphFrameImage to the bmp file. How should you do? I can't find the CWGraph method to do so.
Please help me.
Thank you.
Dear FAT:
Thanks for your kindly reply.
I found the 'exportstyle' method is export the CWGraph style, not save the image in CWGraph.
We can use the method > "ControlImage" to save the image in CWGraph. This can work.
-
CW and CWGraph controls have disappeared from my c# Toolbox.
Hello
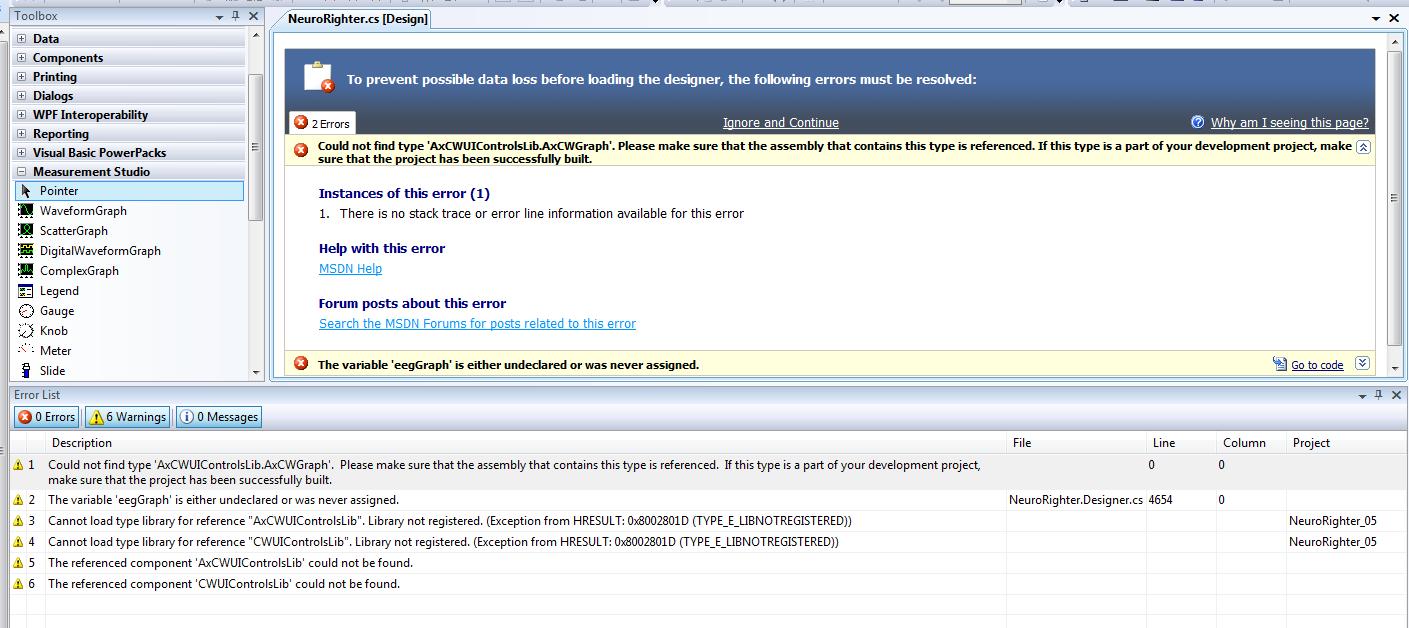
I'm working on a c# application that integrates many libraries of NOR. I correctly built my project several times. The last time uninstalled my request, several dependencies have been removed in the process. Specifically, the CWGraph control element no longer appears in the COM objects can I put in my list of the Toolbox and all the objects that are declared with this dependence are never reported (see attached photo). Someone has an idea how these depedencies have been deleted and how I can get back them? Thank you.
-Jon
I think that you need to repair or reinstall Measurement Studio.
-
Ticks on both sides, CWGraph 3D axis values
Hello
I use Surface.vi 3D terrain surface 3D in CWGraph3D control. I put the Direction to the view (top) X - Y plane. I am able to check you for ticks on both sides of the lines, but I don't know how to duplicate the value labels and ticks (see attachment).
Any help will be greatly appreciated.
Best regards
Martin
-Sorry I did not mention the details. In 2015, LabVIEW, and I believe that it requires Full Development System
-https://zone.ni.com/reference/en-XX/help/371361M-01/lvpage/3d_graph_properties_db/ -
Hello
I connect to a scope TDS 2002 b under Windows 7 (x 64) via USB using a combination of NIVISA (for support of 64-bit drivers) and TekVISA (for the ActiveX control I need using Delphi 7).
All I want to do is dump the data of a graphic waveform (as in the TekVISA (ActiveX) Delphi example) which works very well.
Under Delphi XE/XE2 TekVISA ActiveX control fails (on a single line of code Pascal) when importing which is a shame that the project will have to be developed using Delphi 7.
I know that Delphi is not officially supported, but if another Delphi user had this problem when you try to use the TekVISA control in new versions of Delphi.
The control looks pretty old (from the date of the OCX file and the command button graphics!), there might be something I have to live with, unless there is a more recent version, that I don't know.
Control of the assets of NIVISA also has the CW3D graph. I can't seem to find the ActiveX control that uses the CWGraph (version not 3D). Still, I expect to the latest version of NIVISA passed.
Best regards
Richard
Hi Richard,
Welcome to the National Instruments forums!
I recommend contact Tektronix or Delphi support and post this question on their forums, as you might get better answers in assessing compatibility TekVISA and Delphi.
Tektronix: http://www.tek.com/
Delphi: http://www.embarcadero.com/products/delphi
NI-VISA is a set of drivers that are used for communication with instruments and contains no graphic CW controls. These controls are part of the CWGraph ActiveX MeasurmentStudio controls.
I found a few resources to do with the CWgraphing that may be useful:
http://zone.NI.com/DevZone/CDA/EPD/p/ID/5402
http://digital.NI.com/public.nsf/allkb/FBDD8265C99866CA86256F770072A017?OpenDocument
http://digital.NI.com/public.nsf/allkb/5E205D2D81C37A5086256FEE006CB378?OpenDocument
I hope this information helps. Feel free to post if you have any other questions or need to better understand the problem.
Kind regards
-
question of activeX cw graph3D time format
With regard to the component works / ComponentWorks 3D chart control ActiveX OCX:
I have a table of LabVIEW timestamp ("the default value is zero seconds since 12:00, Friday, January 1, 1904, universal time [01/01/1904 00:00:00] '") that I convert it to an array of Doubles.
I would like to pass this array to the OCX (after conversion) as my y-axis. I have configured the OCX to display DD/MM/YYYY HH: mm
 using the property editor. In addition, if you dig into the documentation of OCX, in the section that details the formatting strings, it is said:
"The ActiveX control, the date is implemented as a floating-point value, measuring days from midnight, 30 December 1899. Thus, midnight, 31 December 1899, is represented by 1.0. Similarly, 06:00, January 1, 1900, is represented by 2.25, and midnight, 29 December 1899, is - 1.0. 06:00, 29 December 1899 is however - 1.25. To interpret the time portion, take the absolute value of the fractional part of the number. Thus, a second is equal to 1 / 24 hours / 60 minutes / 60 seconds, which is 1/86400 or about 1.157407e - 5. »
Maybe my coffee is not strong enough today, but I don't see an easy way to convert the format of LabVIEW in the "ActiveX format" while properly accounting for leap years etc...
My first hope is that someone already has, my backup plan is to have a good brainstorming on the forum on how to do this?
Thanks for any input on this!
I made a few changes that might be useful for others, or in the forum.
In my case, I have an array of strings, which gives the date and time for when the data has been captured.
The date and time strings were captured in another time zone of the computer where I run the analysis and visualization. Therefore, you must take care so that you don't end up adjust your time incorrectly based on your analysis computer-time zone schedules vs. where the data has been captured.
I don't know if there may be a more smooth way and more optimized to do this, but I compared it and for data sets that I'm loading, the time required to perform this conversion is fairly trivial.
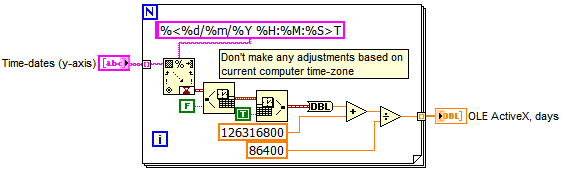
I guess the point key to looking people should take away the format "chain" and "format of the string" VI is extremely powerful and his is worth the effort of learning of the March bump in the way to create the format specifier strings...
The code in the image shows how to convert a string to the time format format OLE/ActiveX without changing time I have in the original string array. I can then feed what (in my case) table of axis y for the CW 3-d chart where my axis has been configured to display 'time' (container, right-click ActiveX, "CWGRAPH 3D--> properties", go to "format" tab, select your axis and choose the display format of your choice.)
as by chance, doing the same use the xControl turns into a nightmare when the only solution I found was to use pairs of value and a lot of code to manage the positioning and the decimation of the value pairs to work correctly... Overall, my treatment has now passed a lot for next to nothing... and as a bonus, the CW graphic cursors use the same formatting settings, so that my date/times on the slider too, on the xControl, the use of cursors the part number of a pair value, so your cursor does not match your axis...
-
Dynamic creation and tracing in CNiGraph
Hello
I would like to create a temporary object of CNiGraph, plot data and make a picture. I am able to create the object dynamically (I think) but I get a runtime error when you try to plot data (using Idrsqu) on the graph.
The error is in the AfxGetAmbientActCtx function.
My code for creating control looks like:
CNiGraph niGraph;
CRect rect (CPoint (0, 0), m_Size); the size of the graphic
CDC * pDC is pWnd-> GetDC();.
BSTR bstrLic =:
ysAllocStringLen (/ * stuff to generate the license * /);niGraph.CreateControl ("CWGraph", "", WS_VISIBLE, rect, pWnd,)
m_staticControlID ++, NULL, FALSE, bstrLic);
Use static control ID to ensure unique IDs
:
ysFreeString (bstrLic);ChartPreviewData (niGraph, pList, settings);
... is the result of an untested for the rendering of an image code
pWnd is a CPropertySheet (a window is valid, but I use as a model to temporarily hold the chart). ChartPreviewData for this...
void CXyzClass::ChartPreviewData)
CNiGraph & graphic,... a few other arguments...)
{
a code to get ready to put in the vector data ORCNiReal64Vector niVector (numPoints, pBuffer);
Graph SetChartLength (numPoints);
The data graphic and set delta X to reflect the sampling frequency used
CNiPlot field = graphics. Plots.Add ();
parcel of land. MultiPlot = TRUE;
parcel of land. Charts (niVector, (double) 1 / pSeries-> GetFs()); crashes
Remove pBuffer;
}
When I scroll in the debugger, it looks like NiGraph gets created correct. In fact, I can see from the dialog box. However the call Idrsqu gives me a runtime error. I suspect I'm missing something to do with ActiveX, but I don't know what.
Thank you, Nick
Sorry, it's resolved. I had a stupid mistake and going on a vector of length zero to Idrsqu.
I discovered this way upward in the call stack an exception was thrown for this reason.
Maybe you are looking for
-
my laptop wouldn't load Windows, but then a screen came and gave me a few options (i.e. turn PC on / off) I did. It did not work. I clicked on the solutions in advance that gave me two options: 1. reset - which would keep my files but delete all the
-
How can I send an email to multiple recipients without showing all recipients
I want to send an email to a group of people but do not want all the names or the displayed addresses.
-
Fehlermeldung bei round-Fkt im Formelblock
Hallo, in einem Formelblock möchte ich die ankommenden auf drei Nachkommastellen Runde (DIAdem 11.1) values. Refer habe ich einen Formelblock eingefugt in dem ich following formal eingegeben habe: Round (D, 3) Dear erhalte ich following Fehlermeldung
-
Graph of intensity for XY graph
Hi, I m working with LabviewRobotics, create a matrix (occupancy grid), the values in the matrix are 0 or 100. I want to draw this information in a XY Chart, where 100 will be a point in the graph.What I need is to get all the combinations (x, y) whe
-
Try to connect to my wireless PC.
I recently bought a Wireless Connect from SanDisk stick. First of all, can someone tell me where to find the Unique identifier that I misplaced the documentation that came with the camera? Second, can someone tell me how to read files on the wireless