Data output Incripting
Many of my programs use file.vi custom writing or writing in the file.vi worksheet and save the output in a spreadsheet data standard tab-deligniated, .lvm file. My question is if there is a way to make an incripted file so that it is saved in read-only mode, so that you can just go and change the data that have been recorded.
You can set the permissions of the files with this tool. This has nothing to do with encryption.
However, it does not really a hard limit. Instead of trying to prevent the change, maybe it's enough to detect changes, for example by including a hash of the entire file somewhere.
Of course, you could encrypt the entire file so it can be read with the help of specific tools.
Tags: NI Software
Similar Questions
-
How to stop compensation labview my data output by a fixed amount of 0.125 seconds of every second iteration 1? (I have my DAQ Assistant contained in a while loop so that I can control the number of iterations and therefore the time of sampling).
My apologies for such a badly phrased statement of problem. The question I faced which was the sign that I was getting a pair of accelerometers and through an amp. in my DAQ board felt an offset in voltage for a short period every second iteration 1. It turns out that the problem is that my laptop and the AGP were grounded. Once I disconnected the signal ground in the shift of the signal amp went.
Thank you for your messages.
Kevin
-
Data output DASYLab stop after 10 points
Let me Preface everything by saying: I'm a novice at this. Now that's the road...
I'm having a problem getting more than 10 data points to save in an output file. I'm sure it's a conflict of implementation, but I have no chance to understand.
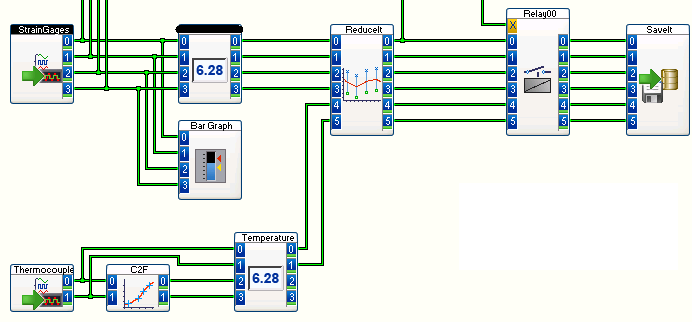
I have two tasks in Measurement & Automation Explorer: the first strain 4 check gage, signals of temperature 2 second record. Strain gage signals are coming in a NI 9237 module and the thermocouples are coming in a NI 9211; the two sat in a NOR cDAQ-9188.
DASYLab (v13), I have the configuration shown in the attached image:
When I click on Play, everything seems to work fine (i.e., no error message), but when I stop and open the CSA generated there are only 10 data points, a point every 0.1 second for 1 second.
Can someone point me in the direction of the parameters that control the collection of data, either in DASYLab M & AE? Thank you!
Thank you for responding so quickly!
As I was typing a reply, I noticed something in the Timing settings in the tasks of M & AE. The acquisition Mode has been set on ' n of samples. I changed the mode of 'continuous samples', and he is now recording as I expected. I still don't know what has been defining the "N" like 10, because the samples to read has been fixed at 10 k, but since it now seems to work I'll leave that for another day. Thanks again
-
Epsillon (electrochemistry). DAT want to tracing of data output
I am using electrochemistry Epsillon material. The output is a. DAT file (which can be read as text in Notepad). I want to know if someone can help me to have LabView read the desired direction. DAT, take the 2 columns of data and output field. It would be extremely useful. I tried dat help in the forums, I don't need the file to be converted to excel and then out again since I have two columns, I need. Any help would be greatly appreciated.
Thank you
Because the file is not download the extension, I downloaded here.
http://www.qfpost.com/file/d?g=dagfbieV7
-
analyzing the graph of a given data output
Hello
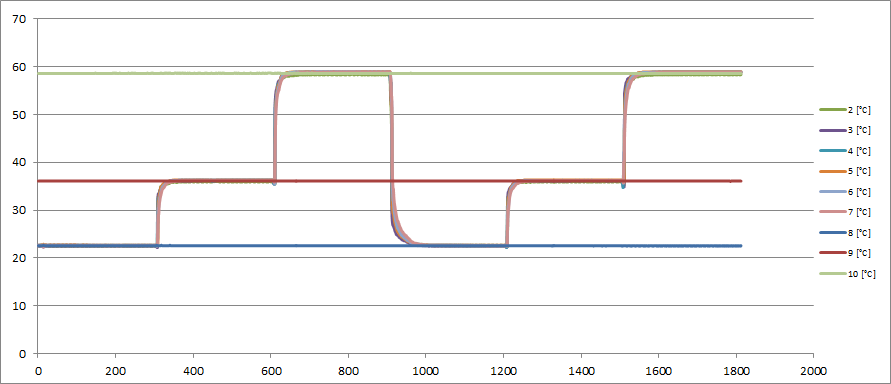
I have this graph
These data are represented graphically by excel from an output of a data logger file.
I am looking at 4 main channels.
Channel 2 or 7 (they are pretty much the same thing... Purple is behind rose)
temperature of channel 8 (dark blue line) 22 c
Channel 9 37 c body temp (read line)
extreme temperature of channel 10 (green line) 60 C
my recorder, I'll make it through this test, I don't know how many times, but I know with certainty that these 3 times are the only values I'm looking for.
22, 37 and 60.
Anyway is to calculate the time it takes to 22 c to 90% of 37 C.
How do I put this logic? I want to do it for every jump in the graph.
22-37, 37-60, 22-37, 37-60
I have to calculate the time it takes 60-22
can someone me guy in the right directly.
Thank you
Watch in treatment-> palette of measurement of the Signal waveform. The transitional measure should do what you want.
-
storage of the data output of while loop
Hello
I have a data acquisition system set up to read the couple of a transducer. The output needs to be fed with an excel document, once the program stops running, or when a key is pressed.
with the current code attached, the excel document is created, but it only shows the most recent series of data. How to make the table to store all the data coming from while loop?
Ive only been programming with labview for two weeks, so chances are that it is something simple, but please help us in any case.
JM
To get what you expect, the Terminal output of table a while loop right click and select the option activate Indexing. Usually if you want to save data use queue to pass data inside the while loop to another loop/VI and perform data recording. For all that you have examples, please do a searc in LabVIEW help > find examples.
-
With an average of the data output.
Hello
I am a new user of Labview. I need to write a labview program that will average my output in a single data data.
Basically I have an XY graph which results in a table and the idea is to average the data points.
This is the kind of program that I use.
Thank you
Mutah
Hi Nicole,.
You can index the table and use the average function (within the mathematics - probability and statistics). Then, you will get the average value of each table. If you want to see the averages in a table, then you can combine average values in a table again...
Hope this help out you
-
Distribute the data output waveform of niScope Multi Fetch Cluster
Now divide the data in a table 1 d of the clusters. I use a PXI-5421 function generator and a PXI-5122 digitizer. The output data of retruns NiScope Multifetch Cluster.vi of the waveform as a table 1 d of the cluster of 3 elements. This table contains the information of channels 0 and 1. I am trying to extract information from component waveform of each channel, so I can work on them a wave two re - assemble. Can someone point me in the right direction? I can't seem to find the right tool in the tools of painting or a cluster of. Thank you.
Jeff
You just use a table of Index and a Unbundle by name or Unbundle.

-
How to set the date output Excel in RTF format
Hello
I have a report and I have a date named as period column. And I need this field as this MAY-11 output.
So I used this tag <? format-date: CREATION_DATE; "MON - YY'? > when I ran and see the results in rtf his works very well and the exit is on MAY 11, but when I see the result in Excel format its does not display correctly. It shows as 11-MAY '.
Can someone tell me if this is a format problem or a problem with excel.
Thanks and greetings
SrikkanthYou can add two spaces at the end to prevent excellent formatting, so that it treats the field as a text.
-
I have an obligation to produce a file of ASCI with Pub BI return fixed-length that can be imported into 3rd party applications. We used forms to use the CLIENT_TEXT_IO package to do that (see below). What is the best way to do bi using an rtf model? I saw a few mentions of XSL-text models, but could not find a reference sample.
DECLARE in_file CLIENT_TEXT_IO. TYPE_DE_FICHIER;
in_file: = CLIENT_TEXT_IO. FOPEN (loc_f_name, 'w'); / * Open the file * /.
BEGIN
FOR phoneloop in phonelist LOOP
tmp_sbrs_id: = rpad(phoneloop.sbrs_id,8,'~');
tmp_sbrs_last: = rpad(phoneloop.sbrs_last,18,'~');
tmp_sbrs_first: = rpad(phoneloop.sbrs_first,13,'~');
tmp_sbrs_middle: = rpad(phoneloop.sbrs_middle,11,'~');
l_record: = tmp_sbrs_id |
tmp_sbrs_last |
tmp_sbrs_first |
tmp_sbrs_middle |
tmp_status |
'~';
l_record: = replace (l_record,'~ ',' ');
CLIENT_TEXT_IO. Put_line (in_file, l_record);
END LOOP;
CLIENT_TEXT_IO. FCLOSE (in_file); / * Close the file * /.
END;That is right. But this is not the point. The Office of BI Publisher CONTAINS the
Generator model for Word, but it includes a little more while.The BI Publisher Desktop comes with SAMPLES and these examples also contain
eText examples so you can look at them.You can also RUN these examples using also included 'Model Viewer '.
You must(1) run the Model Viewer.
(2) select the folder that contains the sample data and the model. On my system:
C:\Program Files\Oracle\BI Publisher\BI Publisher Desktop\samples\eText templates\example1(3) select the XML (i.e. ts1) and model of e-text - a RTF file
4) go to the bottom and select the output format "eText.
(5) click on the 'treatment' to start
-
abservation input until the data output data
Hello
I want to see, since when the input of computer data until appear data see what happens!media, film or photoHow to get the compilation, for example, or how to get into the bus, the process and the segmet... etc.. .TNXHey k1.technology,
Looks like you are trying to understand the technical processes behind the programs. Microsoft Communities is a consumer focused forum where we focus on consumer-level issues. The type of information you are looking for is very technical and not something that is easily explained in a single post or thread.If you want to understand how function calls or how you can write your own, I highly recommend to contact your local community college and used to sign up for a computer class. You can also check Microsoft's Channel 9 for a lot of fantastic about the applications of understanding and their operation:I hope this helps! -
Agilent 8753ES .csv data output format
I need to be able to read files .csv results of an Agilent 8753ES, in my LabVIEW program.
However, I do not have access to the 8753ES.
Can someone give me an example of the 8753ES .csv file, so that I can make a start on the production of the code?
Thank you very much
Dan
You can also simply gather S21 data directly from the Network Analyzer and then you can save it in any format you want. That's essentially what we do here to collect calibration data for the RF paths to the test configurations.
Attached, is an example of a .csv file. This is S21 data scanning thanks to an adapter.
-
Need help in the drafting of SELECT (strange, many data output?)
Hello
I have:
I need to write a SELECT to get an output like:drop table jk_t1; drop table jk_t2; create table jk_t1 ( c1 number, c2 varchar2(3), c3 number ); create table jk_t2 ( d1 number primary key, d2 varchar2(4) ); alter table jk_t1 add constraint t1_t2_fk foreign key (c3) references jk_t2(d1); insert into jk_t2 values (1,'T2_1'); insert into jk_t1 values (1,'A11',1); insert into jk_t1 values (2,'A21',1); commit;
I'm working on:<ALL> <D1>1</D1> <D2>T2_1</D2> <INN> <T1> <ROW><C1>1</C1><C2>A11</C2><C3>1</C3></ROW> <ROW><C1>2</C1><C2>A21</C2><C3>1</C3></ROW> </T1> </INN> </ALL>
but the output isSELECT XMLElement("ALL", extract(XMLType(CURSOR(SELECT t2.*, XMLElement("T1",extract(XMLType(CURSOR( SELECT t1.* FROM jk_t1 t1 WHERE t1.c3=t2.d1 )), '//ROW')) as inn FROM jk_t2 t2 ORDER BY d2) ),'//ROW/*') ) AS output FROM dual;
Should SELECT what be to give me correct output?<ALL> <D1>1</D1> <D2>T2_1</D2> <INN> <T1> <ROW><C1>1</C1><C2>A11</C2><C3>1</C3></ROW> <ROW><C1>2</C1><C2>A21</C2><C3>1</C3></ROW> </T1> </INN> <C1>1</C1> <C2>A11</C2> <C3>1</C3> <C1>2</C1> <C2>A21</C2> <C3>1</C3> </ALL>
Thanks in advance,
Sandrine
-
TO_CHAR wrong century of data type date output
NLS_DATE_FORMAT DD-MON-RR
Please help me to solve my problem.
From a date data type DATE_REC_ESTAB
-------------------------
27 FEBRUARY 95
TO_CHAR out YYYYMMDD this result 20950227
How can I fix this problem of century must show in the previous century of 1995. Thank you.First of all, standard warning... It's horrible at the time to have a specification of file data exchange between systems that uses a two-digit year. That's just asking for pain and suffering. If there is a possible way to change the specification to spend a year in 4 digits, one who has to keep this in the future will thank you.
That said, if your two-digit cutoff year happens to match the cut of Oracle RR, you might get away with just changing the file format of your control mask
DATE_REC_ESTAB "to_date(:DATE_REC_ESTAB, 'RRMMDD')"On the other hand, if you wanted to, say, '401201' to be interpreted as 1940 rather 2040, you will probably need to implement your own numbers-biennial to four-digit conversion function.
Justin
-
Hello
(1) data exportable Essbase of LCM-Life cycle management directly?
(2) how to export data with Essbase calc scripts?
(3) what is the best method to export essbase data?
Thank you
XuesongHello
You cannot use LCM to migrate essbase data.
If you want to export the data, you can use Scripts to report, MDX, DATAEXPORT command (of version 9.3) or CDF custom such as JEXPORT.See you soon
John
http://John-Goodwin.blogspot.com/
Maybe you are looking for
-
I recently had to "Refresh" my computer and redownload firefox. I couldn't remember my password firefox sync, so I reset it. Then, once he said that it is synchronized, nothing happened. I checked the forums and apparently there is a danger of inform
-
Problem loading my att home page.
When I open FF 18.0.1 att my homepage will not start. Instead, a generic page att begins. I have to click on "sign in", and then my home page appears. Note: all I have to do is click on identify you, I have not get data from the keyboard. Seems that
-
MISSING NETWORK, OH DRIVERS HP COMPAQ PAGE CQ58-D53SO
Hello, I had a computer compaq laptop cq58-d53so and I installed windows7 64 bit, but I can't find the drivers work for the network card so I'm a little stuck. Below are the details of my laptop: Ethernet controller: PCI\VEN_10EC & DEV_8136 & SUBSYS_
-
Satellite L300 warms up very quickly
HelloMy Toshiba satellite L300 warms very quickly, I've had this laptop for about 2 years (2008-05-26). Recently, it's warmer and off, which happened twice.I was wondering if it is a danger or anything I should look out for.Thanks :)
-
After the upgrade to el capitan, cannot print Canon mp970
Upgrade to El capitan in snow leopard, and now I can't print from my Canon mp970. I went to the site Web of Canon for a printer driver is compatible with the new operating system - found nothing. Found some threads on Apple support community and foun