Interpolation of XY graph
Hi all
I'm new to Labview. Probably, it is a simple question, but I'm really stuck on this issue. I have a XY Chart (resistance vs. temp thermistor; the curve looks like fucntion of disintegration), for each unit degree he is correspondent of resistance, but I want to get resistace corresponding to some temp decimal (like C 10.5 or 18.1) using some kind of interpolation. Any help here. Thanks in advance.
Try this. (assuming you want linear interpolation).
Tags: NI Software
Similar Questions
-
Change the Type of Interpolation of waveform graphic part
Hello dear colleagues,
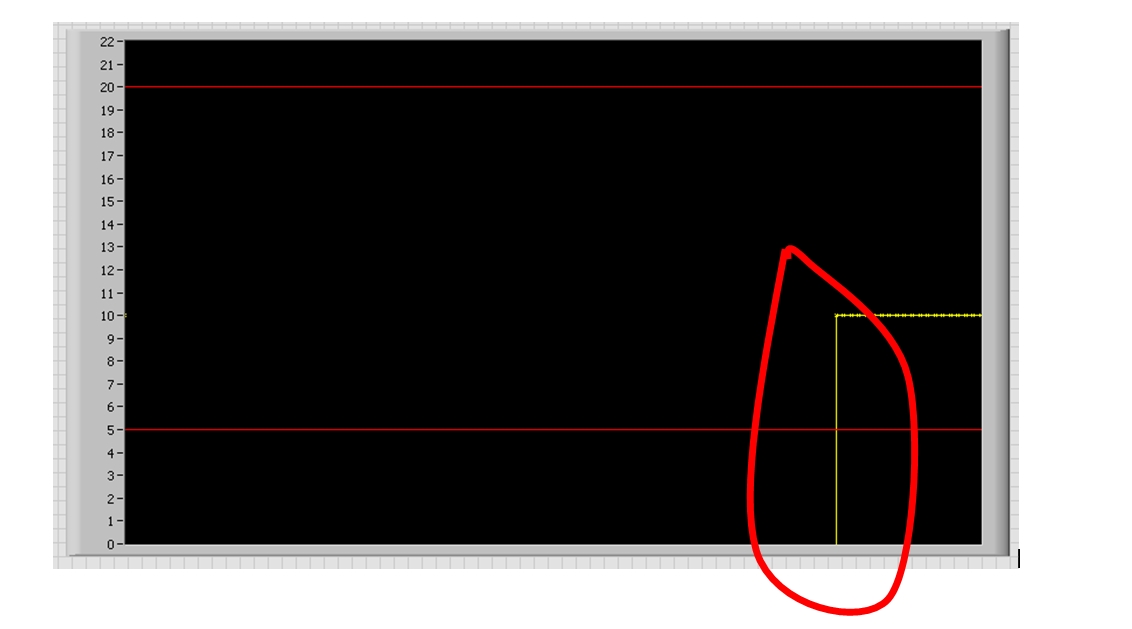
How can I change the type of interpolation to a graph of waveform in part? Check the attached photo.
I don't want yellow interpolation to the beginning of the measure.
I know that the interpolation can be modified with the property node, but this has an influence on all points.
Any idea?
Thank you very much.
Hi maximint,
-NaN values used to hide unwanted in the plot points
-use separate plots when you do not want the "edges" in land line
-
Point of intersection between the line interpolated in Grapher
How to find the point of intersection between interpolated lines using points offered as input to a file in grapher comps?
What version of Mac OS X?
-
Interpolation - more than one point
Hello
I'm trying to find the position that a graph crosses the x-axis zero. The problem is that this happens several times in my chart (this is a graph of the reactance of a parcel of impedance). I use 1 d interpolation and it returns only one point of intersection instead of 2-3 that occur. Is it possible to get all three?
Any help would be greatly appreciated,
Bill
Typically when you need to detect multiple instances of a condition in a data table, you will find the first and then look for the part of the table after the first to the second. You probably won't find a built-in function that will do this for you. The process I described in my previous post will be repeated.
Lynn
-
Generate an equation from a graph XY
Hello
Does anyone know how to generate an equation from a graph XY. I had a set of data, generated a parcel interpolated the data set, and my model/curve is logarithmic. Although I would like to get the equation of the curve, the news, I'm really after are the slope and bias from the equation. This is the format I think that equation would be: y = (Slope) * ln (x) + Bias. Any help is greatly appreciated. Thanks in advance.
You try to run a journal able to Y = ln (x) m + c is no different to running an adjustment linear y = m x' + c, where x' = ln (x).
Yet, you can do it two ways:
Logarithm correspond to a sequence of X and will return amplitude and scale.
Consider a Y ln (bx). We know by simple logarithms ln (bx) can turn in ln (b) + ln (x)
If Y = a (ln (b) + ln (x))
Reorganization, ln (x) Y = a + a (b) ln (equivalent to your expression of the slope and bias)
where a is equal to "amplitude" and b is equal to "scale".
Linear adjustment of a sequence of X = ln (x) returns the slope and intersection.
Consider Y = m ln (x) + c = m X + c
The output of slope m, the point of intersection c.
-
Hello
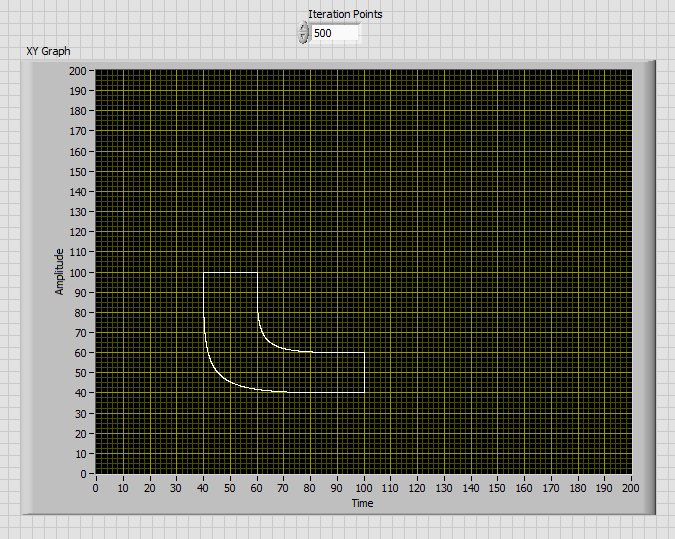
I did a vi where I can get with the sliders on an XY graph to make a path through time. Now I want to export the data plotted in a table of samples with a sampling frequency of lets say 1000 Hz, is there a standard way to do this? I've already quantified (that's the right word, I mean rounded) data at the point of 50ms.
In the attachment is a XY chart filled with sample data, but it must be converted in addition to samples... (1000 Hz)
Best regards
Thijs Boeree
1D.vi interpolation has an entry for it, "X is monotonous. Create a constant false to her son.
Who has solved?
-
Creating a graph of intensity from the discrete values
I have 4 discrete results. I want to display this information in a graph of intensity. I want each of these discrete values to have a specific color on the intensity. If possible the value 4: a = 1, b = 2, c = 3, d = 4. If I spend 2 x 2 table 1,2,3,4 in the graph of the intensity, I want a red, b blue, c green, d be and yellow. How can I specify that on the chart? Is there a good example?
Thank you!
In this thread, I give an example where you set Z scale by using a property node. In your case switch off interpolation of Z scale as well.
http://forums.NI.com/NI/board/message?board.ID=170&message.ID=437481#M437481
-
Hello
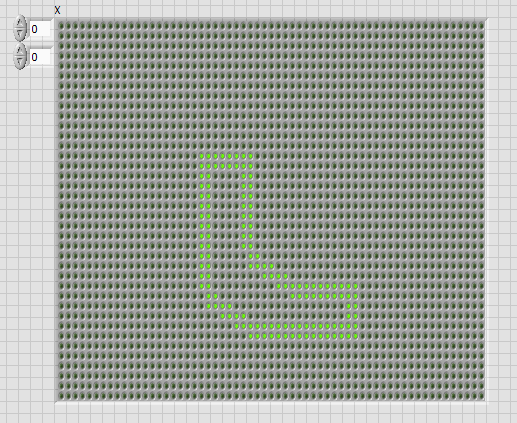
IAM facing a little problem here... what iam trying to do is basically convert a xy chart in a table of Boolean (no matter if it is in a table or graph)
I did a sketch in photoshop is easier to understand.
xy graph: boolean array:
any idea on how to do this?
Kind regards
Oli
Initializ a Boolean array of the desired size and put it in a registry to offset. iterate over the xy pair, map coordinates on the array indices and use replaces the subset of the array to light the LED at this level. Repeat for all points.
(If the points are relatively remote and you need create lines of interpolation, you would add a little more code)
-
Method of interpolation in 3-d charts
Hello
Please, what is the interpolation method used in 3-d for the generation of smooth surface charts?
Thank you
Hi Arthur, the interpolation is linear. You will provide points of surface (x, y and z) and the graph connects each point with a straight line. If you need further information, feel free to ask. Best regards
-
Problems with graph XY 'forget' field properties
I have problems with a graphic XT in my loop.
The graph has 10 locations which at any time can have anything from 0 to ~ 1000 points, often a few plots will have much less ploints than others. There is an option to select the user to view all items or just the most recent game.
My problem is I want the chart to reflect the data input and a single point during an update, so I have a string of points rather than a line.
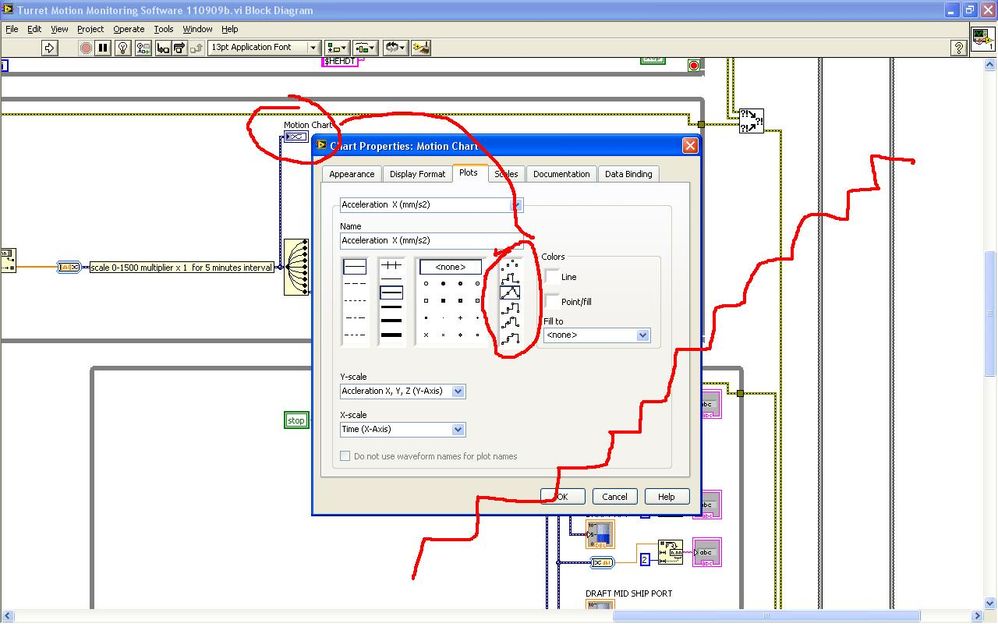
When I click with the right button on the chart and go to properties, I change the style of point of full circle and turn off the interpolation of the line. I then click on save these default values and save the vi.
However, once I run the vi, the graph keeps parcels 1 through 9 (not ground 0, this remains as I want) to have no displayed point and the line of interpolation on.
Anyone had this problem before? Ho solve you this problem?
I know it can be fixed, because I had this problem a few months ago on a similar vi and after weeks of struggle, I solved it, but I just do not remember how I did it.
Thanks for any help, at the moment I can't post any code. Note that the chart data show is all perfectly fine, just the properties of the plot are forgotten.
HI DarraghCorrigan,
With regard to the problem expressed in your initial post:
"once I run the vi, the graph keeps parcels 1 through 9 (not ground 0, this remains as I want) have no displayed point and the line of interpolation on."
This is due to a bug in the software LabVIEW by which all changes that are made to the parcel properties (for example to change the color of a conspiracy) will not be retained, except in field 0 that is not affected. Our R & D department are currently studying this problem so that it can be fixed in future version of the software. The solution recommended for this problem is to pragmatically set parameters of track at the beginning of the code using nodes of property.
As I understand it, is not the main issue you are experiencing. If you are setting the properties for a field (using a few nodes property described (e) which are then deleted or rewritten on a XY Chart, I understand, is that there is no way that LabVIEW can remember and preserve these properties.
As you rightly suggested, a way to easily overcome this problem would be to define default chart properties, so that when you remove/rewrite a piece and then add it again, it is always by default these properties. Unfortunately, it is not currently possible to do even if it was recommended as a suggestion of product is a feature that is to the study of implementation in future releases of LabVIEW.
I think that the question you need to address is the fact that you're at some point reset the graph by sending an empty array to him such that the set of your property are lost. If you can find and remove this section in your code, you should be able to solve your problem.
I hope this helps.
Best regards
Christian Hartshorne
NIUK
-
Hey everybody,
How can I make it more clearly the Nyquist diagram?
On my graphic program connects all points. I wish I had a nice circle.
If anyone knew?
Marek
Hello
Click on this trace near the plot 0 on the top right of the graph and choose the Interpolation, then choose an option without interpolation.
You can also configure many other options of your track it.
Hope this helps,
Paulo
-
How to make the waveform table rows less laeti WITHOUT using a lot of mathematics of interpolation
So I use a graph shaped wave, the numbers of entries sequence like that, sensor 22,23,24,25... the graph seems laeti. (Fussy) client says hey I want a good graph, you have function spline or something?
So I was to research the properties of chart and saw the settings below that does not help much. I proposed to the customer (picky) that Hey maybe we can make the balance Y greater for the lines of the stairs will be not so obvious, the customer (picky) says no. So I was sweating on tedious mathematics required for interpolation in the hot oil and noisy, without internet, fortunately the dinner bell rang.

Now is there some function blocks which makes the table lines smooter, a function spline or something? Thank you.
-
parameter of temporal interpolation of "wedge".
I consult a tutorial on AE where he animates an object from A to B is a B for a while then moves to C, is located a C for a while, then switch to D, etc. He puts a keyframe when it arrives at B, and also when he leaves B and C go. Once again, to C, it puts a second series of keyframes. Thus, the sequence of keyframes is at positions A, B, B, C, C, D, D, E, E,...
So far... I get it. But then he goes back and on the keyframe where it happens to B, he adds 'Hold' - changes affecting temporal interpolation of 'hold. ' I sorta understand why, but what is strange for me, if I look at the graph Editor's position between two keyframes 'B' in the same position is already absolutely flat. If the "hold", in this case, does not make difference.
I played everywhere to try and get the interpolation between two keyframes in the same position to not be flat and so far, I have not been able to. This tutorial is perhaps not a good example to use 'Hold '?
I understand that if you want the object to go from A to B, then you would use 'Hold '.
Use 'Hold' in the situation described above, that perhaps a jet to older versions of AF and AF now automatically knows to keep the line between the two keyframes to the same flat value?
Or is it perhaps the case that under strange circumstances, the value is not always a constant and therefore adding the shim is more a habit of type 'just in case '?
This tutorial is perhaps not a good example to use 'Hold '?
It would help if we could see the tutorial, but what you describe seems that Hold'em is not necessary.
Or is it perhaps the case that under strange circumstances, the value is not always a constant and therefore adding the shim is more a habit of type 'just in case '?
you use hold if you want no interpolation between the 2 keyframes. If they are the same already, this means that there is no interpolation then it is not necessary.
I understand that if you want the object to go from A to B, then you would use 'Hold '.
Yes, the hold is to make the layer jump between keyframes
Use 'Hold' in the situation described above, that perhaps a jet to older versions of AF and AF now automatically knows to keep the line between the two keyframes to the same flat value?
N ° it's always this way in Ae.
-
Odd spike in the graph of the position when using facilitated easier?
Hello all-
I encounter this problem recently and can't seem to find a solution (TBH don't know exactly how you get it either).
Creating two keyframes for position of a layer, even when the thing is moving in a straight line with no other keyframes, I get this weird effect where the layer of sort of "wanders" out of the way before arriving at its final destination. When I open the graph editor for post curve looks like this:

I want a smooth curve between the two keyframes, or a straight line, but rather boost MI get which is odd. This continues to has and I can not find a coherent reason and its driving me crazy
Thank you very much for your help!
The default spatial interpretation gives the energy of movement. Sometimes when you set or move there is a small delay and you get a little pingpong or unexpected because of the energy in the movement movement when the position is changed by a keyframe. If you zoom in and look in the path, you can see which overlap the Bezier handles on the path. This problem is extremely difficult to fix in the graphics editor by dragging the autour values. When you set the default linear spatial interpretation this energy with all its vectors is removed, so you get straight lines between points. This can work very well for your entertainment, but most of the things I design works best with energy and curves.
If you have a problem like this example and you need to maintain a curve and want to smooth movement, it is generally easier to start in the Composition Panel by examining the path and use the tool (g) feather and modifier keys Alt/Op; ion and Cmnd/Ctrl to set the curve. Take this example:

Correct with the pen tool gives me this:

The other option is to adjust the speed Keyframe or keyframes Interpolation to smooth out the path and movement.

In most cases, if you want a smooth path, then it is better to start with the pen tool in the Composition Panel and then work on schedule. Then you can refine things with the tools of the keyframe. If you need to do a few poles using the graph Editor, it is usually a good idea to have the reference chart (speed in this example) visible and choose Edit Position to the position and the speed of change at the moment.

Because of the energy put into movement along a curved path editing speed or graphics of values can get really confusing. That's why I usually start in the Comp panel.
-
Auto Flash generates graphical interpolation
I noticed this thing that Flash graphic symbols auto generated and names it Tween1, Tween2, etc..
I don't know why this is happening. It often happens when I have something and then this graphic symbol support appears in the tween library.
Do I really need them, it's a mulfunction flash and I can safely remove?
No idea why they produce, am I doing any wrong steps with interpolation and so they appear?
From my experience, these graphs generated by Flash usually come to be as a result of evil create interpolations of scenario... they basically fill in some other missing links. To correctly create a timeline Tween (classic), you need to have the same exact symbol at the two ends of the interpolation. The only difference being a few changes in the properties of the object between the two images, such as position, rotation, color, etc.
I can't remember / pinpoint exactly what scenario triggers in order to be able to demonstrate the good compared to the offending method of their creation.
Chances are, if you remove them you lose something of the interpolation... but I recommend trying it just so that you could learn from the experience.


Maybe you are looking for
-
Bluetooth not working not not after upgrade to El Capitan Yosemite
Simple really. I upgraded to El Capitan Yosemite yesterday. Before the upgrade all the bluetooth was working fine. Now, it is not the case. No devices appear in the devices window. Thanks for any help Robert "it works"? MBP15 mid 2012
-
HP Compaq Mini 110: How can I get rid of the password of the BIOS?
Hello! My pc wants a bios password. "Enter the current password" But I did not. Can you please help me with this? Thank you.
-
Adobe Bridge CS6 does not start.
Adobe Bridge CS6 does not start. I installed it in Photoshop CS6, but Bridge does not start in my profile of 'owner '. (Photoshop works very well). However, when the reinstalled via a new profile of the administrator, bridge works. Any ideas why it w
-
BlackBerry Smartphones how OS?
I am with T-Mobile UK and I was wondering if OS6 upgrade is available. When I connect to my pc and check upgrades en it is said that my phone is updated with the latest system of th V5. Any ideas?
-
Uninstall notification to reinstall winmaximizer
WinMaximizer deleted of the programs through uninstall, reinstall again on pc.told notification must manually remove winmaximizer notification, HOW!