LabVIEW XY Graph - Y multiples
I'll use the XY-graph to display an X and 3 value Axes. Like this: http://www.eng.auburn.edu/~niuguof/2210labdev/html/_images/bjt-iv.png
How can I do?
I tried the waveform graph, but to have an X axis.
And I have a loop where I generate data.
Can I draw the data while the because the loop is running?
If I use the XY graph I have to wait until the loop is completed and then the data is plotted.
Tags: NI Software
Similar Questions
-
Beginner LabVIEW - XY graph and audio files
Hello
I am very new to LabVIEW. I'm doing a program as follows:
- The LabVIEW VI to simulate two temperatures of entry.
- You can simulate each of them through a random number generator (be sure to keep the numbers in a temperature range of imaginary), or if you want to, by reading the values of a file.
- The Panel should, at a minimum, instantly showing each temperature (e.g., using a digital display), a graph drawing each temperature with time and an indicator (for example an LED or the counter number) to show that the temperature has exceeded its threshold.
Now I have the generator of random numbers and Boolean lights according to work properly. However, I recently added sound if the temperature drops too low (i.e. when the blue led shows) or too high (when the red lights). It works well, however, for some values sound custom ring, for others it will be. For example, three values in a line could show who are all under 16 years - the lower limit, the blue goes light on however the noise could only ring - its my default windows sound. Can anyone see anything wrong with it or offer me a solution?
Then, the XY graph. I feel that I don't get the right settings in there. I want the number of seconds on axis through the temperature values on the x - y axis. The temperature values initially came out huge by default, I have not changed the name of the axis but theres no graphics if I resized the axis myself? In my view, that I've not connected properly maybe? Also I really think I have somewhere went wrong with my reading of axis x, maybe I have the wrong time function in the control panel? I amn't familiar with boolean or or how to define true/false?
If I wanted to use 1 LED that could change in three different colours (red for high green, temperature temperature normal and blue for low temperatures), how can I do this?
Finally, someone has suggestions for the user interface, to make it look a little more sophisticated?
Thank you in advance, attached file.
First of all, you want to work on both your temperature at the same time and display them in separate indicators. Secondly, I am sure that your beeper goes with each temperature taken. You want to put the tone within a business structure to make it sound when you have any out-of-range condition.
So in the end, I'm sure you want a Setup like this. I'll leave some work for you to do. You are not nearly enough to pay me to do your work for you.

- The LabVIEW VI to simulate two temperatures of entry.
-
XY graph, initialize multiple groups of data and update a single set of data
Hello
I have developed a VI to control the coordinates XY of a platform using two engines. A version a little kwicks xy plotter.
The detail that I could use help in is the following:
1. I have 469 (or 400 ~ ish, there are two modes) of the discrete points to be initialized/connected to a XY graph such that a cursor on the XY graph can break discrete points. It's well done.
2. I have to keep track of the current position of XY. It's also well done
3. I have to keep track of the former x - y positions, where I was able to extract the data correctly. This is done by a switch.
4. almost all VI has an a giant loop, although sequenced by 0 of the past a structure of case to another until you reach the final "global dummy.
Now, signals which are processed to the engine through a USB digital signal generator, I think not that the specifications are necessary. Essentially I needed bitmask each individual movement, so the 'engine of movement' part is embedded in the giant of while loop. This means that whenever I have add a new feature to my VI, engine movements slow down, each time that the operating system on the computer decides to run an automatic update, drivers slow down. I do not have the luxury of multi-threading or a microcontroller immediately.
At this point, my engines are terribly slowly, and I'll try to find a way to make them run faster. I am sure that the bottleneck is actually treatment for my data XY graph.
My XY graph manages 3 sets of data,
a. 469 discrete points (table 2 x 469) or 400 ~ ish discrete points (2 x 400 ~ table)
position current c. (x, y)
d. "rescued/captured" (2xincreasing up to table 469) positions
everything has, b, c are inside the while loop. A switch determines the 'a' is used.
the berries are grouped and then sent in the graph xy inside the while loop. I need the graph to be interactive to the cursor and data.
Now, is that I wish to run things.
1. selection from either a or b is responsible to the xy chart (by a switch).
2 c is updated constantly.
3 d is updated whenever the data was captured (by a switch).
Basically, I need a and or b to run only ONCE at initialization of the (and when I decide to swtich from one to the other) and remains constant. In the same way D updates only when a switch has been pressed.
I failed to find resources too tracing data to the xygraph, and drawing a live data on top selectively.
I have attached an outdated version of my front as reference. I would like suggestions. Thank you in advance.
-JLS
-
Style bug LabVIEW XY graph point
I have a XY Chart two signals or more
I have selected a circular point to the data of the first signal poins.
When I try and select you even point during the second second, it appears in the diamond with an open space in the middle.
Bug?
LV 2011
Your line in the two plots width is not the same. In the plot of 'R meas' you have a line width of 0. In the plot of "T meas" you have a line width of 2. If you change the width of the line of the "soul T" to match that of the 'SOUL R', you will see that the points will be the same.
-
tiara graph view multiple pages with a TDR
I'm working on an application to replace our current generation of report with Diadem program. Our test feature allows us to perform the same test with different boundary conditions. Each test receives its own section in the final report. Given that the test type is the same, the pages of the report are exactly the same model and layout and channel names. When I process the data incoming I appoint depending on the section of report groups and report page, they are applied to the (Section = year, Page = Y16, group name = YR_Y16). All sections have a list of pages that are created. When there are several tests, then the corresponding sections are named by adding a 1, 2, 3... at the end of the Section (YR1, YR2,...) resulting in group names like YR1_Y16, YR2_Y16, etc. etc. Channels for a specific page (Y16) carry the same names, and the name of the Group (YR_Y16, YR1_Y16, YR2_Y16), that's what makes them unique.
My question is about how to better use the TDR files to create report pages. I know I have to create a TDR separate for each type of page (Y15, Y16) because content and information varies from page, but for any page Y16 channel names are the same with the unique group name. Is there a way to put the call on TDR in a loop which changes the name of the group when it is called while I only type Y16 RDT to maintain the page. If possible, that she keeps the number of TDR is to maintian to 213. If it is not possible then I'll have to file TDR 1533 to maintain because we let to 9 of each type of test.
Attached is a file of TDR example report page (Y16), and a CT file that contains a set of data for the Y16 page in sections YR YR1 YR2, etc..
I know this can be confusing, so do not hesitate to ask questions. I use Diadem 11.0 SP1.
Thank you.
Wayne
Hi Wayne,
Yes, it is possible to reuse a set of TDRs by adding each and then programmatically reconfiguring to point to a specific group in the data portal. I enclose below the architecture that I always use to do this. In this case there is that one sheet by TDR, but you could add a loop in each of the leaves of the file last TDR added to generalize this approach to TDR multi-page files.
Brad Turpin
Tiara Product Support Engineer
National Instruments -
Hello to you all, useful forum fans! :-)
I implements an array of tape showing the values of several parameters in real time, using a waveform graph, but during the race he keeps resetting of the history of the card at irregular intervals. Unfortunately, because it is for my work, I can't post the code. I'll do my best to describe the problem and the installation program, however.
I have a data acquisition loop to read the values in real-time in a table of the floats and stores it in a global variable functional memory data buffer that contains a table 2D of floats, a 'page' of floats by time interval. This forum works at 50 Hz through the expectation of millisecond Schedule VI.
I then a chart update the loop running at 10 Hz via forward schedule VI. This loop reads the data of all samples buffer VI he has accumulated (usually 5, but sometimes 4 or 6) and converts it to an array of waveforms through the VI of waveform build by taking each column of data and by assigning to it, definition dt to 0.02 (50 Hz), and parameter t0 to time less dt current multiplied by the number of samples in the table. The terminal waveform graph is then set to this table of waveforms.
Most of the time that it works well, with the new values added the previous values to create a smooth graph of multiple plots with the correct values are displayed. However, sporadically the chart Flash empty and begin to fill again from scratch. I can tell is just jump in time (the axis of abscissa) because I can move the axis scroll bar and there is no other data to scroll.
I in addition to these two loop loops a GUI-structure of the event and a task of State machine loop. However, I have excluded these two loops ownership history of the graph through inspection and breakpoints. This is why I can only think that there are conditions or the type of data which, once introduced in terminal results of the graph by adding DO NOT present data as usual. Empty array is not the answer; I tested with a separate simple test VI, and therefore in the chart, keeping the currently displayed data but do not update new data.
I would appreciate any idea what any of you have as to the possible causes of this behavior. I apologize again for not being able to view the actual code, although I can work to establish a similar setup with the data buffer, etc. in a separate VI and after that. Also, I would like to know if you want me to describe the other logic, settings, or the circumstances for you.
Thank you very much for your help!
-Joe
Whenever I've seen this problem when you use a waveform he chart endded up being a problem with;
(1) the number of parcels has changed.
(2) the names of the plot has changed (WF attribute).
(3) time info Goffy where t0 and dt were inconsistent with what was already posted (new data point a t0 that is earlier than what is already plotted this plot)
It's a pain to figure out the first time.
Ben
-
Median filter isn't removing the spikes at the bottom
Hi all
I use a median filter to spikes of deletes for the acquisition of data in real time of thickness of an ultrasonic sensor. This filter works great to remove the upper tips, unfortunately the bottom spikes remains unchanged. I tried changing different grade in the median filter with no improvement.
Attached images are code LabView and graphs showing data before and after filtering. How can I remove these spikes at bottom also?
Thanks in advance
Apple
I think that your problem is your acquisition code, not the filter. The data set, you have posted has 969 items with values of 2.681 or 2.68. The other 54 elements have values as 2.6, 681, 1, 2, 8 and 68. An element has the value 5, and there the value 9.
What this suggests to me, it's that your VISA reading is not correctly synchronized with the data transmission device. Either you get partial messages or an occasional character that does not match your regular expression. Look at the default value stored in the reading string in your VI. Unplug the display of ' \' character mode. It contains '\D5U=\F32.681\r\n2.681\r\n2.681\r\n' it looks like there two characters special \D5 and \F3 and then three values separated by carriage return, line feed. With this kind of protocol you should probably use the jump as a default line end character. Then search for the string \D2...\F2 which can be a header or channel ID. The rest is digital data.
Check with the creator of the device that sends data to determine the complete communication protocol.
Lynn
-
Change by the Step.Datasource program
I create a LabVIEW tool to update multiple properties of the stage after that some necessary changes.
One of the changes has been a step type went a numerical limit to a Boolean success/failure test.
Because I couldn't have all sequences (several hundreds) customers loaded when I made the changes, I need the tool to change the Data Source for this type of stage of 'Step.Result.Numeric' to 'Step.Result.PassFail '. Problem is that I can't find the right combination of properties/methods to get there.
I don't see that a "Step.DataSource" property as it is for the "StatusExpression" and "precondition". I tried to take the "AsPropertyObject" of ref in step ref, then using the value 'Setp.DataSource' 'Step.Result.PassFail' 'SetValString' method, but it returns an error of-17306 which returns "access error to the point"Step.DataSource".»
Thank you
Ed
Ed,
Since you're already in a context of step at this point, with the "Step.AsPropertyObject ()" call, try to just 'DataSource' as string search, rather than Step.DataSource. According to me, who is accessing the correct property in the container of the step.
-
Why it takes so long to open a connection to a shared variable, the first time?
Hello
I have an application to large scale developed with LabVIEW DSC, which covers multiple computers on a LAN. In one of the VI I open variable connection shared by using the "open Datasocket' VI. I notice that after restarting my computer and execution of this VI into the source code (I have not tried with an executable file yet) it takes about 20 seconds to get a successful connection to a variable share located on another computer. The later 'Datasocket Open' claims the same computer to the same shared variable takes much less time, about 100 ms. I reproduce this with 3 different computer, so the behavior seems to be reproducible, but it's not to do it every time but very often. This scenario may occur also when I did not open a connection to another computer for awhile.
Anyone have this experience? Is there something I can do all this to avoid this 20 seconds delay problem? Anyone have an explanation?
All of my computers running Windows 8.1. I'm using LabVIEW 2012. All my firewalls are 'off '.
Thank you
Michel
Here is a picture of my open VI.
Recently, I did this for another client. You can emulate a timeout (and actually connect faster) by using the function "open in background" and then checking the variable.connected? property.
-
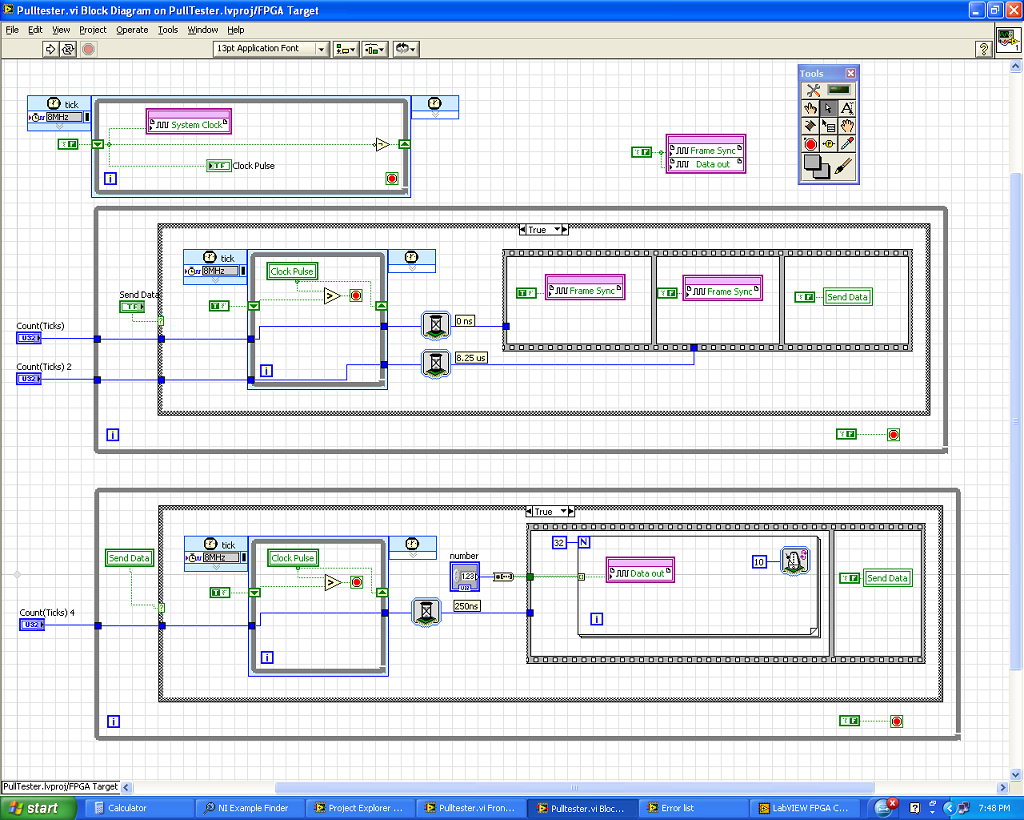
Synchronization of signals on my SBRIO problem
Hi all
I need some advice on how to complete my project.
I need to send a 32 bits of data to my unit test with the following parameters. CLK + FS + and +.
The clock runs at 4 MHZ. The FS + sends a bit length 33 of high for the treatment of the data signal, and in this context, I need to send my 32-bit data.
What I did is I created 3 loops as shown in my diagram.
1. the first loop is a loop timed to generate my clock pulses. I run at 8 MHZ with the low and high signals in loop rotation.
2. the second loop is for my frame sync signal using the rising edge of the clock over an external trigger (SEND DATA) to start the sequence. It has two red WAITING to the 0 graduation and 330 ticks (by tick is 25ns).
I have compiled up to this version of the code and run it with all the problems. I was able to generate the signal FS + 2ns after the clock rises and is to have cycles of clock exactly 33 in length.
3. the third loop which is I'll have trouble at this time is designed to loop data. I also used the pulse of the clock and the external data to start the sequence. I used one signal to WAITING to delay the start of the data by 1 clock cycle and use a loop for send data from 32-bit to 250ns (10 ticks) per line.
The problem is that I do not get the result I want. The departure of the bits is always erratic and not 1 clock cycle of delay that I hoped. Also the first bit is much too small for the 250ns.
Can someone tell me where I'm wrong? Is there another way to address the issue?
Your help will be greatly appreciated.
As a short response, I would recommend combining the three sets of loops in a single state machine. All three loops are intended to be based on the field of derivative 8 MHz clock.
As a longer answer and to explain the behavior you see... the time of the present code is assigned by the data through the areas of the clock. The details are in this help message LabVIEW FPGA: implementation of multiple clock domains with the overcoming of the areas of the clock (using a tunnel in the field to clock 8 MHz timed loop to the domain block diagram clock 40 MHz), LabVIEW is obliged to implement a hand shaking algorithm to maintain the integrity of the data. This shaky writing consumes FPGA (logic cells) tissue and takes 25ns several clock cycles to run, as well as creates unwanted delays. In addition, the third loop cannot guarantee that code data will trigger off the same synchronization signal as the second for loop because of the handshake that occurs for the data to pass through the loops of 8 MHz.
I would recommend that base you all of the communication out of a single loop timed in a configuration called a state machine. Essentially, timed with a looping structure business inside, where each picture of the structure of the case is a different State. Breast of a timed loop state machine, does not have the 'wait' function, so the delays must be implemented with a 'status quo' State which is repeated N number of times to match the time required. The following link leads to a state machine similar to the SPI communication that would be a good example for the implementation of this communication: Example of SPI LabVIEW FPGA.
The example above implemented the following communication scheme, which seems pretty close to what you implement:

This code is a little more complicated than what may be absolutely necessary to your application, but it is an excellent example of a scalable & flexible of the notion of core implementation (this code can easily be migrated to new hardware targets or add multiple replicated or modified communication to the same architecture protocols.)
See you soon,.
-
independent recording frequency of the frequency of sampling and other issues
Hello
I just got a new NI DAQ, compact and am currently trying to get LabVIEW to read from multiple channels on this subject.
In short, I have an input for thermocouple and a current input on my Board and I want to do is read from multiple channels on each module. However what I would like is for the display of the user to be updated in real time of these readings, then that I only want to open a session (or write to the file) all values at a rate of once per second.
at the moment I can do either both in 1 second (which makes the clunky and slow user interface) or I can do both very quick which makes the nice user interface, but the journal file massive.
Also I have questions about access to data acquisition channels and whether I need a producer consumer loop if I am only wanting to log every second.
First data acquisition:
To access my strings, I used the virtual channel NI DAQmx create VI and wired the necessary things. Now it works, but I wonder now, how can I change this option to apply some scales to each channel individually. I have 5 pressure sensors with slightly different min and max outputs (data calibration). I thought I could do this by specifying a project task, but it gives errors saying that I have duplicate layers or something. Essentially, each channel has its own custom scale.
Producer/consumer
Do I need to bother with a producer consumer? I thought it is a pretty nice way to ask things, especially with a queue, but really if I connect 1 times per second, the queue will never really have more than 1 thing in there. In addition, I find myself with an array of pressure measurements and an array of measure of temperature against time and queue wants a string input. So it don't work anyway.
Is it possible to put a slower loop inside a quick loop to check?
Thank you
Alex
-
Following this topic: http://forums.ni.com/t5/LabVIEW/show-graph-that-is-created-in-a-subvi/td-p/672249
I get an error when connecting my Ref server of vi to the Subvi. they are of different data types.
Then you can try to do otherwise.
moderator1983 wrote:
Otherwise, you can also try to create the reference (for the Subvi) on the graph of the main VI (time Signal) control:
1. first create graphic reference of the time Signal.
2. then right-click on the reference and create the control.
3. now use this command in the Subvi.
If it is not also help, share code (Main and Sub screws)...!
-
The Subvi display plot in the main VI while Subvi is inside another Subvi
Hi all
I followed the procedure described by mysticfree to display a Subvi plot in the main VI: http://forums.ni.com/t5/LabVIEW/show-graph-that-is-created-in-a-subvi/td-p/672249
I want to do nested way: main VI runs a Subvi called sub_A tracks sub_A. other sub - VI, called sub_B in it. sub_B generates a trace. I want to display this conspiracy in my main VI.
I tried to apply the same principle to this problem, but sub_A does not send trace information to mainVI until sub_B is finished.
I'd appreciate any suggestions to solve this problem.
I have attached the VI.
Thank you.
The solution to this problem is available in the following discussion:
http://forums.NI.com/T5/LabVIEW/show-graph-that-is-created-in-a-subvi/m-p/2390892#M741487
-
Views of repository for the performance table
Hi all
I found this page
[http://docs.oracle.com/cd/B19306_01/em.102/b16246/views.htm | http://docs.oracle.com/cd/B19306_01/em.102/b16246/views.htm]
on Oracle® Enterprise Manager extensibility
but I can't seem to find what I want.
Can someone tell me one I can find the information that powers the graphics on the performance tab? As "medium-sized active sessions?
I would like to create a graph of multiple target.
Thank you.
ARO
João Pinela.
Published by: Pinela on July 2, 2012 11:19I wasn't a link to monitoring views section. Specifically, you do not want to watch the following views:
MGMT$ METRIC_CURRENT
MGMT$ METRIC_HOURLY
MGMT$ METRIC_DAILY -
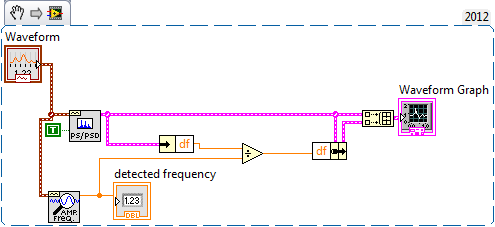
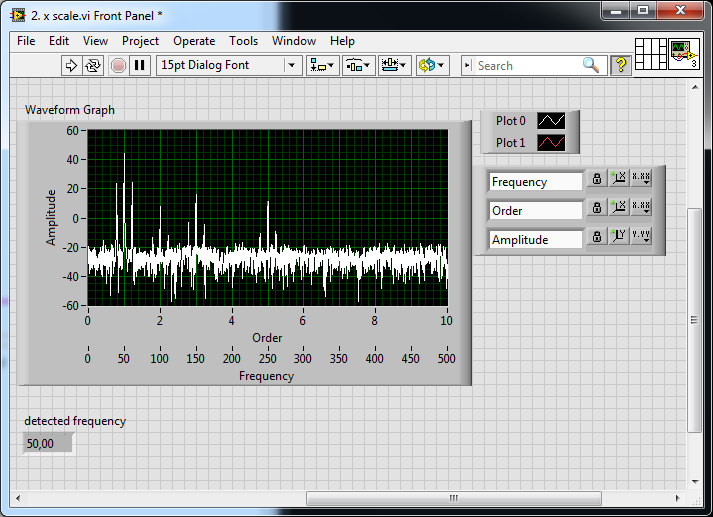
How to make a graph FFT show imaginary multiples of 1 x speed in LabView
I use LabView to analyze vibration of a turbocharger and display it on a FFT graph. I want the program to do is automatically draw lines on the x-axis of the graph and show possible 1 x, x 2, x 3... the vibration depending on the speed of the engine. For example, if the speed of the motor is 10 kRPM then 1 x is 166,6 Hz and 2 x will be 333,33 Hz and so on. It's like having the grid lines on the x - axis that will move with speed. Is this possible?
I am using LabView 2010.
Here go us
Maybe you are looking for
-
Something got to receive the error message Failed to load XPCOM When I try to start portable Firefox and Thunderbird on my XP based computer. I use these programs for the years on this subject. Research, it seems that I have to uninstall both and rei
-
Help! How to restore pictures to iCloud to my phone?
Hey there. So my phone randomly turned off and rebooted on me, and when I went to look at my photos I went more than 1000 to only 33. When I checked the icloud Web site, all my photos are still there. What gives? How can I get pictures on my phone? I
-
Hello My HP Omni is silent. Absolutely no noise. I've tried everything. I went to device update/uninstall Manager audio drivers without success. I tried a system restore and even tried to reinstall Windows 10. I guess my audio player is Intel ES
-
Satellite A100 and memory upgrade
Satellite A100-523. Why only increase my memory to 1536 MB and 2048MB not as shown in the analysis of the product?The laptop won't shoot upward on 2048MB.
-
Performance issue with 2.5 "HDD + NAND MQ01ABD100H
Hello everyone. I use this car for several days.The problem is that player has lower estimate in the Windows system assessment tool then my old drive (WD500BEVT). I run the benchmark in HDTune Pro and I get very bad result in n of the speed to the be