Measurement of respiratory signals by Pulse Oximeter
heHi, it comes to Madhusudhanan Natarajan Anjalai Ammal Manguin Engg College, Kovilvenni. I would like to ask a few questions related to the DAQ products. In fact, we will update the Oximeter research in sleep, surveillance system. To do this, they gave certain requirements. * To interface a Pulse Oximeter (sensor) to the above, said including hardware DAQ. * The Oximeter is used as a sensor and the analog signals respiratory entrants that must be converted into a form of (digital) analogous to the means of acquiring data. Further process will be using NI LabView. Is there any Interface of system Acquisition of specific data for the above? In addition, to monitor respiratory signals. How to display the above? (Normal and abnormal breathing) Please give me the above specifications.
Kind regards
Madhu.
Madhu,
What exact Oximeter do you use?
You can specify is your Pulse Oximeter output analog or digital signals. Some useful information are what frequencies it exports, what tension? What kind of resolutions did you?
Danny Funk
Application engineer
Tags: NI Software
Similar Questions
-
Measurement of time for various pulses end
Hello
I need help in the measurement of time.
Is attached to the question,
As a microcontroller, we can use of timer count between pulses of variable duration N. say N Pulse 1 pulse 10ms, 2 20 ms pulse and pulse 3 duration of 30ms.
Even as I will measure the time between two pulses as marked in the picture, please give me a solution, I tried to use the number of samples/sampling rates that it does not work.
Pulse I'm acquisition is of variable duration.
Concerning
Nitin
Hi Nitin,
What has changed since your other thread for you to believe that you must create a double post in a new thread?
-
Frequency of signal and pulse duration varying as to reduce the duty cycle
To sum up my problem, I am creating a period and the controlled voltage pulse sequence, but as I decrease my cyclical report, the distance between each pulse begins to become irregular. More precisely:
I want to have three pulses, each a positive amplitude specified, long, with 23 ms between each 80 microseconds. After these three impulses, I would have a negative pulse of 3 * than amplitude, followed again by Ms. 23 this cycle must be repeated 260 times.
I tried first of all to create the positive impulses to help simulate Signal VI, assigning a square wave with a frequency of 43.327556, an offset of 0.5 and the amplitude of 0.5. And the operating cycle as the default value of 50%, the signal seems to be normal (constant frequency and the duration of each pulse is equal;) "I'm in a position with an oscilloscope). However, when you set the duty cycle for. 3466%, the time between each pulse varies and some legumes are longer than others. I wrote the data able to file directly from fake Signal VI to ensure that he was not only a problem of scope, but it seemed that writing to a file of measure has not sample enough points for me to accurately measure. Even decrease the market barely 10% factor, I see the question arise already.
So my question is, I'm doing something wrong here? It is a kind offset of Labview to try to perform a duty cycle that small? And are there any alternatives to the way I have this set up? I thought I would try to use a train of pulses instead, but I'm not very familiar with this and I know, you can't control the amplitude of the pulses.
Any help is appreciated! Thank you very much.
My guess is that you are limited by the sample rate. If the difference between the two signals time is less than the sampling period (1 frequency / sampling), you will not be able to generate the signals you want.
Please tell us the sampling rate, you use and the settings that work and those that do not. If your data file is not too big, please post so that we can see some data. Post your VI can help too. Check the default settings before you save the VI.
Lynn
-
Measure the frequency of the pulses PXI-6624
Hello. I work with a PXI-6624 and am interested to make measurements of pulsed frequency for frequency and duty cycle on its inputs using DAQmx.
When I go to create the virtual channel, however, I have error-200431:
"Physical channel selected does not support the type of measure required by the virtual channel you create."
' Asked the value: pulse frequency.
«You can select: frequency, period, pulse width, period of Semi, separation of the two edges, Position:...» »
Is this card really not capable of doing these measures of pulse frequency?
Yes, the "Pulse" (not to be confused with "Pulse Width") measure was introduced with STC3 of OR including CompactDAQ and X series devices.
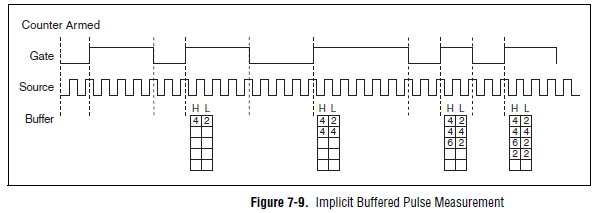
Measuring the pulse:
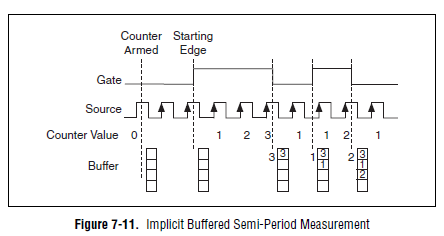
However, you should always be able to measure the frequency and the duty cycle on your card with a half measure:
The half measure:
The images are in the X Series user manual.
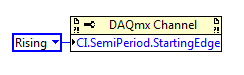
The difference between these two modes boils down to how the data is stored and implemented in buffer on the map - with the period semi method that the material does not distinguish between high and low samples and puts everything in a single buffer. However, if you start the meter on the song (see below the node property), then you would know the order of low and high samples in software, and are easy enough to calculate cycle frequency and the duty of this.
Best regards
-
Repeated values in the measure (FPGA, cRio) signals
Hello
I'm seeing repeated in my measurements values and trying to determine the cause
I read a single analog channel from a module NI 9201. In order to eliminate the noise, I averaged several samples by using the ms and RMS measures VI (shown in "FPGA Code.png")
An example of repeated values appear in the "comparison of Signals.png' for both the original signal and mean
The sampling frequency of the NI 9201 module for a single channel is 500 kech. / s, which I also checked by measuring the sampling frequency (the code for this is also reflected in "FPGA Code.png")
On the target of cRIO RT I record these values in a loop timed 500us using 1 MHz of the cRio clock
For the ms and RMS measures VI, I tried several options, for example:
-500 US measurement time, sample rate 500 kech. / s
-450 US measurement time, sample rate 450 kech. / s
-400 US measurement time, sample rate 400 kech. / s
-US 300 measurement time, sample rate 300 kech. / sEach of them give measurements with repeat values to varying degrees, for both original and average signals
Any suggestions?
-
measures 16 differential signals
Greetings from the Argentina!, I use an NI USB-6218 box for measure 16 analog floating aboutthose, in differential mode. I have a practical problem, to avoid erratic results, I have to use 2 resistors of polarization to THE GND for each signal, which means that I need 32 resistance!, we chose this ADQ unit because we need a system compact adq but use all this if resistances not practical at all. You have a more simple solution?, is there any accessory sources which includes resistors to GND?
Thank you and excuse my English...
a bit of these will keep it nice and tidy

-
How to measure differential analog signals
I read the hand signals and measure single-ended and differential, but I still don't know if a method is appropriate for my applications. Basically, I connect a BNC to one of the analog channels. The NLC has the real signal in a single thread (internal male) and land in the other thread (external shielding). I connect different components to different analog inputs so that they cannot share the same field (or the negative terminal). What is the best way to acquire this kind of data. It seems incremental settings on Panel (BNC-2090) different records between, say, ai1 and ai9. I don't want that because I want to record the difference between the two wires that are connected to the ai1.
Who said that a differential signal is connected to two different BNC? You need to look at the manual? The diagram in figure 2-2 is quite clear on the connections on the way in which the shield is connected in differential mode.
-
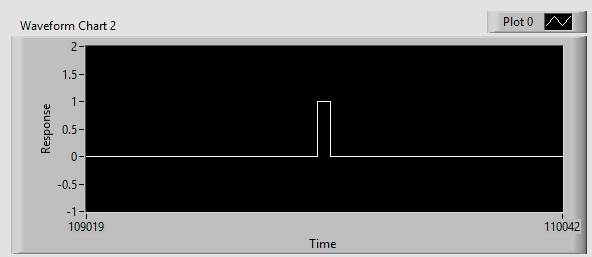
HOW TO MEASURE THE WIDTH/TIME GAP PULSE ANALOG OF A WAVE
HELLO EVERYONE, IM NEW TO LABVIEW. IM USING NOR USB-6008 ACCESS "ACCELEROMETER READINGS TAP" BUT I NEED TO KNOW THE AMOUNT OF TIME BETWEEN EACH PULSE OR WAVE. IM ATTACHING THE SCREENSHOT OF THIS WAVE. PLS ME GUIDE FOR MAKING of this PROGRAM, I NEED TO KNOW the TIME DIFFERENCE "Dt"...
Thanks for your reply Sir
 , I can get the table of amplitude... but I can't get the time table... could you help me please
 -
signal level for pulse width measurement
Hello
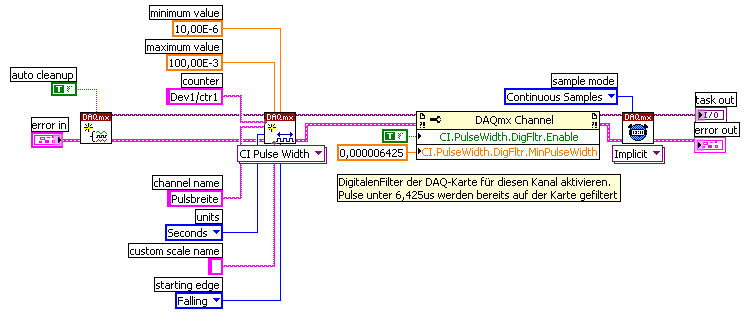
I am able the pulse width with the meter M6251 (CI pulse width)
I understand that the digital input works on the TTL levels (0, low 8V 2, 4V high).
Can you say exactly in which the level of signal pulse width is measured?
Thank you
Ralf
In fact, the transition from low to high (or vice versa) is located in between 0.8V and 2.2V. It is not specced exactly where it will be (although you'd be able to get a better idea, if you have an analog source, you can slowly increase until you see line status change).
This is why the fast rise time are important to accurately measure the digital signals.
Best regards
-
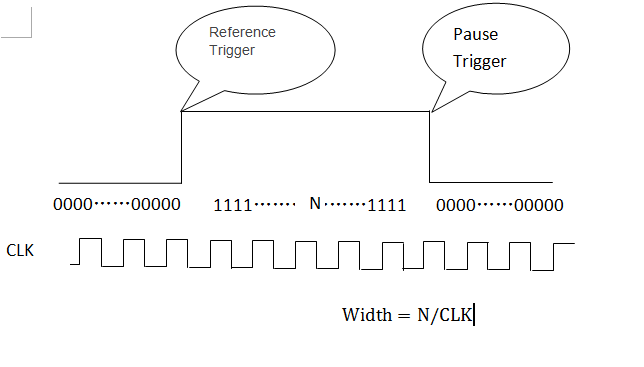
How to measure width of digital pulse using SMU-6548
Measure the digital signal of high level pulse width (a few seconds)
1US accuracy requirements
Thank you
Hello
You can configure the trigger of the reference and the break, and you will get a table as below. Calculate the number of 1,
The pulse width is N/clock. -
How to measure the width of pulse with MyRIO
Hello
Sorry in advance if this is not the most appropriate forum. I'm not entirely sure if it's a more general problem of 'software' or the MyRIO-specific. I have searched the forums and found a few related topics but could find no one who help me in this context.
I'm trying to measure the width of a sensor pulse ultrasonic ping. It emits a signal conditioning - the time that it is high directly corelates how far is the object. Being new to LabVIEW I am confused as to how do I calculate the time it remains high.
I read that LabVIEW should not need to 'variables' as in python or C, for what is the best way to measure time, the signal is high? Normally, I'd go (new_time - old_time), but obviously I can't store an old time in LabVIEW as I would in python or C.
Other notes:
I have the sensor correctly ping echoing and I can see the blips on a chart and see a perfectly square wave valid.
To answer your question on how you would in LabVIEW...
While LabVIEW has not stated/named variables that you have in a language based on text, the data is stored on the wires. You can use the nodes as node registers or shift of feedback to store values between iterations of a loop:
(this will keep subtracting y (starting with 0) and store the result for the next time it runs)
LabVIEW also has functions in the range of mathematics/signal processing to make the detection of pulse on a waveform.
-
Full range of pulse width measurement
Hello
I'm having a problem with the measurement of PW, I need to read an operating cycle within a range of 0% to 100%. The problem I have is the signal does not cross the Middle time enough baseline to measure or the histogram cannot be used because the amplitude is zero. Yes, this is obvious, because there is no pulse, that's basically all true or all false these two extremes, but the pulse measurement vi cannot handle this. Is there another way, I could measure the market factor, so that I can see if there is a hollow (0%) or high (100%) and everything in-between without errors? Even when I measure the PulseWidth in the method of the Ridge, rather than the histogram method, which gives me more time to remain at 0 or 100% before it gives an error, the measure see the signal as duty cycle 50% (still a times obvious because it is neither salvation nor low for any length). So if I could still read 0% or 100% error free, how would I be able to block the two extremes of the never read? My entry is the acquisition of data, so I can't just 'limit' my input to the source signal...
Any suggestions?
Thank you
-Corbin
Hey, Henrik, thanks for the reply,
I didn't really know how to integrage over a period of time in LabView, and I read a wave of digital squares (duty cycle). I found that I needed to omit extreme values such as 0% and 100%, so I couldn't find a way to do this with one under VI. What I found is my solution: I knew that + 12V has to be 100%, and 0 v is expected to be low, so I just used 'Amplitude and level measurements' sub VI read the RMS value, used a table that I recorded correspondence (via MatLab help), and I have more problems with errors due to levels of reference of histogram (do not use histogram now...). My application can read everything from 0% to 100% and he returned my correct data after handling. Success!
He could go about resolving the issue differently, but it works.
-Corbin
-
I use the driver for Tektronix TDS3000 Labview to configure an TDS3034B oscilloscope and I try to measure the gap between the falling edge of a pulse on channel 1 and the edge failling from an impulse on channel 2. It seems that the TDS3034 can measure this in in-house by the use of the measurement on the front panel key, but how do I retreave using your labview driver?
Hi Tori
I am now in place and running, I already had the TDS3034B to measure the delay between the pulse on channel 1 and the pulse on two channels, as well as the pulse width tuned to channel 2. This was done by saving the settings on the scope on a diskette and cutting and sticking them in a modified version of the TDS3000 auto setup vi. I created from a simple VI which allowed me to manually enter orders for tektronix and found that the command "measure: meas1: data? went around.
Thanks for all your support on this issue.
-
How can I measure the voltage of a signal?
Well!
I'm trying to read the voltage of a signal using acquisition data PCI-6229 card.i am giving the signal as an input to the DAQ card and try to read the voltage level. The range of my signal is 4.8 ~ 5.5 VDC but the results are not accurate, such as measured with DMM. My code is as follows:
1.i m using DAQmx create channel to create an analog input channel
2. then a sample clock with finite samples, sampels by channel and set the rate of iteratively
3. then I start the task
4. analog playback 1 DBL AK1 N sample d
Pressure readings I am differs widely that the actual.e.g a signal measured with DMM is 5v but when applied to the DAQ hardware and measured gives 6v.also I have to define minimum values and maximum in VI... If I put 4 to 5 maximum and minimum to measure a 5vDC signal it gives good result. , but if I change the maximum setting to 6v then it gives me results.also bad behavior is different for different signals for example when I measure a 6.5 VDC to signal that it shows me the voltage as 7.3V...
Photo of my code of VI is attached... Please answer... or give me another code that works fine at the voltage of a signal reading.
-
Align the two signals and measure the Phase Shift
Hello
I do an experiment in which I use the NI USB-6221 DAQ card. The jury is able to make 250 k samples/second. I want to measure two voltages in a circuit and find the phase shift between them at frequencies between 1 and 10000. First I ouputted a wave sinusoidal frequency variable through the Commission and applied to a test circuit. Then I used the Board to measure the two tensions consecutively (thus reducing the maximum sampling frequency at 125 k). I used the signals align VI and measured the two phases and then calculates the phase shift (VI attached in Phase 1). It worked well for the test circuit I built in which the phase shift went way logarithmique.20 degrees ~84.5 degrees and then stabilized. At frequencies above 5 000 Hz phase shift must have remained constant, but it varies more or less 1 degree. When the phase shift is 84.5 degrees, present a degree of variability is not particularly explicit. When I asked my program on the circuit that I really wanted to measure, the phase shift went from-. 5 degrees up to about 1.2 degrees. The change in the values of phase shift at high frequencies (> 3000) was environ.2 degrees. Given the small phase shift, this variation is unacceptable. Now I tried to use a sequence to each blood individually (increase the maximum sampling frequency to 250 k) and then align the two signals and measure the phase of each shift. When I use align it and re - sample Express VI to realign the two signals, I get the message "error 20333 analysis: cannot align two waveforms with dt even if their samples are not clocked in phase." Is it possible to align two signals I describe here? I enclose the new VI as Phase 2
Matthew,
I think I have an idea for at least part of the problem.
I took your program data and deleted stuff DAQ. I have converted the Signal on the chart control and looked then what was going on with the signal analysis.
The output of the Waveforms.vi line has two waveforms, like the entry. However, arrays of Y in the two waveforms are empty! It does not generate an error. After some head scratching, reading the help files and try things out, that's what I think is happening: the time t0 two input signals are 1,031 seconds apart. Since the wavefoms contains 1,000 seconds of data, there is no overlap and may not align them.
I changed the t0 on two waveforms are the same, and it lines up. The number of items in the tables is reduced by one. Then I increased the t0 of 0.1 seconds on the first element. The output had both greater than the entry by dt t0 t0 and the size of the arrays was 224998. Reversing the t0 two elements shifts the phase in the opposite direction.
What that tells me, is that you can not reliably align two waveforms which do not overlap.
I suggest that you go to 2-channel data acquisition and that it accept the reduced sample rate. You won't get the resolution you want, but you should be able to tell if something important happens.
You may be able to improve the equivalent resolution by taking multiple steps with a slight phase shift. This is similar to the way that old oscilloscopes of sampling (analog) worked. Take a series of measures with the signal you are currently using. The make enough average to minimize changes due to noise. Then pass the phase of the signal of excitement to an amount that is smaller than the resolution of phase of sampling rate and repeat the measurements. Recall that I calculated that for a 5 kHz signal sampled at 125kHz, you get a sample every 14.4 degrees. If shift you the phase of 1 degree (to the point/mathematical simulation), you get a different set of samples for excitement. They are always separated by 14.4 degrees. Take another series of measures. Transfer phase another degree and repeat. As long as your sampling clocks are stable enough so that frequency does not drift significantly (and it shouldn't with your equipment), you should be able to get near resolution of what you need. The trade-off is that you need to perform more measurements and may need to keep track of the phase shifts between the various measures.
Lynn
Maybe you are looking for
-
I opened my garageband, but I does not, because there was a question mark hollow garageband icon, then I restarted the computer, it normally restarted (whithout saying I restarted the computer because of a problem), and when it was made of built-in a
-
libraries with iTunes 12 issues
I've just updated iTunes to version 12.3.3.17 and now NONE of my (almost 3 TB) files are present. After changing the location of my library on my external drive (where I keep) everything now seems to not be available or recognized... only files that
-
Satellite L750-170 is not booting
Hello everyone Recently I fell asleep next to my laptop and I hit my knee it hit, and then he froze, rebooted and now it does not start at the top. When I turn the laptop on it comes up with loading as usual Toshiba screen, but there are two options
-
MFP M277DW: Size of the file too big for the scanned docs
Hello I have the MFP M277DW using the driver scanner CLJM277. The files I'm scanning (black and white) are too big! 3 pages for 3 MB. How can I reduce the size but not the resolution Thanks in advance
-
My intunes stop working, it won't connect to the store intunes or sync with ipod