Monitor the memory usage
We are testing EXSi 4 and p2v a virtual machine. Set us the vm to 2gig memory, but still seem to face the slowness and keyboard slows down etc. Have not been able to find a way monitor the memory because it shows the full 2gig, that I gave him. There is no balloning I see, so my question is how can you really know if you need to give it more memory or not, without going through certain types of plant monitoring?
Any help will be useful,
Thank you
Rebecca
I think we have some know how now.
Thank you so much for all help.
Killer
Run you P2V for Windows? Is that what you did clean the devices already anyone after P2V? Installed VMTools? Also look at this http://communities.vmware.com/docs/DOC-5430
StarWind Software R & D
http://www.starwindsoftware.com
Tags: VMware
Similar Questions
-
Monitoring the memory usage on iOS using the Stats class
I was check memory usage on an application I'm developing for iOS using Stats class https://github.com/mrdoob/Hi-ReS-Stats ( http://help.adobe.com/en_US/as3/mobile/WS4bebcd66a74275c3-315cd077124319488fd-7fff.html#WS 948100b6829bd5a61637f0a412623fd0543-8000).
I added the class Stats to my project and redeployed and, Ouch, reported in Stats memory usage ramp upward (quite slowly) even when there is nothing going on in the application (just displaying a loaded bitmap).
To try to find the question, I created a project with a test class that extends Sprite with just this single call in the constructor: -.
addChild (New Stats());
I have deployed to the device to check that he didn't swallow all of memory.
But I was surprised to observe the use of the memory to crawl upward and upward (to 5) before kicking in some garbage and takes memory down. I left it running and then he slipped once again more than 7.5 this time before being deported back down to just below 3.
So 2 questions that I would be grateful any feedback/comments/thoughts on related: -.
1 is this normal (i.e. memory creeping up when there is nothing else than to the Stats in the project)?
2 - What is the best way to monitor the memory usage in an application? Good enough stats - is Stats itself causing the memory usage?
All the best guys!
See also thread (http://forums.adobe.com/message/4280020#4280020)
My conclusions are:-
-If you run an application and let idle, use memory slips gradually upward (probably in memory is used to perform the Calc/refresh the display, etc.)
-Periodic garbage collection occurs and memory is brought back down
-This cycle could be more than 5 min.
Work with your real application and memory will increase and be published much more quickly/regularly.
-It's probably worth making an initial check running on your desktop computer to smooth out all the initial problems
-
withdraw the authorization allowing you to monitor the memory usage
I now often have either force quit, restart and started having panic 'of the core"since I agree allow Firefox CPU usage monitor. I'm still on OS X 10.6.8 on my Mac. I got no problem with anything since installing this OS X.
However, from time to time with the latest Firefox 7.0.1 installation I think the program or my computer 'blocks' and seems unresponsive. I left active Firefox and resident on my computer last night and once again, everything will be inadmissible. I opened the monitor activity and noticed that Firefox was consuming 283 MB of real memory (now 298,6 MB) and I have this one open another tab for the Seattle Times. I withdraw my permission to allow Firefox to watch my memory usage and need to know how to delete the cookie or what ever that governs)
Go to Firefox > Preferences > advanced > general tab and uncheck the box "send performance data" more information here.
-
ESXi 4.1 - Question about the memory usage
Hi all
I am currently in the process of migrating from ESX 3.5 and ESXi 4.1.0 everything by making the upgrade of my equipment (3 x HP DL380 G7, 24GO RAM, CPU Intel X 5660 2 each).
The boxes are installed with ESXi 4.1.0 Build 384481 and hpq - esxi4.1uX - bundle-1. 0a, hardware monitoring is done using HP SIM (V6, Windows).
What bothers me, however, is that the VSphere Client (4.1.0 Build 345043) reports steadlily increases the memory usage in the Summary tab. The increase varies according to the system, ranging from 98MB in 1848 MB in the last 3 days, continues to grow.
During this time the performance tab reports consumed memory exceeds granted memory.
Everyone saw this behavior, too? Is this normal or am I facing a memory leak here?
Thanks in advance.
Kind regards
SilentGuy
good no worries. Here's the jsutification who might come to our rescue.
the reason to ask to the image is to understand tips on different time and or prabably model.
officers of 3rd party as HP may be one of the reasons for these behaviours and this pumps memory when they perceive newspapers. I think it's side normal use would normally not go beyong 2000 MB for an esxi normal opertaing without no VM
I suggest you to watch more than two days and see if it grows even more...
hope this helps
-
How to check the memory usage of cash L2?
How can I check if my processor uses cash L2 memory?
How to activate it?
How to know how much it is?
My laptop is satellite MX30-113.Hello
Unfortunately I can't tell you much, but I found an interesting tool for editing memory. He called the Elcor V3.3. If you wish, you can see all the features of the tool. Maybe it will give you more information on the memory usage.
-
QNetworkAccessManager limiting the memory usage when no head
I have a long application works without head that downloads files from 6 MB upwards on a web server. Now using QNetworkAccessManager to view the file, I see the memory usage, pull up and soon to exceed the limit of 3 MB.
The QNetworkAccessManager then suffers bad allocations and crashes.
I was hoping would be sort of the QNetworkAccessManager chunk the data of the file on the disk and keep low memory footprint, but it seems he is trying to remove all of the file.
All means to limit or control the behavior of the QNetworkAccessManager?
See you soon
Paul.
Hello.
We started an internal investigation to verify the QNetworkAccessManager implementation. A suggestion to try next was to try using libcurl to perform the download of files.
-
I tried this code to display the memory usage. Running in the Simulator appears that zeros?
public class checkmemory implements Runnable
{
String ID = "checkmemory;
String ModDate = "20111103";
installation program. Setup _Setup.
int alloc;
free int;
int objects;
int objectsize;
public checkmemory()
{
}
public void run()
{
_Setup is new installation. Setup();
Memstat MemoryStats = new MemoryStats();
ID = memstat.getAllocated ();
free = memstat.getFree ();
objects = memstat.getObjectCount ();
objectsize = memstat.getObjectSize ();
HandleAlert (_Setup.Error, "alloc:" + Integer.toString (alloc) + "free:" + Integer.toString (free) + "object:" + Integer.toString (free) + "objectsize:" + Integer.toString (objectsize), "0");
}Solved. Code modified to:
ID = Memory.getRAMStats () .getAllocated ();
Free = Memory.getRAMStats () .getFree ();
objects is Memory.getRAMStats () .getObjectCount ();.
objectsize = Memory.getRAMStats () .getObjectSize (); -
Is it possible to monitor the % memory used - watch memory leaks
Is it possible to monitor the % memory used - look at leaks memory and want to warn % used is grewater to 90% on NON - enterprise Hyperic 3.2.1 as the CPU
is done. Why don't Hyperic monitoring the use of the memory as a percentage of the total?hypermike,
This will be in 4.0:
http://JIRA.Hyperic.com/browse/HHQ-2157?page=com.atlassian.JIRA.plugin.System.issuetabpanels:all - tabpanel-jeremy
-
What is the difference between the memory usage and bunch of EM?
Hi all
In OAS 10.1.3.3 Enterprise Manager, JVM Metrics, there are two columns on memory:
Use of memory (MB)
Use of memory segment (Mo)
(use of heap seems to be up and down, but the memory usage is never down)
What are the differences between the two?
Thank you very much
xtantoJin
Just check my answer on this URL.
What is the difference between the memory usage and bunch of EM?
Kind regards
Hamdy -
AVG warned me that the memory usage is very high and I have to restart.
Worms using Win XP. 3 and your suggestion, I've updated Firefox to worms. 7.0.1 and I still get this message that firefox uses too much memory, 300 MB or more.
Since I upgraded to 8.0, I started to receive the warning of the AVG. The matter of fact is that my FF has been the 7.0.1 high CPU consumption first, I was monitoring the use of memory and I don't see much of a difference in usage between my 7.0.1 and 8.0. That's why I ignore these warning because it is probably a new notification of AVG that was not available for FF 7.0.1. But each user is different and will have different results.
-
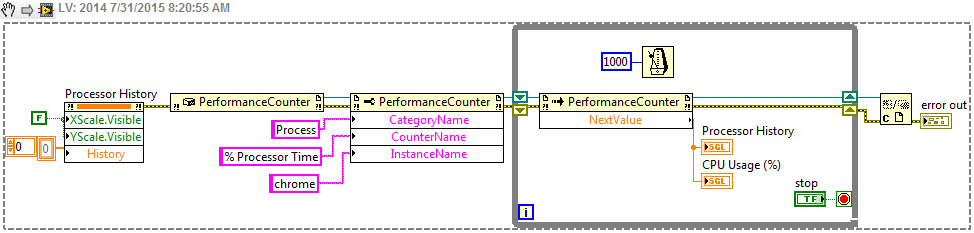
LabVIEW has the tools to write a small script just run in the background and look at some applications and process and report on their use of memory over time?
I have it! Use "Process" rather than "Processor", "% time processor" and "chrome". Should work fine.
The first example I linked to uses the processor category, which shows the use of the processor by the processor cores. The second example, I linked is great because it shows all the different categories/counters/instances in a simple user interface. Tinkering with that to get the desired exact instance names, etc.
For you and those who find this thread in the future, here is all the information in one post.
Monitor the total CPU usage or kernels.
User interface to be able to browse through all the categories, counters, and Instances.
Excerpt from the chrome CPU usage:
-
Best way to detect the memory usage etc. on a mobile device for debugging?
Hello
What is the best way, during development, to detect the use of memory and other while the application is running on the device?
So you can test it and see if something is the cause in the wild. I do an iOS/Android device so I want to try on fast and slow both phones and I have a script which ' add on ' memory usage as long as the user continues. I would like for this monitor (app, or the debugger) to see what is happening.
Any ideas?
Thank you
Hello!
My debugger favorite, by far, is "Debbuger Monster".
Easy to use and very powerful!
-
Message tells me that the memory usage has been 75%
Hello
I get (once a week) a message Bublé Tosh saying my memory usage average during the last 7 days was 75%.
Should I be worried?I have 1014 MB and I don't exactly tell me a power user!
Thanks for any help.
Nick
Don t think that there could be a problem is only a windows Vista notification message that informs you about the State of laptops OS.
-
Application download blackBerry Smartphones has failed - the memory usage decreased
Hello
I have a Verizon Storm 2. I tried twice to download Sea Storm Animated Themes. torwards the end, the download fails. buy my "memory usage" declines, even if the download has failed. How can I erase what is downloaded or what I need to do to regain my memory space?
Thank you
MM
Reboot: The BlackBerry device powered time, remove the battery for a few seconds and then reinsert the battery to restart.
-
Why the memory usage of my place of cRIO until the accident?
Olla and servus Hello,
I have another problem with my test setup!
A cRIO-9014 with 9118 chassis and modules.The problem manifests itself in a way the cRIO hangs after some time. During this time, I went up to now that it is the use of the memory of the controller! This is the beginning of the Proggramms RT to ~ 40% but continues to increase. Until there are about 98%, and the connection is lost to the target system.
Do you have any idea what may be the reason.
Thank you very much for your answers!
MaJahn
Maybe you are looking for
-
Firefox sync also often hangs on mobile
When you use the sync Firefox the browser will hang and finish the process and restart the application.
-
the new tab add + stopped appearing on my label
Can add is no longer just the tab from the TAB Add (sign +) no longer appears on the existing tab. He just disappeared this morning.
-
HP 7 3403ef hp slate tablet: Tablet hp slate hp 7 3403ef
3403ef FORUMS FOR hp slate hp Tablet 7
-
Place the dimension table of DLL handle size
Hello What is the correct way to handle the transition matrix dimensions, I found this document, outlining only the memory and situation examples that indicate the following two possibilities: typedef struct {} dimSizes [measures] ArrDatatype data [1
-
How to upgrade RAM on a laptop ES1-512
I read the upgrade of RAM is available for this laptop, even if it has no plate rear common access to may other portable. I guess the entire back must be removed. Anyone else done this and been able to point me in the right direction. Thank you Dave