Service-level summary report
Hi team
We try to run the iterator level summary report Service. We need to be run daily, but only the specific services we have created...
But this report runs by default for all services created.
is it possible to restrict the services for which I need this reprt to.
Please find attached the report view used and the definition of the view that is used...
Please help us get similar information for specific servers...
Additional accessories:

Sriram,
Your needs are feasible. I configured a solution to meet your needs.
I created the following:
A new request
A new view of iterated by copying existing services see iterates
Then after dragging the view of the report to a report, you use input can be set to set a list of FSMCategories
I'll send some screenshots
David Mendoza
Foglight Consultant
Tags: Dell Tech
Similar Questions
-
Service requests service level agreements
Hello
I was wondering if anyone had thoughts or experiences to share for the best way to manage the contracts of service level for Service requests. I was asked to provide a report showing that Service account (by area/topic) responded within the time con times.
For example, applications of new business cards are supposed to be resolved in 3 days and it took 4 days so mark this request as having not met arranged deadlines.
I don't know where is the best place to store the dayes of level of Service by region? Is this just in the logic of the report? Appreciate any ideas on that.
Thank youThe correct syntax for the IIf function is
IIf (testExpr, expr1, expr2)
If testExpr is TRUE, returns the value of expr1; Otherwise, returns the value of expr2.
Try withI
If ([] = "Allowances", "2", "0") -
Hi all
Just when I thought that I had worked on Service levels...
I tried the following two provisions separately within Service Builder:
Service Service [Global] [Global]
Service Cluster Cluster Service [Global] [Local]
node1a node1a
node1b node1b
host2 host2
host3 host3
The color coding is quite simply for the sake of description and show different levels of services.
- [Global] service is all 'container' for the hosts contained in the service and overall.
- host2 and host3 are hosts of autonomous - if two of them have a fatal alarm, which affects the service so the number of SLA fall of 100%.
- Cluster service is the 'container' for the two-node cluster and is at the same level as host2 and host3. I tried both a local and a global service for this service.
- node1a and node1b is a two-node cluster - if one of these nodes has a fatal alarm, this should not affect the number of ALS as the other node is still ongoing. I have created a registry setting in FSMServiceSLP_PercentageAvailableThreshold for Service Cluster [Global] against the value of 50, as well as Service of Cluster [Local] FSMService against FSMChildService of a value of 50, the logic being that 50% of guests at the service (i.e. a server) is always available, the availability of the service is not affected.
My understanding is that availability of service numbers are inherited "upwards". In other words, if I create a fatal alert on node1a, what should happen is that Cluster Service remains at 100% (there are still 50% of the available servers node1b still works, that's why the service is not affected) and Global Service remains at 100%.
However, what seems to happen in practice, it is that the Cluster Service remains at 100%, but the Global Service begins to drop his SLA figure, showing a loss of service. This is the case without worrying if the Cluster Service is defined as a local or a global service. This can be confirmed by visiting the dashboard of Service for the Cluster Service and Service levels although there is a fatal alarm for node1a.
Is it possible for the figure of service level should be given exactly? In other words, the Service should remain 100% unless that be host2 and host3 or (node1a and node1b) are not available?
It comes to vFoglight PRO 6.7.1 build 5.6.4.2. I built the services in the usual way, the option «Foglight can automatically add hosts...» "is not selected and the level is set to the default"let Foglight decide. "
Thank you
Brian
Well, we have this finally solved - Foglight does not calculate the availability of level of service properly, at least not in the way we have been lead to believe. To summarize...
If the function is defined as follows:
[Global] service
[Global] Cluster service
node1a
node1b
host2
host3
If node1a has a fatal alarm, Service [Global] Cluster is not affected (which is OK because it has a value of registry FSMServiceSLP_PercentageAvailableThreshold of 50), but [Global] Service starts to drop (which shouldn't happen). This is because the level of service availability calculation is also global alarms that would also alarms the child objects. To work around this, change the level of availability of underlying service code.
Go to Administration | Data | Manage the derived parameters and filter availability:

Select the metric range derived from FSMServiceLevelPolicy: sourceIds = $null by clicking on availability:

Select the calculations derived metric by clicking on FSMServiceLevelPolicy: sourceIds = $null:

Replace the existing code in the code Expression box in the attachment, and then click Save. This operation takes you to the screen change the derived metric. You need to click on save here too, otherwise your code will not change.
When you install your services, you can use global services to allow you to reuse the service in other parts of your service structure, however, when you set the percentages in the Variable of registry FSMServiceSLP_PercentageAvailableThreshold, these values are set against the topology of FSMServiceLevelPolicy Type:

Once all this is done, the availability of level of Service for the [Global] is displayed and calculated correctly.
My thanks to Philipp von dem Bussche-Hünnefeld from Dell to provide the code and help and especially for allowing me to share with the communities.
Brian
Warning: a full assessment has not been made to see if there is an impact on the other customer on the SLA management scenarios, so use this code at your own risk.
Additional accessories:
-
Is Hi possible to make a summary report Host which gives me a list of all hosts and their current state.
I know that I can run a detailed report, but it gives me pages and pages of information, and I can run a management report (number of hosts), which is great.
But... What I would like is a one page report that gives me the host name description and if them are active or not. Similar to the information appears on the screen of welcome/CSA system.
I'm under v6.0.1.106
Thank you very much
Ian Vickery
Ian,
Probably the best way to get a report with these 3 data fields would be to query the database directly. Otherwise, you could use the API and parse the output of these fields:
http://www.Cisco.com/en/us/docs/security/CSA/CSA601/user_guide/Scripting_Interface.html#wp965225
If you are looking for this report just find hosts who are not active the I advise to use the search for the host with your criteria.
Thank you
Josh
-
Level - Can Reporting someone please explain this attribute?
All - I am a newbie on Siebel on demand but creating reports with other tools for years. I recently came across some reports that I inherited that constantly give us bad. These are basic reports that look at the number of calls, meetings, etc. for a given user. What we see is that we used this statement attribute level to filter, but according to the Manager of logging level in it cause problems. Some people cannot see the data, and some receive a massive amount of duplicated data.
When all is said and done, we are looking for a simple list of Manager-rep of counts of these activities. After looking at the value of level reporitng it would look like an indicator of the relative position of the level lower in the reports - to the hierarchy. We will generally filter level = 0 (or maybe 1) reports more but what I want is a way to control based on the user. My requirement is to have the level they can see and retail at a level more low but I don't ' fully understand how that is created or how can I use system variables to determine the level of user control.
Anyone who has the news of background on this page or how I can order a basic report anaylytic in more manageable to show my stuff and subtotals to a level more down which would be greatly appreciated.Not sure if I can help with the specific report, but I'll try more of light level Reporting.
In a report which is flush with the dimension possessed by the user, you can find the Reporting level field. Each user belongs to a reporting hierarchy, derived from the "Reports To" value in their user profile.
The best way to see it is to create a simple report with the Email of the user level reports and email Manager. This will show you the Manager at each level. You can use this to expose and filter on the complete management hierarchy.
Level 0 = user. All users have a value of themselves as Manager at level 0.
Level 1 = reports to-which reports directly to the user.
Level 2 + = towards the top of the chain...You can take a look at some of the predefined reports to see how this can be used to create reports based team, as 'Team Pipeline Analysis', ' team sales analysis of efficiency "and"analysis of the Team activity. You can open all the pre-buiilt reports as well as the starting points.
-
Navigate from a (summary) report to other (detail)
Hello friends.
I am trying to build a summary report with two columns.
Column A column B
ABC PQR
ABC XYZ
DEF LMN
DEF RST
That is to say it is a unique value in column B.
Now, what I want to achieve is, if we click on any value in column B, a detailed report opens showing this value and some additional data.
Column A column B column C column D E
ABC PQR ... ... ....
ABC PQR ... ... ....
ABC PQR ... ... ....
Assuming you click PQR, synthesis report, detail report will look like above.
Basically the detailed report will be initially built for each value in column B of the report. When you click on PQR it filters the second report and display only the values for it.
The report must be run from the table edge and that the link from summary report that we will be provided.
Please guide me on how to do this. Any idea will be useful. Thank you...Hi Max,.
The best way to achieve this is through a navigation. Make two reports, one with the summary and the other with the details. Make sure that they both use the same domain that the filtering will be more difficult, and sometimes impossible. The target report (the wave with the details) to define a filter "is invited" on column B. In the synthesis report, define the interaction on the navigation (to the detail report) on column B.
It should work.
Best regards, Tim
-
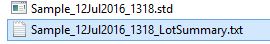
Hello
How to add an Id(which is inputted in the Configure Lot Setting) a lot in the naming of the batch summary and report STDF files generated by the Test Module of the semiconductor.
Currently the default name is shown in the excerpt below
Thank you
Rovi
Hi Rovi,
Have you tried the recall of ConfigureLotSettings or some of the steps listed in Cusomizing behavior for batch parametersof edition?
Kind regards
John Gentile
Engineering applications
National Instruments
-
How creat a summary report with txt.
Hi all
I want to create a summary of the report with .txt, and I disabled the feature of report generation in teststand.
I created a complex sequence, includes some sub-sequences, example: the UUT is tested on three different temperatures and four different voltages conditon. So I creat three subsequences (different temperatures) there are four steps (different voltages), then mainsequence invoke three subsequences to excute test.
I only want to get the fail-no summary, include: name of the step-fail, status
How do I? Thank you very much
You can use Parameters.Step.Name to get the name of the step failed. You can also use something like Parameters.Step.StepType.Name is 'NI_MultipleNumericLimitTest' to the different types of filter steps.
To the extent where the string any failure...
You can check RunState.CallStackDepth to see callers how you deep. Based on this information, you can use RunState.Caller.Caller. (in sequence but of many appellants deep, you are). RunState.Step.Name or. Sequence.Name
So if the CallStackDepth is 1, you can only use a caller. If it was 2, need to recursively would you use 1 caller and then 2 appellants and so on.
-
I kept getting annoying "authentication failure. Please check your user name and password of the account '... xyz. "" error every 30 seconds. "
I tried to restore my system and antivirus running - even to reinstall my anti-virus. I deleted the accounts in question and kept still getting the error message. Note, receive emails has never been a problem.
I finally disabled the element of the system of "Windows Error Reporting Service" MS configuration and now the error pop ups have disappeared. Is it correct to keep this function disabled?
Thank you.
To check the event logs, go to start / Control Panel / administrative tools / event handler.
To achieve the reliability and performance monitor, go to start / search and type in reliability, and then double-click the program icon that appears.
I hope this helps. You can always check these sites periodically and do not need WER to warn you of a problem (even if it is perhaps faster) - you can check manually. WER serves a purpose and he gives notification of a problem (which is good), but not in the circumstances that you knew. This is a "nice to have" feature - not absolutely necessary. We can try testing again to see if we can find the problem with WER if you're at it - or you can simply leave it off and make periodic checks of manual (decision is yours).
I hope this helps.
Good luck!
Lorien - MCSA/MCSE/network + / has + - if this post solves your problem, please click the 'Mark as answer' or 'Useful' button at the top of this message. Marking a post as answer, or relatively useful, you help others find the answer more quickly.
-
A summary report of comment with possibility to select script page ranges
Hi all
I use Adobe Acrobat X Pro on Windows 7.
I am a newbie to JavaScript, but were using the following script (in fact found this great forum!) to create a report of summary PDF comment.
It works fine, but I would like to be able to include a line of code to select only specific page ranges (1-40) as I work with a PDF file with 700 pages and you want to create a report summary of the specific chapters. I tried to insert a code for printing specific pages, but when I used Ctrl + Enter to run the script it would bring just to the top of the print window.
Any help would be appreciated.
Thank you!
this.syncAnnotScan ();
var a = this. getAnnots ({nSortBy:ANSB_Page});
If (a) {}
var = new Rep Report();
Rep.size = 1.8;
Rep.Color = color.blue;
rep.writeText ("summary of comments to" + this.documentFileName);
Rep.Color = color.black;
rep.writeText("");
Rep.size = 1.2;
rep.writeText ("Total of" + a.length + "comments in this file");
rep.writeText("");
rep.writeText("");
Rep.Indent (20);
var msg = '\200 page %s of %s of % s ';
for (var i = 0; i <.) Length; i ++) {}
rep.writeText("");
rep.indent (20);
rep.writeText (a [i] .silence);
Rep.Outdent (20);
}
var docReport = rep.open ("commentSummary.pdf");
docReport.info.Title = "summary of comments for" + this.documentFileName;
}
You will need to add more terms or to adjust this one, for example, to reach the beach you specified above (note the page numbers in the code are zero-based):
If (a [i] .page<80 ||="" a.page="">117) continue;
-
I have the creative cloud composition and went LIVE with 5 sites. Then we went to CC Team preparing to launch our project.
Cone find not what plan is to allow me to post my living sites, with single - domain names and more precisely at what level of services Biz Cat comes with it.
I need to put a blog in a BC/Muse site.
- Rather than Word Press, it seems that BC has built in the Blog which can be great.
- Anyway I need to implement a blog and am using MUSE.
- Any favorite ways to do?
Another way to ask the question is: can anyone recommend the 'best' way to put a blog in a site of muse?
- There are several paths: wordpress, tumblr, stand alone Articles. Help! Laughing out loud
- Several widgets on the site of Muse one for $34, which is autonomous.
Thank you for any suggestions or clarifications.
I wait until the weekend to tackle this project. Weekend have very limited support to respond to these requests for information I have does not have account in work.
See you soon!
A.L.
The best way by far is this solution:
It allows a system completely free blog hosted within the Muse, with all the features, you can imagine (display stylized text, images, movies, customizable comments system, multi user option and so forth).
You will find video tutorials for this blog system:
-
profile simultaneous access level option: report
I need to define the level of concurrent access profile: report... but it's not retreivable from profile-> system->... any idea?
KaiKai,
This profile option no longer exists in R12, use UMX RBAC.
Note: 563946.1 - how to see log and output files of requests by other users using RESP even Ran in R12
https://metalink2.Oracle.com/MetaLink/PLSQL/ml2_documents.showDocument?p_database_id=not&P_ID=563946.1 -
Summary report - percentage of successful tests
Hi all
I develop a sequence with many steps of pass/fail tests, and I would like to change/simplify the report so that the user could see the percentage
tests succeed on tests executed together, after the end of the sequence.
In addition, I would like the report to be displayed in the Excel file.
I don't have a lot of experience in TS and I don't know where to start.
Any ideas?
Thank you very much
Levi S
I enclose a simple sequence that displays pass fail statistics in the report.
I use additional results for report pass and fail. You can change as a result of performance if necessary.
Please note that the steps to calculate the col and not having results tombstone.
All results are loaded in the list of locals.result and analysis of the sequence of this variable to determine the pass-fail.
Some useful links for the customization of the report (excel)
I hope this helps.
-
Summary report for the disk error checking
I ran a hard drive error checking and he tells me to view the error report, but I don't know where to find the error report?
Hello
View log chkdsk - Control Panel - administration - Event Viewer - Application tools - in the Source column
Double-click on Winlogon. Or Start - type in the search-> Event Viewer box: control the top - Double-click on it.This tool makes it easier to check the event viewer.
MyEventViewer - free - a simple alternative in the standard Windows Event Viewer.
TIP - Options - Advanced filter allows you to see a period of time instead of the entire file.
http://www.NirSoft.NET/utils/my_event_viewer.htmlI hope this helps.
Rob - bicycle - Mark Twain said it is good. -
CSQ Call Distribution summary report customized with 5s and 20 s model for UCCX 10.6 required
Dear all,
We have UCCX with recently upgraded to 10.6 HA. After upgrade, we are not able to generate the CSQ Call Distribution report for every 5/20 sec.
We contacted TAC and found we need to have autonomous cuic but we donot have in our environment. There is demand for improvement already triggered with Cisco for this defect, Cisco still to develop fixed a bug for this version.
Ask you to provide me with this model of the said report to import into our UCCX of 10.6 to generate reports required by our care.
Had the same problem after upgrade of 8.5 to 10.5 UCCX. I was able to modify an existing report to get 5 seconds interval.
I exported the existing report. Imported in CUIC stand-alone server, query list value with interval of 5 seconds:
select 5 as ID,'5' as value from table(set {1})Also changed the column names in the report. With 5 seconds interval, we have 4 great call distribution intervals: 0-5 sec, 0 to 10 sec, 0-15, 0-20 sec. Unfortunately, when I downloaded my report to the initial report UCCX CUIC was broken (I think because of the internal report id duplication), but the new report works very well. Check out the screenshots and my below custom report template.
Maybe you are looking for
-
Satellite C660 - M21G SM bus controller and display driver installation problem
Hello I recently bought toshiba Satellite C660 laptop M21G with windows 7 32 bit installed (not not licensed) and I installed all the hardware drivers except the SM Bus controller and driver of Nvidia GeForce graphics card, this because it will not t
-
On my W260g clamshell phone, how to activate speaker?
-
My lenovo y580 boots of 50 seconds and above
I thought that it is equipped with quick start and a shield of startup. They said that the average is 24 seconds. I tried to change the beginning upward, but it still indicates a start 50 seconds
-
I'm running Windows 7 on a HP Pavilion model p6404y.
I bought a flash drive, but don't know how to save modules to it. If you are familiar with the HP Support Assistant may you've seen the tip about making this kind of "backup."
-
Focused on the development of Navigation does not work on the device
I used the code from official BlackBerry web site at the following address: https://bdsc.webapps.BlackBerry.com/HTML5/documentation/ww_developing/using_the_navigation_mode_1866... Color Input Type Test input type - text/password/email/search/tel/numb