Wavefrom time graph of .csv
Hello everyone
I use "read file spreadsheet" to read a two-column .csv file in a waveform graph.
Time is defined in the first column, and the data are defined in the second column.
The problem occurs in the x-axis of the graph (time axis). It does not correspond with the figures of the indicated such .csv in the picture below, but the axis has correct values.
The VI is uploadet
Works fine here, once I have set up to use a comma as the decimal separator (using the format =" %,;%.3f "on read the spreadsheet file).
You seem to use a foreign version, so it is not necessary, according to the language setting of your computer, but it seems to be the problem.
Initially, all of the 2D table should be displayed in a table indicator to make sure that your number didn't get truncated somehow. If they get truncated, dt is set as null and therefore ignored and taken as 1.

Tags: NI Software
Similar Questions
-
QUESTION: SE 2012 data display returns to the time graph each time
Hello
I have SigExp 2012.
If I try to add a data view and make a pledge of graphic style, thermometer, etc., as soon as I have the right up until it clicks, add my TC chain, the data view returns immediately to a graph time.
In addition, even if I use the graph of time, once I added the signal, it only let me see the string in a table, a chart of time or a waveform graph. Those are the only choices.
If I use a graph of time or a band of waveform graph, it does not read the signal correctly, but I can not configure the data view, the way I want it.
Is this a bug or I do something wrong?
Thank you!
This occurs when you try to change the display of a signal in its raw format "waveform".
You must convert your signals in scalar format. To do this simply add an amplitude and levels step (under: analysis > measures Time-Domain). Drag this DC signal newly converted to a new chart and right click on the graph to change the display.Honestly, I'm not sure why raw waveform signals are inherently limiting viewing functionality, but in such cases, it is.
You can also; According to the devices on which you use and the order in which you add to your DAQmx Acquire, some default signals step to scalar signals without having to convert.
See the attached screenshot and you'll see how the icons are different between the waveforms and scalar signals.
Hope that helps
-
Using the DAQ assistant voltage vs time graph
I'm relatively new to all Labview and terms and everything which affects programming. I've read tutorials and everything trying to understand things. One thing that I have a problem is the DAQ assistant. Now, if I wanted to place the DAQ assistant on the block diagram of labview and I have everything set up so that the voltage will travel in the DAQ hardware, how would I set up my block diagram so that I can get a graph of voltage vs time in which data begin recording until the voltage reaches a certain tension I was inputing and change such as 30 or 40 volts. The data will also stop recording when the voltage reaches the same number. I also want to be able to multiply the number of voltage coming out a number that I can change myself before it is graphed over time. Example, I mean the voltage to start recording when he reached 40 volts. Now when the voltage comes out of allows it to DAQ assistant say he is somewhere read 10 volts and the number I want to multiply by 5. So, I want to be able to multiply the voltage by 5 and then since it will be 50, it would begin graphing this number over time.
You would need to have a Boolean value which controls whether the (amplified) voltage is greater than N.
If so, he would send this value to a graph, if not, the tension would not get graphically.
Here is an example: (do not try to copy this code exactly, because it does not use a signal, but rather a whole number that is being created)

-
make a graph in real time of 1 DBL value at a time, using a loop for
I have a somewhat interesting programming task where I have the following situation: (I have attached a mac version of vi Labview 2013)
-Using a patented (pre-made and uneditable) sub - vi, who receives a value of 0 or 1 as input and reads off a single measure, whenever he receives 1 while a value of 0 is necessary to 'reset' of the vi to rehearse a new measure.
-I would like to run this sub - vi repeatedly in a loop For each value of "measure" are sent to a curve of waveform to give a direct value (real time) for the graphic to display.
-As it is, I have a vi file that simulates action in a loop but built in a 1 d array to get exuent values sent a waveform curve.
-I don't know how to make a real-time graph which receives 1 value double both.
-In addition, I want only every 2nd value sent to the loop for, but I already have several ideas on how to do it. First of all, I am concerned about the target in real time.
Kyle Shiel
A graphic, not a graphic, allows you to update a point at a time. It would be inside the loop for. update the chart or not, you can use a select statement or the structure of the case.
These are pretty basic functions in LabVIEW. Please see the free tutorials.
-
Why the execution time increases with a while loop, but not with "run continuously?
Hi all
I have a problem of severe weather that I don't know how to fix it because I don't know exactly where it comes from.
I order two RF switches via a data acquisition card (NI USB-6008). One job at the same time can be selected on each switch. Basically, the VI created for this feature (by a colleague) resets all the outputs of acquisition data and active then those desired. It has three entrances, two chain simp0le controls and a cluster table, that contains the list of all the outputs and some practical information to know what is connected (specific to my application).
I use this VI in a complex application, and I have some problems with the execution time, which increased whenever I said the VI, so I did a test VI (TimeTesting.vi) to determine where the problem came. In this special VI I record the execution time in a csv file to analyze then with excel.
After several tries, I found that if I run this criterion VI with the while loop, execution on every cycle time increases, but if I remove the while loop and use the funtionnality "Continuous run", the execution time remains the same. In my high level application, I have while loops and events, and so the runtime increases too.
I someone could explain to me why execution time increases and how can we avoid this? I have attached my VI test and the necessary subVIs, as well as an image of a graph that shows the execution time with a while loop and «run permanently»
Thanks a lot for your help!
Your SetReset_DO VI creates a channel whenever it is called. And that you never delete a task.
When running continuously, that it's as if it only runs once and LabVIEW has internal mechanisms to close references that will not be used again. When a VI is used as a Subvi, LV does not know if she will be called again, and lacks these things until the first level VI stops. You have a memory leak.
Just as you open and close your file outside the loop for, create your channel out of the loop.
Lynn
-
Wrong time file Express with NI9361 medium Freq dynamics of the signal
I have an interesting problem with recoding of the frequency to a file with SignalExpress measures and a NI9361. I was able to find a workaround, but here's the question:
As in the attached SignalExpress project, I'm analog acquisition of voltage using a NI9234. In this case, the module is in place only for the/cDAQsim/I/SampleClock channel exist for my next step to reference. I'm also acquisition of previous frequency with the NI9361 in dynamic mode with an average using the reference to external clock of the analog input stage. Then I have a backup at the ASCII stage where I want to write a file leave ASCII, comma with absolute time.
That's the problem. In this case, I cared only to save the frequency to the file. But, when I did the absolute time would count per second for 100 points, then loop back at once and County place again. (See attached Test01.csv.) This is the same behavior that if I tried to record data using just the NI9361 without an external sample clock.
If instead, the save operation I take FIRST entry then the frequency I will get a file with the correct absolute time as Test02.csv analog, attached. Even if I save the frequency as the first entry and then return to tension the problem at the time scale.
Anyone know why that would happen? Is there a simpler way for the frequency measures stamped recored with the NI9361 and SignalExpress without analog data recording? without using an analog input module at all?
Hello
This question looks better suited for the Signal Express community forum page. Please ask your question here.
Thank you
-
How can I throw 100 samples per second on a graph?
Hello
I take a CANBus 100 samples per second, and I would like to present these data in a real-time graph. I want to see all 100 samples and the graph refresh every 1 dry, I use a waveform table.
I would like to than my table updated with new data every one second (1 SEC 100 samples, 200 samples of 2 sec, etc.) and be able to see all 100 samples we take in real-time in the chart. My question is it possible? I think that some how I need to change the x in the graph scale? I did a little code in which I change the x of the chart scale and put in real time, but in the graph shows only a sample of 100 samples that I take every second, can you please suggest a solution for this?
-
How to broadcast a real-time graph of my laptop to another pc where labview is not installed via LAN cable but the internet connection is not available
Remote panels is no the code approach (but you need the runtime of lv on the client computer)
Try allowing the Web server by going to tools-> options web server and check the server to enable remote panel.
Then, you need a Web page outside your façade using web publishing tool in the Tools menu.
then on computer2, type in, ip address: computer1 8000\viname
You can also use a remote desktop like tightvnc program (it is an approach that does not need LabVIEW at all) tightvnc can be configured to only view http://www.tightvnc.com/
or you can use the protocol tcp/ip or udp screws to make a request for each computer and the other can be the server and the other can be the client (this solution requires a code and lv runtime on the machine target)
-
I need an easy way to export a CSV of clips start in my calendar.
I need to combine several clips and export in a single project or mp4 format with the name of the element and start time in a csv format. Establishment of markers for several music videos takes a long time and we won't be discussing chaining several clips that need a lot of editing - just combining and creating a matching file will not start times. I would like that my workflow as follows:
1. to import the mp4 (file name = name of the clip)
2. slide the timeline by chronological order of capture
3. easily define marker chronological beginning of the clip (auto-magiquement if possible)
4. export Media
5. export the list of lots of markers (or metadata with the start of clip times)
Fact
Any help?
Thank you
I have a timeline with bars and tone, followed by three clips (00010.mov, 00011.mov, 00012.mov).

I export an EDL, ensuring that the use Source file name is checked:

He created the EDL, which is a text file (just change the extension to .edl in .txt file):

and since it is a text file, I can import it into Excel in a delimited data file space:

and I like in Excel the reformat.
MtD
-
Hello together,
I use a HSP on different vCenters script all over the world to sample performance data. Unfortunetaly vCenter servers concerninbg time Windows locale and date are different. For this reason that I ve had different and output date at the time of the csv. Here is an example to read a virtual computer processor performance.
Get-Stat - feature $vm.name - Stat "cpu.usage.average" - IntervalMins 5 - (Get-Date).adddays(-1)-.addminutes(-5)-MaxSamples Start to finish (Get-Date) 288. Select-Object timestamp, value, unit | Export-Csv
vCenter Server located in the United States with the American Time (12-hour AM/PM) and the settings of Date (day/month/year):
'Timestamp', 'Value', 'unit '.
"2010-06-27 12:00 PM","2.75","%.
"
"
vCenter Server located in Europe with countries European regionalen (24 hours) and Date settings (day.month.year):
Timestamp, value, unit
"21.06.2010 20:00:00", "3.06", %
"
"
For the import of these data to our central database, the formats must be uniform.
Someone at - it an idea to get the uniform format?
Thanks in advance
Concerning
Oliver
Why don't you use the solution in Use-Culture - Culture culture - Script {scriptblock} ?
You do all the writing to your database in 1 selected (for example en-US culture).
This way all your date and and digital formats have the same layout.
____________
Blog: LucD notes
Twitter: lucd22
-
Generation of CSV via the process of PL/SQL
I have a unique situation. I need to generate a CSV file, which is based on a query to use in a mail merge in MS Word, but I need to do so using PL/SQL instead of declaring exports due to the record-keeping requirements. Basically, I need to get all the query of a sudden lines I take a snapshot of the results at a time given in time, build my CSV to download, so I have to go back using the files I read to mark the records that were generated in the CSV file so that the generation of fusion file is documented. Any thoughts? So, I would avoid using the file system on the server running if possible as you build a page Web of PL/SQL procedure its self simply returns the file in the web browser. Any ideas?Hello
I think this can be handled in a procedure. Consider the following:
create or replace PROCEDURE "DOWNLOAD_EMPLOYEES"
(
 ID in NUMBER
)
AS
  vLENGTH NUMBER;
  vDATA VARCHAR2(8000);
  vSEP VARCHAR2(1);
BEGIN
  vSEP := CHR(10);
  vDATA := '"EMPNO","ENAME"' || vSEP;
  FOR C IN (SELECT EMPNO, ENAME FROM EMP ORDER BY ENAME)
  LOOP
    vDATA := vDATA || '"' || C.EMPNO || '","' || C.ENAME || '"' || vSEP;
  END LOOP;
  vLENGTH := LENGTH(vDATA);
  owa_util.mime_header('text/plain', FALSE);
  htp.p('Content-length: ' || vLENGTH);
  htp.p('Content-Disposition: attachment; filename="Employees.csv"');
  owa_util.http_header_close;
  htp.p(vDATA);
END;
Create in the SQL command window followed:
GRANT EXECUTE ON DOWNLOAD_EMPLOYEES TO PUBLICThen add an A tag on a page:
<a href="#OWNER#.DOWNLOAD_EMPLOYEES?ID=1">Download</a>When you click the link, the procedure is executed, and a download comes into play.
This is, of course, just for a download and is limited by the fact that I use a varchar2 (8000) - If you need a larger amount of data, you must switch to a CLOB.
Now, as she uses a cursor (C), we can use this to insert records into a table of newspaper or anywhere where you want to store the fact that recording has been included in the download:
FOR C IN...
LOOP
...
INSERT INTO LOG_TABLE VALUES (C.EMPNO, SYSDATE);
END LOOP;
Then, as it is a single transaction, if there is no error log entries are cancelled.
Andy
PS - I do not know if I did something wrong somewhere, but I couldn't make it work properly without using the parameter - where the ID
-
A few months ago, I bought this computer online at HP.com. My problem is that its very slow on the opening of web pages (facebook, Ebay, Youtube, etc.) It takes about 2-4 minutes most of the time. I put the computer to the factory TME several times but it works still slow. I get on my wife's cell phone and its opens the same web pages fast. SO I know this isn't the internet connection.
Help, please
Hello
Slow on most web sites? But not all? That might give you a clue where the problem lies. Here are a few possibilities:
An internet router that has problems could be the cause. Download and use Pingplotter to give you a view of response time graph for each site that you want to access. Other freeware version should suffice. Alternatively, you can issue commands from the window RUN tracert.
IE on your PC does not work with the good compatibility settings is another possibility. This occurs when the remote web sites have not updated the web pages to be compatible with modern browsers. I see this problem with some HP and ASUS web sites web sites. This can be a catch 22. You configure the setting of compatibility for a site within the domain, but the other pages of the web site are coded to a different level. This one can be a real pain with response times but also feature. You can try a different browser.
-
To measure the pressure using a pressure transducer that provides the analog current output 4mA-20mA
I wanted to acquire the current analog signal which varies from 4-20mA using NI 9207. I tried in 2 ways.
method 1 - created an input channel current analog & used a reading Vi to acquire it. How can I give the channel connections in this...
method 2 - using NOR-DAQ Assistant, I put the channel connections and I got Amplitude versus time graph. She also gave negative values. Can I do this way which is easier? How can I solve the problem
First attachment belongs to the 1st method
Second attachment belongs to the 2nd method
-
Unexpected behavior in the curve route 2 generated by script
All,
As part of a larger 'application', we generate a number of curves of time vs measurand of our test data. We are now trying to add several additional graphs of this type, but this time, including signals (curves) on each of the additional graphics, and charts must be created exclusively by a script. The results are shown in the attached file ("desired output_script generated 2-curve plot.jpg"). However, after you run the script attached ("of report generation Script_2 Curves.PDF"), it seems that there is no displayed curves on the graph resulting, as indicated in the attached file ("real output_script generated 2-curve intrigue, jpg").
Most of the code to create the chart was captured using the method of 'ctrl-A' on the "Curve and definition of the axis" dialog box after you manually configure the desired graphic. After the transfer of the captured code to the script, additional lines were added to create the various objects (axes, curves, etc.) and the new objects (since the final graph will be generated 'from') scratch. I used this method before with great success.
This problem seems similar to what I had already met (and published information on) trying to add a constant (horizontal line) of a measurand existing against time graph. Because of this similarity and the resolution of the previous question, I added the PicDefByIdent = 1 directive in scripts, but the results of same behavior if this directive (and the definition of the associated "name-based" curve) is included. In addition, PicUpdate is called at the end of the script.
We use DIAdem 11.3 (with TDM Service Pack 1).
Any assistance anyone can provide this number will be greatly appreciated.
Kind regards
Bill Evans
720-988-3436.
Bill,
I'm looking into your question and he's looking for a little, but I have a few things to try now.
First of all, once you run the script, could you try to refresh the screen to report? PicUpdate should take care of this, but it does not hurt to be excluded as a possibility.
Secondly, I found this example on our site on the creation of a new chart and plotting to it: https://decibel.ni.com/content/docs/DOC-3994
And one thing I notice from this example, it's that they give the channels with D2CChnXName and D2CChnYName rather than D2ChnX and D2ChnY, so here's an example of what their definitions of strings like:
D2CChnXName = EXAMPLE/Time"."
D2CChnYName = ' EXAMPLE/speed '.I suggest to change this in your own code and see if it makes a difference. It is possible that setting the variables 'name' instead of just the X and the Y will solve the problem.
If these steps do not resolve the problem, do not hesitate to post back and I'll be happy to work on the issue more in depth and help that understand you why this does not work.
-
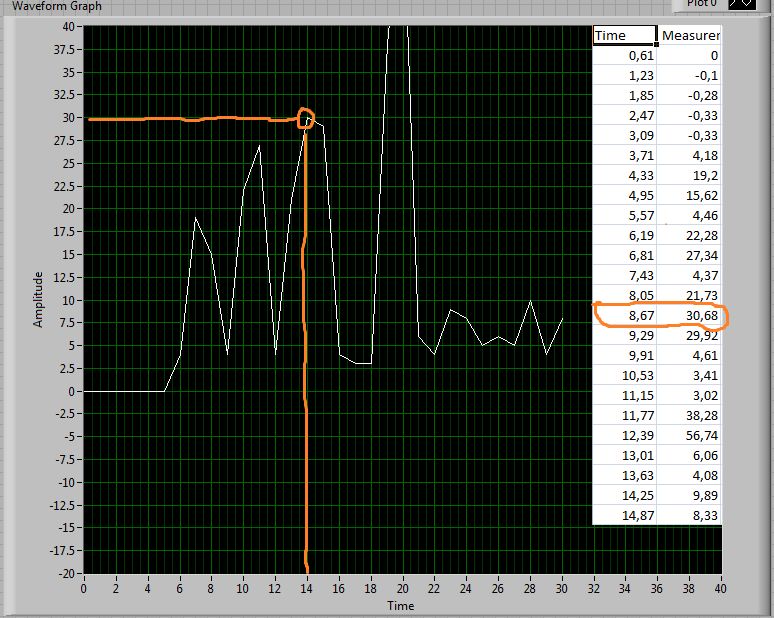
Series read several sensors (Encoder + accelerometer)
Hello
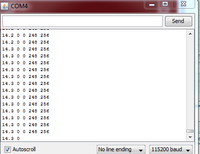
Im working on this project where demand encoder interface and accelerometer to the marker. I tried to read the serial data and use it to establish a curve (real time).
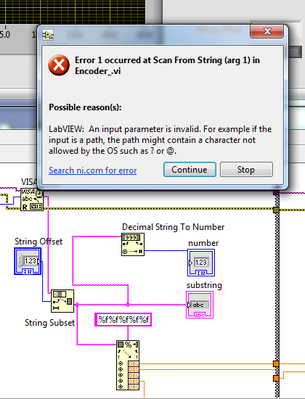
Problem;
1. whenever I run it will be always pop out error
2. There is delay in labview signal when I try to read through real-time graph.
Thank you
Effendywoo


Maybe you are looking for
-
Hello In my labview program I'm analyzing a spreadsheet. I was wondering, is it possible to find the cell empty in the worksheet and fill it with a number such as 0 or 1. Thank you Yogesh
-
Reset my Nokia to the factory via my computer settings
Hi guys! So I broke my old Nokia Lumia 1020, as broken the screen and the LED inside stuff and I want to be able to sell the phone for parts but I'm afraid to sell the phone before I can restore to factory settings because it doesn't have some useful
-
is there an update please!
-
WiFi limited connectivity (Win 7) when other devices connect correctly.
I had problems with my wifi recently. When I start my computer it connects fine, but sometimes then shows limited connectivity when all other devices (my phone and Tablet) are connected properly. I disconnect and reconnect and it temporarily solves t
-
Windows 7 backup network share, name of user and password set cached?
One of the users in our area decided that it was recommended to configure backup in Windows 7 to save backups to a network share on a Windows 2008 R2 server. Not a bad idea, however, she got asked to enter his user name and password, which she did. N