with color predetermined waveform graph
Hello
I have a table of waveforms. Now, I want to view a graph of a waveform in a way that only two or three colors to be specified of waveforms. for example if my table consist of 150 wave forms, 50 first waveforms must be displayed with the color red and the rest be displayed with black color. of course, I don't want to do it manually. is it possible to labview?
Concerning
You will need to use the properties "Plot Active" and "Color chart" handle this programmatically.
If you must first get the number of plots - another property - then decide how you want to divide them into different colors and assign each active plot the specified color.
Hope this helps,
Christian
Tags: NI Software
Similar Questions
-
Two background colors for the same waveform graph
Hello guys!
I have a question for you: I am a new user of labview, so please be nice!

So here's the deal: I just created a thanks 4 thermocouple temperature registration program.
In real time, I then have a waveform graph 4 curves as soon as I start my program. And in my program, I had a button that allows me to record the temperature in a file for a period of time at a certain frequency.
So, what I have is: I got my chart of waveform with a black background for example, and once I pressed the button, the background color will be changed automatically to highlight the part of the graph where the record occurs, then the background will return to the black after finished recording. In this way, on the same graph, I could say that registration took place from here to there by looking at the graph. I have two different background on the same graph.
I don't know how to change the background of a chart using the property node, but is it possible to do what I want?
I hope I'm clear. Otherwise, feel free to ask me for more details... I might post my vi if necessary
See you soon
Well, I know this is not exactly what you want to do, but you can try the following.
Change the color of the line on the chart when recording occurs.
You could therefore have a red line, then press on save, then it turns blue, then back to red.
And when that is confusing since you have 4 different lines on the chart 1,
You can change to a red line and a dotted red line, for example.
Would that be acceptable? If so, I can show you how to do this.
-
Add background color to specific sections of a waveform graph
I'm looking for a way to select a specific background color on a graph in waveform programmatically to axis y specific stretches. For example, between the y-axis value from 1 to 3, I would like to than the yellow wave table background color. Any suggestions on how to do this programmatically by using the nodes property?
Hello
with graphics, you can use the sliders or background images. There are even examples coming with LabVIEW showing how to display the draw boundary lines...
-
Overload CPU display with waveform graph
My sample code (yahoo.vi) presents the 2D DBL in size of 30, 000 * 2 table.
Whenever the 2D table was displayed with waveform graph, I found there were big delay (around seconds) by CPU overhead but the time was very short.
Once this has happened, the computer (8108 PXI double heart, 4G of memory, 32-bit win7) has been slow to exploit something.
Is it bug or problem comes from the computer? or do you have a solution?
labmaster
My version of LV is 2009.1 (service pack installed)
You need to transpose the table! (or right click on the chart... convert table)
You are graphing 30000 plots with two points each (hard!) instead of 2 plots with 30000 points each (easy!).
(Imagine you would display the legend of the plot with 30000 plots, it would be a mile high!)
-
General using polynomial Fit VI with waveform graph
Hello gurus,
I would like to ask how to use general polynomial Fit VI with waveform graph no GraphXY.
Waveform graph gives me an array of values not X, Y, I think, what do I do?
Thanks in advance
Hi Omar,.
I changed the example Labview embedded to use the general polynomial Fit VI with a waveform graph.
But why don't you use a X-Y-Graph?
-
Save the Studio measure waveform graph as a file for reading later
Hello
I would like to know if there is an easier way to record data are rendered on a waveform graph (configured as a graphic of the band) to capture incoming data in the code and send copies of it to a file. It would be nice if there was a method to do this, with all relevant metadata stored in the file (color, etc.). Better yet, the file could then be opened in a labview application (for example, a TDMS file) for later review.
Thank you.
PS. I use VS2010 and MS 2010.
So, it looks like you already have all the data points. For metadata that you mentioned, line color, plot colors, point colors, line styles, etc. are all accessible from the properties so if you wish, you can retrieve all that data.
I think that upon return from t0 is the same compensation history, you can use the ClearData() method.
-
Change the color of the graph by programming
HIII everybody,
I have to draw 12 plots in a waveform graph. I chose the colors in the legend of land for each parcel. But I don't want to display graph 12 at a time. I have as many checkboxes for selection as graphical user settings of the parameter to which want to see. I did what his works well.
But there is a problem in the color of the graph, if I select 12 parameters at a time, then it displays with the same color I selected on the legend of the plot. But if I choose to less than 12 parameters labview assign colors in series without distinction of color affected. I have attached the VI please help me with this.
Thank you best regards &,.
Manisha
Your problem isn't that you have changed the colors on the chart, it's that you have change the label. Actually, you have restructured your table in its entirety.
Why don't you use the Visible field? property to determine what is visible. Now you're talking almost no code.
-
missing samples in the waveform graph
Hello world
When processing a file .wav into pieces, I noticed that there are missing samples on the waveform graph where two pieces must be met for the display. What could be the cause of this? Any help appreciated. Thank you!
Milan
Your method of reading in pieces in a for loop is create a table 1 d of waveforms with the tunnels of automatic indexation. It is as well as what you have the data appear in different plots. I don't know if that's what you want.
But if this is the case, the problem is that you get to the last point of the first plot, and the first point of the next parcel is a different value. Because they are two different plots that you do not get the line to join them, as you do between points that are part of the same plot.
-
Hello
I use the metal theme to design a façade of Labview. I would like to plot x, y of the data on a chart, however, there is only a graphic of waveform and waveform Graph available in the metallic theme. Can you help me in tracing the x, the data is in the curve of waveform in the attached VI?
Thank you
hiNi.
You can customize the graph of the metallic wave and replace it with a XY Chart and set some properties to match the waveform graph
Or let me do it for you
Joint back-saved for 2011
Cross posted at the "Discussion of UI military theme" on the side of the community
-
How to display the signal on a waveform graph in Labview Signal Express?
Hello
I want to display a signal in Signal Express 3.0 in a "waveform table", but don't know how to do it and I think that it may be impossible?
In Labview, there are two ways to view data, a 'waveform table' or a 'waveform graph. The great thing with 'picture of waveform' is that it allows you to set a length of history and you can see the data move to the left (option graphic strip) that samples are recovered. It works perfectly.
In Signal Express I can only select "Graph XY" or "Waveform curve" by doing a right-click of the mouse, but I can't select "table of waveform. Is it really true that it is not possible to view data in a graph of waveform "with Labview? (1 analog signal during streaming, 100 samples to read at the rate of 1 K)
Thank you in advance,
Enrique
Hi Enrique.
You are right that there is currently no graphic waveform in SignalExpress. The thing nearest you can join, is saved data under a log and then he looks one when recording (which I know this isn't quite the same interactive behavior).
For your last comment, you wrote 'waveform curve', but I guess you meant 'picture' here as well.
Sorry about that. We recently received this request, then perhaps in a future version.
Phil
-
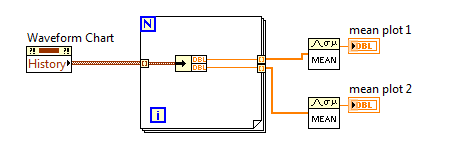
How to get the individual history of the multiple waveform graph plot
I have a table of waveform with several plots, which is a cluster as input.
I want to calculate the average of each of these plots. With simple concession of waveform graph, all I had to do is to use the property in the history of the graph node and pass the history to the generation averaged vi. With the array of multiple locations, I am unable to get the history of each parcel.
The property of the history of the land multi card node is an array of custers, not quite what I need to calculate the average.
How to me history of individual plots?
Thank you.
unbundle just your datapoints inside a loop like this
-
Multiple waveform graph, history of waveform card
Hello to all my colleagues.
I have problem with software of my purchase. I create software for the acquisition of 40 signals. I need to view and save these signals. I measure these signals with different frequencies (this depends on the user's selection), but the lowest frequency is 500 Hz and the highest is 2 000 Hz. Because I see a different size of X scale (5 sec - 60 dry), I decimate these signals for display and display only 100 samples per second.
I think that my problem is related to a very long history of waveform graph. When I display all signals in a single diagram, permanently signals are not displayed and the table is larger than the correct size of X-scale, means that the courses of the waveform graph freeze. I think the problem is connected only with display and no acquisition because I tried to check the measured data and there isn't any problem.
You have one any opinion how can I solve my problem?
Please, help me, because I'm out of ideas.
Thak you.
Here's my VI.
Double post,
Please find the thread here:
http://forums.NI.com/T5/LabVIEW/multiple-waveform-chart-history-of-waveform-charts/m-p/1762160
Best regards:
Tamas Szekely
Technical sales engineer
-
How to display more than two waveforms on a waveform graph?
Well, I have a question in the basics of waveform graphs. I have to post four waveforms simultaneously in my program. I can see two graphs on it, but when I try to display four waveforms, I get an error:
You have two or more data types of cluster wired together, but clusters have different types or numbers of items.
Cluster (unnamed), a group of 3 elements.
conflicts with graphic waveform cluster, a cluster of 2 elements.Is there anyway that I can change a graphic in waveform to a cluster of 4 elements? Because I borrowed this waveform of a VI example on waveform cards "Charts.vi", so I guess it must have been programmed to be a cluster of 2 elements.
I hope that I have my question clearly.
Thanks in advance
One of the problems that you have is that data from the DAQ assistant has a time stamp from now which is about 3 billion seconds
Data from the simulated signals has a time stamp based on the beginning of the acquisition which is about 0 seconds.
So, the table needs to be stretched early in LabVIEW time now to show all the data.
Change signals simulated so that the timestamp is the result of an absolute time, then you should be able to see all the signals.
-
Newbie - waveform graph axis graduation issue
Hi all
I'm new to studio of measure (v8.0 with .net c# 2005) sorry if this question has been answered 10 times more, please feel free to point me to a previous thread.
I have a request to:
drive voltage analog sampling at 10 Hz reading 1 sample per tick.
standard waveform graph axis X and Y and a plot as a collection of doubles.
So far, it's something pretty simple and I can get all this work in the code example.
My problem is that I want for my X axis to read between 0 and 1800 with the major divisions of 100 and minor divisions = 50. I would like for my actual graph however contain 10-point increments, so that would mean that there will be 500 points between each minor division.
I looked down through the properties of the axis and I can't enough find the properties that I need to set.
Can someone help me please.
Thanks in advance.
Steve
Hi Jamie.
Thanks for the reply. I spent all the update yesterday my system of measurement studio 2012 + Dev Studio 2010.
I put these settings, looking more closely at my data, I have a problem with my data acquisition analog voltage so I'll search through my solution and start a new thread, as I'm getting 3 times more data that I need, so it is causing my chart to be wrong.
Thanks again.
Steve
-
Hello
I want to trace the temperature change indicated by two thermocouples (that are connected to the analog input Module NI DAQmx) with repsect in time (two curves for thermocouple 1 and 2) on a graph unique waveform. Two thermocouples are connected to two channels separated in the module. Waveform graph must be shown in the before, but also exported to a worksheet.
I have grouped the entry of time and separately two thermocouples temperature readings. and then tried to build a cluster. However, I get an error message. Please see the attached VI helpme to achieve the desired results.
Thank you
Josée Vilas V
Maybe you are looking for
-
How can I find places to change color after I visited their?
the question says:Looking for secure downloads that I have to click on more, then look elsewhere ifThere is information that they are safe or not. In Internet Explorer, the link to the site would always change color after I had visited it.It was grea
-
HP compaq 8200 elite SFF graphic settings
I have HP compaq 8200 elite SFF and only intel dedicated hd graphics 2000 which says that I have only 32 MB of ram, how do I increase it? I tried to get into the BIOS but I can't change it whatever it is, not even overclock my processor, is there a s
-
Installation new ssd will void the warranty?
Hi, just the question: Installation new ssd will present instead drive the warranty? Thank you
-
Buzzing sound when I plug earphones
Hi, I have an ideapad Y570 with HDD and SSD. When I plug the headphones or the speakers, I can hear a buzzing in the left channel. I went to fix it! Help me please! THX
-
Remember - this is a public forum so never post private information such as numbers of mail or telephone! Ideas: You have problems with programs Error messages Recent changes to your computer What you have already tried to solve the problem I have th