custom chart
Hi allI generated the linear chart using the data, but the user does not see the small square box on the chart that represent data. How can I make invisible.
Thank you
CGI
Published by: user8708843 on August 19, 2010 09:15
see this:
Line chart - how to remove ugly places on the line?
Tags: Business Intelligence
Similar Questions
-
Position of custom chart datatips
Hello
I work with a BarChart in which I displayed with a custom DataTipRenderer datatips. The problem I have is that the far right DataTips, hide outside my flash animation, rather than align to the right border... can I control the position where this datatip appears somehow?
Thanks in advance,
MarcI have it!
just got a solution that seems to work.hope this helps someone:
override protected function updateDisplayList(unscaledWidth:Number,_unscaledHeight:Number):void {}
super.updateDisplayList (unscaledWidth, unscaledHeight);
If ((this.width + this.x) > this.parent.width - 10)
This.x = this.parent.width - this.width - 10;
} -
I'm trying to get rid of the blue bar on the left of any card by default. any ideas?
figured it out:
-
How to show the legend in the chart?
Is it possible to only show the graphic legend? I tried to look in the XML of the application, but I have not found anything. Help, please. :)Just add a custom chart
See also:
http://obiee101.blogspot.com/2008/08/OBIEE-date-time-scatter-graph.htmlconcerning
John
http://obiee101.blogspot.com
-
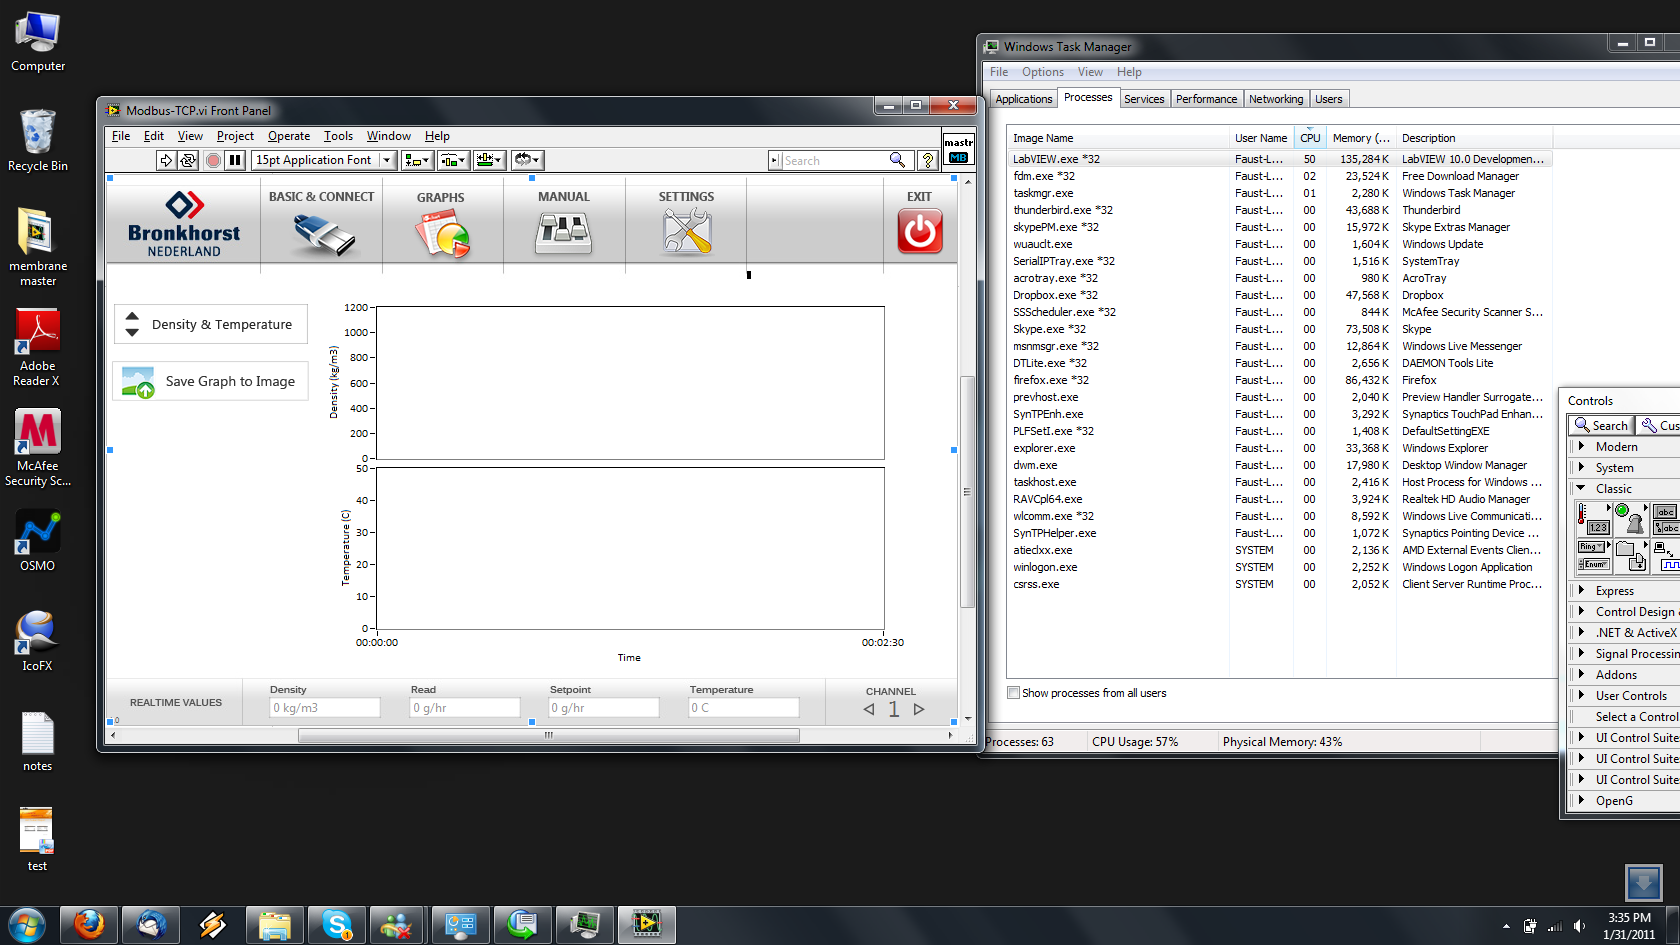
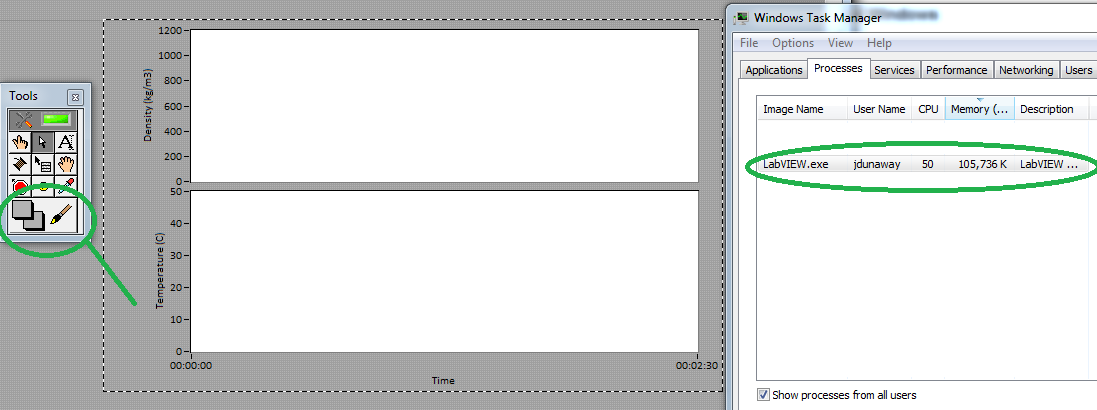
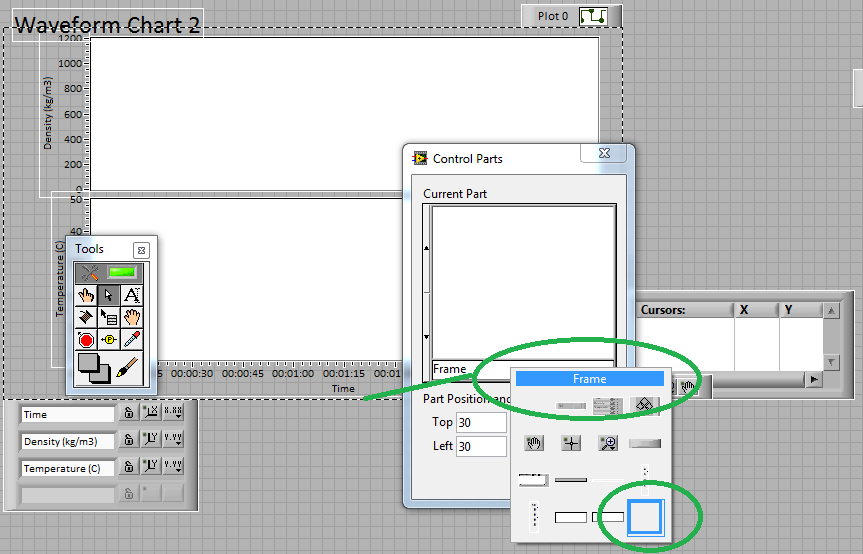
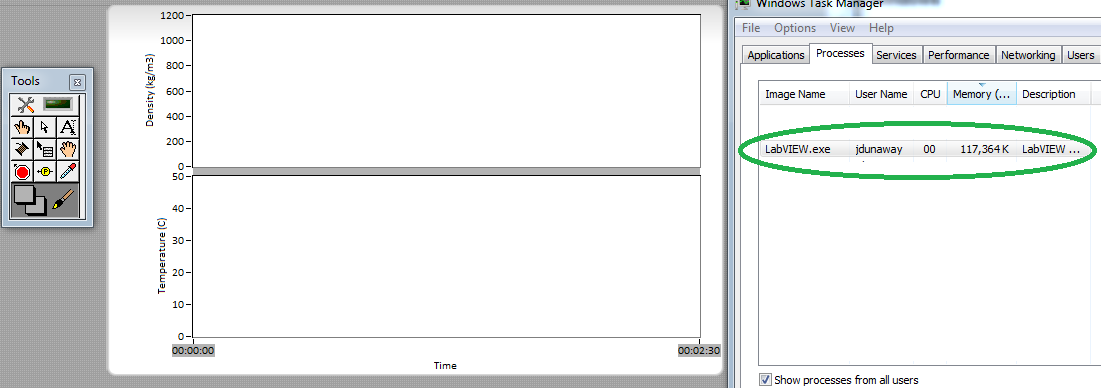
opening of VI editing mode gives 60% CPU usage
I noticed that in this project Im working on Labview was slow when connections and of the son, and others. Check with Task Manager shows
60% of load on the processor. When I close the VI and open another there is no sensitive load (like 6%). What is going on? It is in edit mode, if it is not running.
Edit: When its operation, its normal CPU usage showing as a small percentage. See the attached diagram.
I immediately knew what was wrong, because this asschapper got me dozens of times. Import you a custom chart and then tried to paint is transparent. Use the tool to redefine colors to make your CPU down to 0%.
Photo below shows that I can recreate the issue
Watch the part that goes haywire:
After recolor, I revealed your first custom chart and solved the problem. In the future, to create a custom control or an indicator component, import a flat decoration that has been coloured Transparent/Transparent.
Thank you, altenbach, for the heads up in the Bugs Thread. I would love to see this bug fixed, because it's particularly unpleasant when it manifests itself only in the built EXE but not the dev environment.
-
Can I remove Linux and run Windows 8
I have a laptop with Linux os on it, I can remove and run windows 8?
Windows 8 may install and replace Linux.
If you do, make sure that there are drivers of Windows 8 for your material available from the laptop manufacturer, particularly graphic. There are many reports of laptop computers level, not having not graphics drivers for the hardware manufacturer custom chart.
-
Hello!
IM using apex 4.2.6.
It's really something I wanted to learn for a while. So please correct me if I say something wrong.
Power of js custom charts.
For example one of the many ones d3.There are many ways different libraries to manage data. Some load them to the top of .json, some of .tsv load some code directly through.
I'd like to start somewhere I must first learn to feed data only through code? Then after that by .json or something else?For example, it loads its tsv data graphic to multiple series line
Code grouped horizontal bar chart.
Anyone have any experience doing this? I know there are a few plugins, but I want to be more flexible.
Para wrote:
IM using apex 4.2.6.
It's really something I wanted to learn for a while. So please correct me if I say something wrong.
Power of js custom charts.
For example one of the many ones d3.
There are many ways different libraries to manage data. Some load them to the top of .json, some of .tsv load some code directly through.
I'd like to start somewhere I must first learn to feed data only through code? Then after that by .json or something else?
For example, it loads its tsv data graphic to multiple series line
This one is actually using JSON, but JSON that is embedded in the source rather than read from an external source. If by "learning to feed data only through code" you will also learn JSON. However, using embedded data in this way is really only for purposes of demonstration and test and is not viable for the production.
If you create custom through APEX graphs, then it is more likely that the data source is a database table or a query to an external file, thus creating a JSON feed in the database and in the exhibitor as an application process is the way to go. APEX 5.0 has a new
apex_jsonAPI that would do this, but you could use the undocumented on 4.2apex_util.json_from_sqlmethod (at your own risk), or a third-party solution like PL/JSON. -
How to change the color of the radio buttons on question slides
Hello
Can I change the color of the radio buttons (right now it is blue) on question slides?
Thank you very much!
Not out of the box and only for HTML output. Search for assets HTML option button is there. If replace you it with a custom chart... Here's the path on my system (I'm on Win 7)
C:\Program Files\Adobe\Adobe Captivate 9 x64\HTML\assets\htmlimages
-
How can I limit the number of times a number is used in its range at random?
Hello everyone.
This is my first post on the Adobe forums so please bear with me if I violate the unwritten rules of "best practices".
Here's what I'm trying to achieve:
- Create a grid of 12 x 9;
- Fill cells with random numbers, ranging from 1 to 9;
- Assign a symbol (custom chart) for each cell that is dependent on what random number is generated
- Limit the number of times each random number is 12.
My question is simple: how, using AS3, create a random numbers function that will use that each number in its range a maximum of 12 times (it is important to note that my template includes 108 cells using the numbers from 1 to 9 exactly 12 times each)? So, for example, if the random numbers function fills the 12 cells with the number '4', it will be then exclude the number of remaining iterations.
I am adhering to standards-oriented programming script OBJECT including in frames of the actual chronology is not desirable. Thanks in advance to anyone who is willing to offer me a few minutes of their time to help out me!
create an array with all the elements:
12 times 1, 12 2...
You can do this easily with curls...
and then mix this table...
-
Context in the Signature field
I need to find a way to put an image in the background of my signature field. It should be possible using java, but I don't know how to do it. The other option would be for me to do kind of transparent image appears over the signature field. I tried, but the signature field appears on top no matter what. Any suggestions?
-Master of the precious
Thanks for the update. To use the background custom in LiveCycle:
- Select your activity of signature
- Select the Properties tab
- Scroll down to the section appearance Options Spec
- Uncheck the 'Use default Adobe PDF Logo'
- Click the Browse button
- Find and select the file SignatureLogo
Ask also about changing the appearance of the foreground. You can create a custom signature independent of the background skin. In Acrobat or Reader:
- Select Edition > Preferences (Win) or Acrobat/Reader > Preferences (Mac) menu
- Select security from the list box
- Click the new button in the appearance group box
- Here's where you can play with what you want to view and remove and you can also import a custom chart
In LiveCycle, there are similar controls to import an image and selecting the items to display in the appearance Options Spec same aforementioned section.
What size of the image should be (how much of the page, it should fall), that you will have to sign something and see what it looks like. If nothing shows up it's probably too big. Try and resize it down. What I do is to create a blank PDF file and then use the Document > menu of context to add the image. In the dialog box add / update background, you can put the image and control the opacity to get the look you want.
Steve
-
Custom color in display Gantt chart based on the State - Apex 4.2
Hello
I need to specify the custom color display Gantt chart based on the State.
Say: Open - Red
Progress-yellow
Cancelled - blue
Closed - Green
given that the status column is not part of Gantt chart question, how?
Option color in table attributes is not helping this requirement.
Kind regards
Sanjaya
Hello
Finally, the problem is resolved with the help of Hilary Farrell-Oraclefantastic example and help anychart pages. This is useful for this URL.
https://Apex.Oracle.com/pls/Apex/f?p=36648:30:102588100613368:
http://6.anychart.com/products/anygantt/docs/users-guide/index.HTML?project-Gantt-chart.html
http://6.anychart.com/products/anygantt/docs/users-guide/index.html?defaults.html
-Sanjaya
-
Can add you value labels to the columns in a chart (without a custom design)?
Is it possible to add the values for the columns in a chart to column itself without creating a custom for this column design? In this example, I represented the values in red I want will automatically appear in the data set.

FYI - in tutorial Lynda, Morty Golding shows a hack to do this, but it requires the creation of a custom column design. I wonder if there is a way to do it with just the default column design. Thank you!
You need a custom column design to do this.
-
I have a report in Oracle Bi answers with several customer-id: s in a table.
I also want to show this graphically, but I want a customer by id chart. Is this possible to do?In responses, Pivot table you can do. Select "table rotated results" and move the client code in the sections tab you will get separate graph for each customer id based on the measure.
-
DataTip custom rendering engine for chart
I use the code below to create a converter from tip of custom data in a chart. Right now, I have a rendering by chart type engine. It works well but I would like to have the component under the handle any type of graph.
What should I put in the switch statement so the correct variable will be created?
I sailed in the Variables pane and I see an id for the variable element, but I do not know how to access it properly.
< mx:VBox
' xmlns:mx = ' http://www.Adobe.com/2006/MXML "
backgroundColor = "#FFFFFF."
backgroundAlpha = "0.95.
borderColor = "0xB7BABC.
borderStyle = "solid".
paddingTop = "5".
paddingBottom = "5".
paddingRight = "10".
paddingLeft = "10".
verticalGap = "-2".
Color = "#000000".
>
< mx:Label text = "{_dayText}" width = "100%" textAlign = "center" fontWeight = "bold" fontSize = "13" / >
< mx:Label text = "{_dollarText}" width = "100%" textAlign = "center" fontSize = "11" / >
< mx:NumberFormatter
ID = "dollarFormatter".
precision = '2 '.
thousandsSeparatorTo = «»
decimalSeparatorTo =". »
rounding = more 'close '.
/ >
< mx:Script >
<! [CDATA]
Import mx.charts.series.items.ColumnSeriesItem;
Import mx.charts.series.items.LineSeriesItem;
Import mx.charts.HitData;
Import mx.formatters.NumberFormatter;[Bindable]
private var _dayText:String;[Bindable]
private var _dollarText:String;override public function set data(value:Object):void {}
We know to expect a HitData object from a graph, so let's cast as such
While there are no surprises DURATION
HD:HitData var = value as HitData;Any HitData object has a reference to the ChartItem that created it.
This is where we need to know exactly what kind of Chartitem we deal with.
Why? Because a pie chart will not have an xValue and yValue a, but things
as the bar charts, histograms and, in our case, the charts will be.
switch (?) {
case 'ColumnSeries ':
var point: ColumnSeriesItem = hd.chartItem as ColumnSeriesItem;
break;
}
var point: LineSeriesItem = hd.chartItem as LineSeriesItem;
var point: ColumnSeriesItem = hd.chartItem as ColumnSeriesItem
the xValue and yValue are returned as objects. Let's take as strings, so
that we can display them in the fields of the label.
_dayText = string (item.xValue);
_dollarText = "$" + dollarFormatter.format (String (item.yValue));
} //end set data
[]] >
< / mx:Script >
< / mx:VBox >The operator 'is' you will tell if the data type of the object "is" of a certain type.
So if (event.currentTarget button) returns true if the data type of the event.currentTarget object "is" button, or maybe a subcategory.
This expands your possibilities and simplifies your codes, as you don't have to rely on IDS, but can simply check the data type.
Of course, that your situation must lend itself to data type checking and I think in your case because PieChart was different, I think that yours falls into this category.
If this post has answered your question or helped, please mark it as such.
-
WPF CHART DATASOUCE CUSTOM STRUCT POINT
Graph DataSource in the Group ChartCollection
Graph.Plot = PointPlotRenderer
execution error:
Could not find item type conversion to type Double.
public struct item: IFormattable
{Public item (double x, double y)
{
X = x;
Y = y;
}public double X {get; set ;}}
public double Y {get; set ;}}
public string ToString (string format, IFormatProvider formatProvider)
{
throw new NotImplementedException();
Returns the string. Format ("{0}, {1}", X, Y);
}
}To use a custom with the graphic data type, you must also implement a descriptor so that the graph knows how to access your data. I have attached a descriptor to another question, translated into c# for your type of data.
To use the descriptor, add a
DataTypeDescriptorattribute to your custom type:[DataTypeDescriptor( typeof( PointIDescriptor ) )]
public struct PointI : IFormattable {
// ...
}

Maybe you are looking for
-
http://index.Hu/x.php?id=inxcl & URL=http%3A%2F%2Findex.hu%2Fkultur%2Fklassz%2F2010%2F09%2F19%2Felhunyt_polgar_laszlo_operaenekes%2F URLs containing % 3A % 2F 2F not displayed (see example above)
-
Can I use the SIM on a 4s in a unlocked 6s more?
Can I use the SIM on a 4s in a unlocked 6s more?
-
Hello We have academic site license and we settled in and past (online registration) on 3-4 of our lab computers. But recently we are facing problems with new installation is not passing by online registration. Until yesterday, she was valid on one c
-
9.1 ASA 2 drops PING (icmp codes 0 & 8)
Hello Im trying to ping DMZ on ASA to interface to the host from the INSIDE and vice versa. It does not work :( Trying to debug icmp however the icmp packet did not even touch the DMZ interface for the particular host. Doing so with packet - trace AS
-
Universal application for both versions of the OS
Hi all What is the best way to create applications that will work on different OS version with the help of the old OS functions? For example, the application must check something in the background and inform the user if a problem occurs. 4.6 + we can