DB Toolset - slow queries
I use DB toolset to acquire data from the server and is very slow. It takes almost 3 minutes to make the data using the tools, but there is virtually no wait when I made the request in MS SQL Server Management Studio. I don't expect the toolset to be as fast as SQL SMS but maybe a lil closer... Unless there is something wrong with my VI then it's another story.
As I searched on the forum that it is seems to be a problem in young...
If there is an idea to accelerate this thing please do advice...
Thank you very much..
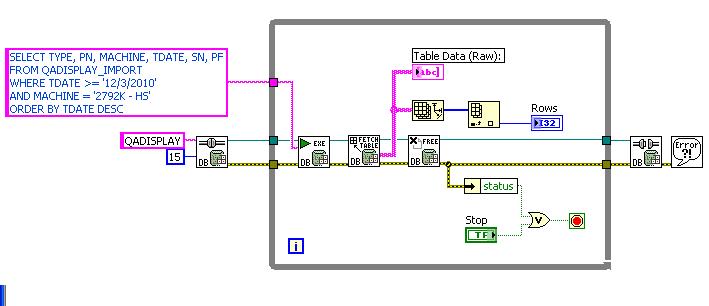
"Why is the database toolset slow to return data from the Table?"
http://digital.NI.com/public.nsf/allkb/862567530005F0A186256A33006B917A
(I suspect that the database-variant for the data at the heart of Fetch Table is the culprit. Try the normal recordset to Fetch that generates output a table of variant).
Tags: NI Software
Similar Questions
-
Why don't XMLIndex not used in slow queries against an XMLType Table?
We have a slow queries based on XML with the help of XMLTable shown here running on 11 g Rel 2 (11.2.0.1) - basis for SUNOS:
The development team noted:select xcust.eid, xmi.ami, xmi.memberNum, xmi.accountNum from CROUTREACH.acme_cust cust, XMLTable( XMLNAMESPACES(default 'http://www.cigna.com/acme/domains/customer/customerprofile/2011/11'), '$doc/customerProfile' passing cust.object_value as "doc" columns eid varchar2(50) path '@eid' ) xcust, XMLTable(XMLNAMESPACES(default 'http://www.cigna.com/acme/domains/customer/customerprofile/2011/11'), 'for $i in /customerProfile/memberInfos/memberInfo return $i' passing cust.object_value columns ami varchar2(15) path 'ami', memberNum varchar(20) path 'clientRelationship/memberNum', accountNum varchar(20) path 'clientRelationship/accountNum' ) xmi *where xmi.accountNum = '3174016'* *and xmi.memberNum = '07646258301'*
"It worked for a while (minutes)." I'm not familiar with indexing on XML tables, but if we can somehow index by Member num/acct num (even temporarily), I think that it would speed up the process considerably. »
We have team added Oracle DBA fields num num/acct members to this xmlindex to recreate:
Unfortunately, when we run the query XML is slow; a full table scan occurs on the query and the xmlindex do not get used.CREATE INDEX ACME_CUST_XMLINDEX_IX ON ACME_CUST (OBJECT_VALUE) INDEXTYPE IS XDB.XMLINDEX PARAMETERS ('XMLTABLE ACME_CUST_IDX_TAB XMLNamespaces (''http://www.cigna.com/acme/domains/commoncontact/2011/11'' as "cm", default ''http://www.cigna.com/acme/domains/customer/customerprofile/2011/11''), ''/customerProfile'' columns DOB date PATH ''personInformation/cm:birthDate'', FIRSTNAME varchar2(40) PATH ''name/cm:givenName'', LASTNAME varchar2(40) PATH ''name/cm:surName'', SSN varchar2(30) PATH ''identifiers/ssn'', MEMBERINFOS XMLType path ''memberInfos/memberInfo'' VIRTUAL XMLTable acme_cust_lev2_idx_tab XMLNAMESPACES(default ''http://www.cigna.com/acme/domains/customer/customerprofile/2011/11''), ''/memberInfo'' passing MEMBERINFOS columns ami varchar2(40) PATH ''ami'', subscId varchar2(50) PATH ''clientRelationship/subscriberInformation/subscriberId'', employeeId varchar2(50) PATH ''systemKeys/employeeId'', clientId varchar2(50) PATH ''clientRelationship/clientId'', *accountNum varchar2(50) PATH ''clientRelationship/accountNum''*, *memberNum varchar2(50) PATH ''clientRelationship/memberNum'''*) PARALLEL 16;
We are at a lost as to why the xmlindex serves not - before and after collecting pass them on the underlying table for the ACME_CUST?
Especially with highly selective predicates in the WHERE clause.
Here is the definition of table ACME_CUST:
Any help on this is much appreciated to say the least!CREATE TABLE "CROUTREACH"."ACME_CUST" OF XMLTYPE ( CONSTRAINT "ACME_CUST_ID_PK" PRIMARY KEY ("ACME_CUST_ID") USING INDEX PCTFREE 10 INITRANS 2 MAXTRANS 255 COMPUTE STATISTICS STORAGE(INITIAL 65536 NEXT 1048576 MINEXTENTS 1 MAXEXTENTS 2147483645 PCTINCREASE 0 FREELISTS 1 FREELIST GROUPS 1 BUFFER_POOL DEFAULT FLASH_CACHE DEFAULT CELL_FLASH_CACHE DEFAULT) TABLESPACE "ACME_DATA" ENABLE ) XMLTYPE STORE AS SECUREFILE BINARY XML ( TABLESPACE "ACME_DATA" ENABLE STORAGE IN ROW CHUNK 8192 CACHE READS LOGGING NOCOMPRESS KEEP_DUPLICATES STORAGE(INITIAL 106496 NEXT 1048576 MINEXTENTS 1 MAXEXTENTS 2147483645 PCTINCREASE 0 BUFFER_POOL DEFAULT FLASH_CACHE DEFAULT CELL_FLASH_CACHE DEFAULT) ) ALLOW NONSCHEMA ALLOW ANYSCHEMA VIRTUAL COLUMNS ( "EID" AS (CAST(SYS_XQ_UPKXML2SQL(SYS_XQEXVAL(XMLQUERY( 'declare default element namespace "http://www.cigna.com/acme/domains/customer/customerprofile/2011/11"; (::) /customerProfile/@eid' PASSING BY VALUE SYS_MAKEXML(128,"XMLDATA") RETURNING CONTENT ),0,0, 16777216,0),50,1,2) AS VARCHAR2(15))), "ACME_CUST_ID" AS (CAST(SYS_XQ_UPKXML2SQL(SYS_XQEXVAL(XMLQUERY( 'declare default element namespace "http://www.cigna.com/acme/domains/customer/customerprofile/2011/11"; (::) /customerProfile/@id' PASSING BY VALUE SYS_MAKEXML(128,"XMLDATA") RETURNING CONTENT ),0,0, 16777216,0),50,1,2) AS VARCHAR2(50))), "CRET_DT" AS (SYS_EXTRACT_UTC(CAST(TO_TIMESTAMP_TZ(SYS_XQ_UPKXML2SQL( SYS_XQEXVAL(XMLQUERY( 'declare default element namespace "http://www.cigna.com/acme/domains/customer/customerprofile/2011/11"; (::) /customerProfile/@create_dt' PASSING BY VALUE SYS_MAKEXML(128,"XMLDATA") RETURNING CONTENT ),0,0, 16777216,0),50,1,2),'SYYYY-MM-DD"T"HH24:MI:SS.FFTZH:TZM') AS TIMESTAMP WITH TIME ZONE))) ) PCTFREE 10 PCTUSED 40 INITRANS 1 MAXTRANS 255 NOCOMPRESS LOGGING STORAGE ( INITIAL 65536 NEXT 1048576 MINEXTENTS 1 MAXEXTENTS 2147483645 PCTINCREASE 0 FREELISTS 1 FREELIST GROUPS 1 BUFFER_POOL DEFAULT FLASH_CACHE DEFAULT CELL_FLASH_CACHE DEFAULT ) TABLESPACE "ACME_DATA" ;
Kind regards
Rick BlanchardCould you post an explain plan?
-
slow queries with high_value inappropriate for partition interval
Hello
yesterday, I defined a partitioned table with a single initial partition interval. The partition key was an id of value with a (generated sequence) run around, the interval was 1 - and since I didn't know the value of the id, I put the high value of initial partition 1. Then I inserted a few lines, started a query simple - and waited a long time for the result. 10046 trace showed, that the query was using a lot of cpu - but I had no idea what he was doing.
Today, I created a simple test case (in 11.1.0.7 on a Centos 5-server; but I got similar results on my Windows 11.2.0.1 database):
When I choose a high_value > 100000 grouping query runs < 1 sec.-- test_interval.sql set verify off undefine high_value drop table test_interval_p1_&&high_value; create table test_interval_p1_&high_value partition by range (id) interval (1) (partition test_p1 values less than (&high_value)) as select 100000 id , t.* from all_objects t where 1 = 0; insert into test_interval_p1_&high_value select 100000 id , t.* from all_objects t; commit; -- pause select id, count(*) from test_interval_p1_&high_value group by id;
With high_value = 100000: 1 < s
With high_value = 90000: 1 sec
With high_value = 80000: 3 sec
With high_value = 70000: 9 dry
With high_value = 60000: 17 dry
With high_value = 50000: 28 dry
With high_value = 40000: 34 dry
With high_value = 30000: 47 dry
With high_value = s 20000: 61
With high_value = 10000: 76 s
With high_value = s 1: 102
When I take pictures of the v$ sesstat before and after execution of the statement, I see that the slow queries show signifikant higher values for "CPU used when calling has begun", "CPU used by this session,"DB time","uga session in memory","pga session in memory.
But I have still no idea what the query does with all CPUS (maybe browse the possible - but non-existent partitions? "(Mais cela semble un peu ridicule)." In documentation (http://download.oracle.com/docs/cd/E11882_01/server.112/e16541/part_admin001.htm#VLDBG1088), I couldn't find any explanation (and I have no MOS access at the moment).
Can someone explain to me what is happening here?
Thanks and greetings
Martin
Edited by: mpreiss may 25, 2011 20:05
Edited by: mpreiss may 25, 2011 20:45>
>
But I have still no idea what the query does with all CPUS (maybe browse the possible - but non-existent partitions? "(Mais cela semble un peu ridicule)." In documentation (http://download.oracle.com/docs/cd/E11882_01/server.112/e16541/part_admin001.htm#VLDBG1088), I couldn't find any explanation (and I have no MOS access at the moment).
Can someone explain to me what is happening here?
It looks like a bug - call him in to Oracle with a SR.
I repeated your test but only to insert a row into the table, and it took 15 seconds to run the query on my laptop when I put & high_value 25000.
Check the activity of rowcache $ v - this is where the CPU is going. You will see '100 000 - high_value' Gets the dc_tablespaces and dc_users rank of the cache entries when you run the query (and it's two hits on rowcache latch latch for each get).
Concerning
Jonathan Lewis -
Slow queries in executable on the Surface of Win8
Having a problem with an executable file using LV 2013 and connectivity toolkit. Exe works fine on my Win7 32 bit machine and the code works well in development on Win 8 Surface mode. Functioning as an EXE file on the same winning 8 Surface is extremely slow (factor of 20 or so slower that the mode of development on the machine either EXE or on Win7 machine).
I see a variety of positions "to do something special with EXE using connectivity tools" but they are all<2006 and="" the="" exe="" works="" fine="" on="" win7="" machine="" so="" i'm="" thinking="" they="" "something="" specials"="" are="" not="">
Pointing to a localhost MySQL database. Database contains about 15 tables and no table has more than 10 k lines. Does nothing exotic in queries and there is not many of them, like going from databases. Multiple queries (but maybe not all of them, I'm not sure) involving different tables are slow.
Have tried (all to no effect):
1] connecting to a remote instance of MySQL with the same data
2] recompile the EXE file
[3] restart of the Surface
Am trying another Surface. Will also try to compile on the Surface (it is currently compiled on Win7-32 and settles to the Surface of Win8 64).
Any thoughts?
Solved. It turns out that it was a combination of a string of bad connection and not degenerated errors and multiple reconnection attempts.
It was useful; I'll post it here in the interest of sharing: https://www.connectionstrings.com/mysql-connector-odbc-5-2/
-
Hello
I use 10.2.0.1.0 oracle
I made a report using a query that includes tables 5 and 6. Although the data is not too high, the report takes 25-30 sec
I write my query below, please suggest if certain functions or something that I use in the query, it is slow
Thank youSelect ctry,decode(bltype, 'I', to_char(voy_eta,'MONYYYY'), 'E' ,to_char(voy_etd,'MONYYYY') ) voy_dt, sum(decode(siz,20,cont)) Teu, sum(decode(siz,20,0, cont)) Feu from ( Select bdl.bdl_type bltype,lm.loc_ctry ctry ,vm.voy_etd,vm.voy_eta, count(distinct(bc.bcr_container)) cont,bc.bcr_size siz from Bl_Details bdl ,Carrier_Master cm ,Voyage_Master vm,Location_Master lm, Service_Master sm,Bl_Containers Bc Where bdl_company = :P_Company and (bdl.BDL_TYPE=:P_bl_type or :P_bl_type is null) and bdl.BDL_STATUS <> 'C' and ( bdl.bdl_company = cm.car_company and bdl.bdl_carrier = cm.car_code and cm.car_shp_mode = 'SEA' ) and ( bdl.bdl_company = vm.voy_company and bdl.bdl_carrier = vm.voy_carrier and bdl.bdl_voy = vm.voy_code and bdl.bdl_vessel = vm.voy_vessel and bdl.bdl_location = vm.voy_location and bdl.bdl_type = vm.voy_type and ( ( bdl.bdl_type='E' and ( (vm.voy_etd >= :P_Fromdt or :P_Fromdt is null ) and (vm.voy_etd <= :P_todt or :P_todt is null ) )) or ( bdl.bdl_type='I' and ( (vm.voy_etd >= :P_Fromdt or :P_Fromdt is null ) and (vm.voy_etd <= :P_todt or :P_todt is null ) )) ) ) and ( bdl.bdl_company = sm.srv_company and bdl.bdl_service = sm.srv_code and sm.srv_type = 'FCL') and ( (bdl.bdl_type= 'E' and Bdl.BDL_Company = lm.loc_company and bdl.bdl_disport = lm.loc_code and (lm.loc_ctry=:P_Ctry or :P_Ctry is null)) or (bdl.bdl_type= 'I' and Bdl.BDL_Company = lm.loc_company and bdl.bdl_loadport = lm.loc_code and (lm.loc_ctry=:P_Ctry or :P_Ctry is null)) ) and ( bdl.bdl_company = bc.bcr_company and bdl.bdl_reference = bc.bcr_reference) GROUP BY bdl.bdl_type, lm.loc_ctry, vm.voy_etd, vm.voy_eta, bc.bcr_size )GROUP BY ctry, decode(bltype, 'I', to_char(voy_eta,'MONYYYY'), 'E' ,to_char(voy_etd,'MONYYYY') );Hello
No problem, I was bored so I thought I would give it a go.
If you are not able to produce a stored procedure for this, you will be quite limited. The problem is that you have the optional parameters and you also predicates that are applied in one case but not in another, e.g. bdl_type = 'E '... OR bdl_type = 'I '. Looking for a little closer (after reformatting of your query), predicates you have in the optional sections don't make sense i.e.
        AND
          (
            (   bdl.bdl_type='E'
              and
                (
                    ( vm.voy_etd >= :P_Fromdt OR :P_Fromdt  IS NULL  )
                  and
                    (vm.voy_etd <= :P_todt  or :P_todt is null )
                )
            )
            OR
            (   bdl.bdl_type='I'
            and
                (
                    (vm.voy_etd >= :P_Fromdt OR :P_Fromdt  IS NULL  )
                  AND
                    (vm.voy_etd <= :P_todt  OR :P_todt IS NULL )
                )
            )
          )
Predicates are the same for the two bdl_types, so you chose the wrong columns for one of them, or you can get rid of a set and remove the predicate bdl_type of this section.
Also you nest things that need not be nested.
         and
          (
              (   bdl.bdl_type= 'E'
              and
                  Bdl.BDL_Company = lm.loc_company
              and
                  bdl.bdl_disport = lm.loc_code
              AND
                  (lm.loc_ctry=:P_Ctry OR :P_Ctry IS NULL)
              )
              OR
                (   bdl.bdl_type= 'I'
                and
                    Bdl.BDL_Company = lm.loc_company
                and
                    bdl.bdl_loadport = lm.loc_code
                AND
                    (lm.loc_ctry=:P_Ctry OR :P_Ctry IS NULL)
                )
          )
You don't need to have the optional predicate here and it is as useless as all of the joint between ORL and lm in there. I think that the request can be converted as follows...
Select ctry,decode(bltype, 'I', to_char(voy_eta,'MONYYYY'),
                            'E' ,to_char(voy_etd,'MONYYYY') ) voy_dt,
            sum(decode(siz,20,cont)) Teu,
            sum(decode(siz,20,0, cont)) Feu
from
(
    Select
        bdl.bdl_type bltype,
        lm.loc_ctry ctry ,
        vm.voy_etd,
        vm.voy_eta,
        count(DISTINCT(bc.bcr_container)) cont,
        bc.bcr_size siz
    from
        Bl_Details bdl ,
        Carrier_Master cm ,
        Voyage_Master vm,
        Location_Master lm,
        Service_Master sm,
        Bl_Containers Bc
    WHERE
        bdl_company = :P_Company
    AND
       (
          bdl.BDL_TYPE=:P_bl_type
        OR
          :P_bl_type IS NULL
       )
    and
        bdl.BDL_STATUS  'C'
    AND
        bdl.bdl_company = cm.car_company
    and
        bdl.bdl_carrier = cm.car_code
    AND
        cm.car_shp_mode = 'SEA'
    AND
        bdl.bdl_company = vm.voy_company
    and
        bdl.bdl_carrier = vm.voy_carrier
    and
        bdl.bdl_voy = vm.voy_code
    and
        bdl.bdl_vessel = vm.voy_vessel
    and
        bdl.bdl_location = vm.voy_location
    and
        bdl.bdl_type = vm.voy_type
    AND
        (
          vm.voy_etd >= :P_Fromdt
        OR
          :P_Fromdt  IS NULL
        )
    AND
        (
          vm.voy_etd <= :P_todt
        OR
          :P_todt IS NULL
        )
    AND
        bdl.bdl_company = sm.srv_company
    and
        bdl.bdl_service = sm.srv_code and sm.srv_type = 'FCL')
    AND
        Bdl.BDL_Company = lm.loc_company
    AND
        (
            lm.loc_ctry=:P_Ctry
        OR
            :P_Ctry IS NULL
        )
    AND
          (
              (   bdl.bdl_type= 'E'
              and
                  bdl.bdl_disport = lm.loc_code
              )
              OR
                (   bdl.bdl_type= 'I'
                and
                    bdl.bdl_loadport = lm.loc_code
                )
          )
    and
      bdl.bdl_company = bc.bcr_company
    and
      bdl.bdl_reference = bc.bcr_reference
    GROUP BY
      bdl.bdl_type,
      lm.loc_ctry,
      vm.voy_etd,
      vm.voy_eta,
      bc.bcr_size
  )
  GROUP BY ctry, decode(bltype, 'I', to_char(voy_eta,'MONYYYY'),
                            'E' ,to_char(voy_etd,'MONYYYY') );
But this will only get you so far. Any way you approach, you will have to try to check the optimizer based on CSSTidy somewhat. It can, for example be preferable for performance of this split into two queries and use a UNION all. normally, I would try to avoid this, if possible, but in case you have these optional predicates, it may be better to have two queries that are optimized for their respective bdl_type, rather than to have a single query that tries to satisfy both.
HTH
David
-
Why xmlindex is not used in the slow queries on xml binary table eval?
I run a slow simple query on Oracle 11.2.0.1 database server that does not use a xmlindex. Instead, a full table scan against the table eval binary xml occurs. This is the query:
The predicate is not selective at all - the number of rows returned is the same as the number of rows in table (325 550 in the eval table xml documents). When different values are used, which brings the number of lines down to ~ 33%, the xmlindex still is not used - as is expected in a purely relational XML environment.select -- /*+ NO_XMLINDEX_REWRITE no_parallel(eval)*/ defid from eval, XMLTable(XMLNAMESPACES(DEFAULT 'http://www.cigna.com/acme/domains/eval/2010/03', 'http://www.cigna.com/acme/domains/derived/fact/2010/03' AS "ns7"), '$doc/eval/derivedFacts/ns7:derivedFact' passing eval.object_value as "doc" columns defid varchar2(100) path 'ns7:defId' ) eval_xml where eval_xml.defid in ('59543','55208');
My question is why would'nt the xmlindex be used somehow full scan compared to a sweep of full table that cross the xml for each record in paper table eval?
FFS suspicion would apply to a field of type xmlindex index?
Here is the definition of xmlindex:
Here is the definition of table eval:CREATE INDEX "EVAL_XMLINDEX_IX" ON "EVAL" (OBJECT_VALUE) INDEXTYPE IS "XDB"."XMLINDEX" PARAMETERS ('XMLTable eval_idx_tab XMLNamespaces(DEFAULT ''http://www.cigna.com/acme/domains/eval/2010/03'', ''http://www.cigna.com/acme/domains/derived/fact/2010/03'' AS "ns7"),''/eval'' COLUMNS defId VARCHAR2(100) path ''/derivedFacts/ns7:derivedFact/ns7:defId''');
Purified sample extract of XML:CREATE TABLE "N98991"."EVAL" OF XMLTYPE ( CONSTRAINT "EVAL_ID_PK" PRIMARY KEY ("EVAL_ID") USING INDEX PCTFREE 10 INITRANS 4 MAXTRANS 255 COMPUTE STATISTICS STORAGE(INITIAL 65536 NEXT 1048576 MINEXTENTS 1 MAXEXTENTS 2147483645 PCTINCREASE 0 FREELISTS 1 FREELIST GROUPS 1 BUFFER_POOL DEFAULT FLASH_CACHE DEFAULT CELL_FLASH_CACHE DEFAULT) TABLESPACE "ACME_DATA" ENABLE ) XMLTYPE STORE AS SECUREFILE BINARY XML ( TABLESPACE "ACME_DATA" ENABLE STORAGE IN ROW CHUNK 8192 CACHE NOCOMPRESS KEEP_DUPLICATES STORAGE(INITIAL 106496 NEXT 1048576 MINEXTENTS 1 MAXEXTENTS 2147483645 PCTINCREASE 0 BUFFER_POOL DEFAULT FLASH_CACHE DEFAULT CELL_FLASH_CACHE DEFAULT) ) ALLOW NONSCHEMA ALLOW ANYSCHEMA VIRTUAL COLUMNS ( "EVAL_DT" AS (SYS_EXTRACT_UTC(CAST(TO_TIMESTAMP_TZ(SYS_XQ_UPKXML2SQL( SYS_XQEXVAL(XMLQUERY( 'declare default element namespace "http://www.cigna.com/acme/domains/eval/2010/03"; (::) /eval/@eval_dt' PASSING BY VALUE SYS_MAKEXML(128,"XMLDATA") RETURNING CONTENT ),0,0, 16777216,0),50,1,2),'SYYYY-MM-DD"T"HH24:MI:SS.FFTZH:TZM') AS TIMESTAMP WITH TIME ZONE))), "EVAL_CAT" AS (CAST(SYS_XQ_UPKXML2SQL(SYS_XQEXVAL(XMLQUERY( 'declare default element namespace "http://www.cigna.com/acme/domains/eval/2010/03";/eval/@category' PASSING BY VALUE SYS_MAKEXML(128,"XMLDATA") RETURNING CONTENT ),0,0, 16777216,0),50,1,2) AS VARCHAR2(50))), "ACME_MBR_ID" AS (CAST(SYS_XQ_UPKXML2SQL(SYS_XQEXVAL(XMLQUERY( 'declare default element namespace "http://www.cigna.com/acme/domains/eval/2010/03";/eval/@acmeMemberId' PASSING BY VALUE SYS_MAKEXML(128,"XMLDATA") RETURNING CONTENT ),0,0, 16777216,0),50,1,2) AS VARCHAR2(50))), "EVAL_ID" AS (CAST(SYS_XQ_UPKXML2SQL(SYS_XQEXVAL(XMLQUERY( 'declare default element namespace "http://www.cigna.com/acme/domains/eval/2010/03";/eval/@evalId' PASSING BY VALUE SYS_MAKEXML(128,"XMLDATA") RETURNING CONTENT ),0,0, 16777216,0),50,1,2) AS VARCHAR2(50))) ) PCTFREE 0 PCTUSED 80 INITRANS 4 MAXTRANS 255 NOCOMPRESS LOGGING STORAGE ( INITIAL 65536 NEXT 1048576 MINEXTENTS 1 MAXEXTENTS 2147483645 PCTINCREASE 0 FREELISTS 1 FREELIST GROUPS 1 BUFFER_POOL DEFAULT FLASH_CACHE DEFAULT CELL_FLASH_CACHE DEFAULT ) TABLESPACE "ACME_DATA" ;
Oracle XML DB 11g Release 2 Developer's Guide is not much help...<?xml version = '1.0' encoding = 'UTF-8' standalone = 'yes'?><eval createdById="xxxx" hhhhMemberId="37e6f05a-88dc-41e9-a8df-2a2ac6d822c9" category="eeeeeeee" eval_dt="2012-02-11T23:47:02.645Z" evalId="12e007f5-b7c3-4da2-b8b8-4bf066675d1a" xmlns="http://www.xxxxx.com/vvvv/domains/eval/2010/03" xmlns:ns2="http://www.cigna.com/nnnn/domains/derived/fact/2010/03" xmlns:ns3="http://www.xxxxx.com/vvvv/domains/common/2010/03"> <derivedFacts> <ns2:derivedFact> <ns2:defId>12345</ns2:defId> <ns2:defUrn>urn:mmmmrunner:Medical:Definition:DerivedFact:52657:1</ns2:defUrn> <ns2:factSource>tttt Member</ns2:factSource> <ns2:origInferred_dt>2012-02-11T23:47:02.645Z</ns2:origInferred_dt> <ns2:factValue> <ns2:type>boolean</ns2:type> <ns2:value>true</ns2:value> </ns2:factValue> </ns2:derivedFact> <ns2:derivedFact> <ns2:defId>52600</ns2:defId> <ns2:defUrn>urn:ddddrunner:Medical:Definition:DerivedFact:52600:2</ns2:defUrn> <ns2:factSource>cccc Member</ns2:factSource> <ns2:origInferred_dt>2012-02-11T23:47:02.645Z</ns2:origInferred_dt> <ns2:factValue> <ns2:type>string</ns2:type> <ns2:value>null</ns2:value> </ns2:factValue> </ns2:derivedFact> <ns2:derivedFact> <ns2:defId>59543</ns2:defId> <ns2:defUrn>urn:ddddunner:Medical:Definition:DerivedFact:52599:1</ns2:defUrn> <ns2:factSource>dddd Member</ns2:factSource> <ns2:origInferred_dt>2012-02-11T23:47:02.645Z</ns2:origInferred_dt> <ns2:factValue> <ns2:type>string</ns2:type> <ns2:value>INT</ns2:value> </ns2:factValue> </ns2:derivedFact> ... With the repeating <ns2:derivedFact> element continuing under the <derivedFacts>
Any help is appreciated.
Kind regards
Rick BlanchardXMLIndex definition is not correct, for the following reasons:
In the COLUMNS clause, the path expression is compared to the context from the main event of XQuery item (HERE "/ eval").
If you use an initial slash as you did, this indicates that the context item is an element of "derivedFacts" (which is not correct since it is an "eval" element).
Therefore, the path points to no existing node:derivedFact XMLTYPE path ''/derivedFacts/ns7:derivedFact'' virtualThere is a mismatch between the statements of prefix ns7, probably a typing mistake?
''http://www.cigna.com/acme/domains/derived/fact/2010/03'' AS "ns7"
...
''http://www.cigna.com/acme/domains/derived/FACT/2010/03'' AS "ns7"
What "eval_xml" is referring to here?
passing eval_xml.derivedFactThe path to "defId" don't go too:
defId VARCHAR2(100) path ''/derivedFacts/ns7:derivedFact/ns7:defId''Try this one, it should help you to:
CREATE INDEX "EVAL_XMLINDEX_IX" ON "EVAL" (OBJECT_VALUE) INDEXTYPE IS "XDB"."XMLINDEX" PARAMETERS ( 'XMLTable eval_idx_tab_I XMLNamespaces(''http://www.cigna.com/acme/domains/derived/fact/2010/03'' AS "ns7", DEFAULT ''http://www.cigna.com/acme/domains/eval/2010/03''), ''/eval'' COLUMNS eval_catt VARCHAR2(50) path ''@category'', derivedFact XMLTYPE path ''derivedFacts/ns7:derivedFact'' virtual XMLTable eval_idx_tab_II XMLNamespaces(''http://www.cigna.com/acme/domains/derived/fact/2010/03'' AS "ns7", DEFAULT ''http://www.cigna.com/acme/domains/eval/2010/03''), ''/ns7:derivedFact'' passing derivedFact COLUMNS defId VARCHAR2(100) path ''ns7:defId''' ); -
The slow queries with WITH and JOIN
Hello
This code takes too long to complete:
If I remove "WHERE Id_compteur = 4" on the last line, there is almost no difference in run time. Without this WHERE clause, it returns 1104 ranks in s 1.51, with her he returned 116 lines s 1.34.WITH rawData AS -- 563 rows in 0.07s OR 59 rows in 0.02s ( SELECT date_releve AS x1, index_corrige AS y1, LEAD(date_releve) OVER (PARTITION BY id_compteur ORDER BY date_releve) AS x2, LEAD(index_corrige) OVER (PARTITION BY id_compteur ORDER BY date_releve) AS y2, id AS id_releve, id_compteur FROM V_relevesCorriges ), meteoData AS -- 1082 rows in 1.34s OR 116 rows in 0.16s ( SELECT avg(meteo.valeur) AS meteoValue, x2 AS dateMeteo, id_variable, id_releve, id_compteur FROM meteo, rawData WHERE date_meteo <= x2 AND date_meteo > x1 GROUP BY id_releve, id_variable, x2, id_compteur ORDER BY x2 ), consoData AS -- 1104 rows in 1.43s, 117 rows in 0.2s ( SELECT to_char(x1, 'DD.MM.YYYY') || ' - ' || to_char(x2, 'DD.MM.YYYY') AS periode, meteoValue AS meteo_moyenne, (y2 - y1) / nullif((x2 - x1),0) AS conso_par_jour, (y2 - y1) AS conso, rawData.id_releve id_releve, meteoData.id_variable id_variable, meteoData.id_compteur id_compteur FROM rawData LEFT OUTER JOIN meteoData ON rawData.id_releve = meteoData.id_releve ORDER BY x2 ) SELECT periode, meteo_moyenne, conso_par_jour, consoData.id_variable id_variable, consoData.id_releve id_releve, id_compteur -- 1104 rows in 1.51s, 116 rows in 1.34s FROM consoData LEFT OUTER JOIN diagnostic2 ON consoData.id_releve = diagnostic2.id_releve AND consoData.id_variable = diagnostic2.id_variable WHERE Id_compteur = 4
I say it takes too long because when I put this WHERE 'consoData' clause (WHERE meteoData.consoData = 4), he returns to 0 116rows. 2 sec., to get the same output of data. If I remove the LEFT OUTER JOIN diagnosis2 (last but one line) there are also 0. 2 s.
I think that the solution would be to force "WHERE Id_compteur =... "to take effect before he joined the"diagnosis2"of the table, but do not know how to do.
The subquery takes a lot of time when to return all the lines is "meteoData.
This code is supposed to be a VIEW, so "WHERE Id_compteur =... ' will not be included in it but passed when you query the view. I tested it as a point of VIEW, same problem.
Explain the plan:
Oracle database version: 10.2.0.4.0, I'm accessing through the APEX version 4.1.1.00.23Plan hash value: 724835998 ----------------------------------------------------------------------------------------------------------------------- | Id | Operation | Name | Rows | Bytes |TempSpc| Cost (%CPU)| Time | ----------------------------------------------------------------------------------------------------------------------- | 0 | SELECT STATEMENT | | 16364 | 1342K| | 586 (4)| 00:00:08 | | 1 | TEMP TABLE TRANSFORMATION | | | | | | | | 2 | LOAD AS SELECT | DIAGNOSTIC2 | | | | | | | 3 | WINDOW SORT | | 563 | 15764 | | 12 (25)| 00:00:01 | | 4 | VIEW | V_RELEVESCORRIGES | 563 | 15764 | | 11 (19)| 00:00:01 | | 5 | SORT GROUP BY | | 563 | 56300 | | 11 (19)| 00:00:01 | | 6 | VIEW | | 563 | 56300 | | 10 (10)| 00:00:01 | |* 7 | HASH JOIN RIGHT OUTER | | 563 | 25335 | | 10 (10)| 00:00:01 | | 8 | TABLE ACCESS FULL | COMPTEURS | 22 | 132 | | 3 (0)| 00:00:01 | | 9 | VIEW | | 563 | 21957 | | 7 (15)| 00:00:01 | |* 10 | HASH JOIN OUTER | | 563 | 26461 | | 7 (15)| 00:00:01 | | 11 | TABLE ACCESS FULL | RELEVES | 563 | 12949 | | 3 (0)| 00:00:01 | | 12 | VIEW | V_CORRECTIONDATA | 563 | 13512 | | 3 (0)| 00:00:01 | |* 13 | VIEW | | 563 | 28150 | | 3 (0)| 00:00:01 | | 14 | WINDOW SORT | | 563 | 67560 | | 3 (0)| 00:00:01 | | 15 | VIEW | | 563 | 67560 | | 3 (0)| 00:00:01 | | 16 | NESTED LOOPS OUTER| | 563 | 14638 | | 3 (0)| 00:00:01 | | 17 | TABLE ACCESS FULL| RELEVES | 563 | 12949 | | 3 (0)| 00:00:01 | |* 18 | INDEX UNIQUE SCAN| COMPTEURS_PK | 1 | 3 | | 0 (0)| 00:00:01 | |* 19 | HASH JOIN RIGHT OUTER | | 16364 | 1342K| | 573 (4)| 00:00:07 | | 20 | INDEX FULL SCAN | DIAGNOSTIC2_PK | 4 | 24 | | 1 (0)| 00:00:01 | | 21 | VIEW | | 16364 | 1246K| | 572 (4)| 00:00:07 | | 22 | SORT ORDER BY | | 16364 | 1661K| 3864K| 572 (4)| 00:00:07 | |* 23 | HASH JOIN | | 16364 | 1661K| | 179 (9)| 00:00:03 | | 24 | VIEW | | 1157 | 55536 | | 3 (0)| 00:00:01 | | 25 | TABLE ACCESS FULL | SYS_TEMP_0FD9D6657_90A96D1D | 1157 | 55536 | | 3 (0)| 00:00:01 | |* 26 | VIEW | | 7963 | 435K| | 175 (8)| 00:00:03 | | 27 | SORT GROUP BY | | 7963 | 311K| 1768K| 175 (8)| 00:00:03 | | 28 | MERGE JOIN | | 26409 | 1031K| | 23 (48)| 00:00:01 | | 29 | SORT JOIN | | 1157 | 28925 | | 4 (25)| 00:00:01 | | 30 | VIEW | | 1157 | 28925 | | 3 (0)| 00:00:01 | | 31 | TABLE ACCESS FULL | SYS_TEMP_0FD9D6657_90A96D1D | 1157 | 55536 | | 3 (0)| 00:00:01 | |* 32 | FILTER | | | | | | | |* 33 | SORT JOIN | | 9130 | 133K| | 11 (19)| 00:00:01 | | 34 | TABLE ACCESS FULL | METEO | 9130 | 133K| | 9 (0)| 00:00:01 | ----------------------------------------------------------------------------------------------------------------------- Predicate Information (identified by operation id): --------------------------------------------------- 7 - access("RELEVES"."ID_COMPTEUR"="COMPTEURS"."ID"(+)) 10 - access("RELEVES"."ID_COMPTEUR"="V_CORRECTIONDATA"."ID_COMPTEUR"(+)) filter("RELEVES"."DATE_RELEVE">="V_CORRECTIONDATA"."DATE_CHANGEMENT"(+)) 13 - filter("CHG_COMPTEUR"=1 AND "ID_COMPTEUR"="ID_COMPTEUR_CORR") 18 - access("RELEVES"."ID_COMPTEUR"="COMPTEURS"."ID"(+)) 19 - access("CONSODATA"."ID_VARIABLE"="DIAGNOSTIC2"."ID_VARIABLE"(+) AND "CONSODATA"."ID_RELEVE"="DIAGNOSTIC2"."ID_RELEVE"(+)) 23 - access("RAWDATA"."ID_RELEVE"="METEODATA"."ID_RELEVE") 26 - filter("METEODATA"."ID_COMPTEUR"=4) 32 - filter("DATE_METEO">"X1") 33 - access(INTERNAL_FUNCTION("DATE_METEO")<=INTERNAL_FUNCTION("X2")) filter(INTERNAL_FUNCTION("DATE_METEO")<=INTERNAL_FUNCTION("X2"))
I hope that my question is not too blurred...Ah, sorry, I missed that bit in your original post. I had a similar problem where I was adamant that the predicate must be pushed into the view (despite the use of analytical functions - they used the conditions that would allow the predicate be pushed): http://www.orchestrapit.co.uk/?p=55
In the end, I solved my problem by using joins to inline, rather than the subquery factoring - maybe you can try to convert your view online views and see if that helps?
-
[8i] need help with SLOW queries
First of all, I work in 8i.
Some examples of data:
First of all, if I run-- this table actually has ~175 cols and ~40K rows CREATE TABLE PART_1 ( part_nbr CHAR(25) NOT NULL , lead_time NUMBER(3) ); INSERT INTO PART_1 VALUES ('ABC-100',2); INSERT INTO PART_1 VALUES ('ABC-105G',4); INSERT INTO PART_1 VALUES ('11-205-32',6); INSERT INTO PART_1 VALUES ('RMS1109',8); INSERT INTO PART_1 VALUES ('ABC-1',10); -- this table actually has ~40 cols and ~700K rows (SELECT COUNT(*) FROM REQS takes a good 30 sec to a min to run) CREATE TABLE REQS_1 ( comp_part_nbr CHAR(25) , ord_nbr CHAR(10) , sub_nbr CHAR(3) , qty_reqd NUMBER(13,4) , qty_issued NUMBER(13,4) , date_reqd DATE ); INSERT INTO REQS_1 VALUES ('ABC-100','0000000110','001',10,0,TO_DATE('08/24/2010','mm/dd/yyyy')); INSERT INTO REQS_1 VALUES ('ABC-100','0000000200','001',10,0,TO_DATE('08/31/2010','mm/dd/yyyy')); INSERT INTO REQS_1 VALUES ('ABC-105G','0000000110','001',5,0,TO_DATE('08/24/2010','mm/dd/yyyy')); INSERT INTO REQS_1 VALUES ('ABC-105G','0000000200','001',5,0,TO_DATE('08/31/2010','mm/dd/yyyy')); INSERT INTO REQS_1 VALUES ('11-205-32','0000000110','001',10,0,TO_DATE('08/24/2010','mm/dd/yyyy')); INSERT INTO REQS_1 VALUES ('11-205-32','0000000200','001',10,0,TO_DATE('08/31/2010','mm/dd/yyyy')); INSERT INTO REQS_1 VALUES ('RMS1109','0000000110','001',30,0,TO_DATE('08/24/2010','mm/dd/yyyy')); INSERT INTO REQS_1 VALUES ('RMS1109','0000000200','001',30,0,TO_DATE('08/31/2010','mm/dd/yyyy')); INSERT INTO REQS_1 VALUES ('ABC-1','S000000025','001',1,0,TO_DATE('09/09/2010','mm/dd/yyyy')); INSERT INTO REQS_1 VALUES ('ABC-1','S000000025','002',1,0,TO_DATE('09/16/2010','mm/dd/yyyy')); -- these are all the columns in the table, though there are many more rows CREATE TABLE CALT ( clndr_dt DATE NOT NULL , clndr_yr NUMBER(4) , work_day NUMBER(3) , work_dt DATE , work_wk NUMBER(2) , work_yr NUMBER(4) , work_days NUMBER(5) , clndr_days NUMBER(6) ); INSERT INTO CALT VALUES (TO_DATE('08/01/2010','mm/dd/yyyy'),2010,0, TO_DATE('07/30/2010','mm/dd/yyyy'),31,2010,1729,5121); INSERT INTO CALT VALUES (TO_DATE('08/02/2010','mm/dd/yyyy'),2010,149, TO_DATE('08/02/2010','mm/dd/yyyy'),31,2010,1730,5122); INSERT INTO CALT VALUES (TO_DATE('08/03/2010','mm/dd/yyyy'),2010,150, TO_DATE('08/03/2010','mm/dd/yyyy'),31,2010,1731,5123); INSERT INTO CALT VALUES (TO_DATE('08/04/2010','mm/dd/yyyy'),2010,151, TO_DATE('08/04/2010','mm/dd/yyyy'),31,2010,1732,5124); INSERT INTO CALT VALUES (TO_DATE('08/05/2010','mm/dd/yyyy'),2010,152, TO_DATE('08/05/2010','mm/dd/yyyy'),31,2010,1733,5125); INSERT INTO CALT VALUES (TO_DATE('08/06/2010','mm/dd/yyyy'),2010,153, TO_DATE('08/06/2010','mm/dd/yyyy'),31,2010,1734,5126); INSERT INTO CALT VALUES (TO_DATE('08/07/2010','mm/dd/yyyy'),2010,0, TO_DATE('08/06/2010','mm/dd/yyyy'),31,2010,1734,5127); INSERT INTO CALT VALUES (TO_DATE('08/08/2010','mm/dd/yyyy'),2010,0, TO_DATE('08/06/2010','mm/dd/yyyy'),32,2010,1734,5128); INSERT INTO CALT VALUES (TO_DATE('08/09/2010','mm/dd/yyyy'),2010,154, TO_DATE('08/09/2010','mm/dd/yyyy'),32,2010,1735,5129); INSERT INTO CALT VALUES (TO_DATE('08/10/2010','mm/dd/yyyy'),2010,155, TO_DATE('08/10/2010','mm/dd/yyyy'),32,2010,1736,5130); INSERT INTO CALT VALUES (TO_DATE('08/11/2010','mm/dd/yyyy'),2010,156, TO_DATE('08/11/2010','mm/dd/yyyy'),32,2010,1737,5131); INSERT INTO CALT VALUES (TO_DATE('08/12/2010','mm/dd/yyyy'),2010,157, TO_DATE('08/12/2010','mm/dd/yyyy'),32,2010,1738,5132); INSERT INTO CALT VALUES (TO_DATE('08/13/2010','mm/dd/yyyy'),2010,158, TO_DATE('08/13/2010','mm/dd/yyyy'),32,2010,1739,5133); INSERT INTO CALT VALUES (TO_DATE('08/14/2010','mm/dd/yyyy'),2010,0, TO_DATE('08/13/2010','mm/dd/yyyy'),32,2010,1739,5134); INSERT INTO CALT VALUES (TO_DATE('08/15/2010','mm/dd/yyyy'),2010,0, TO_DATE('08/13/2010','mm/dd/yyyy'),33,2010,1739,5135); INSERT INTO CALT VALUES (TO_DATE('08/16/2010','mm/dd/yyyy'),2010,159, TO_DATE('08/16/2010','mm/dd/yyyy'),33,2010,1740,5136); INSERT INTO CALT VALUES (TO_DATE('08/17/2010','mm/dd/yyyy'),2010,160, TO_DATE('08/17/2010','mm/dd/yyyy'),33,2010,1741,5137); INSERT INTO CALT VALUES (TO_DATE('08/18/2010','mm/dd/yyyy'),2010,161, TO_DATE('08/18/2010','mm/dd/yyyy'),33,2010,1742,5138); INSERT INTO CALT VALUES (TO_DATE('08/19/2010','mm/dd/yyyy'),2010,162, TO_DATE('08/19/2010','mm/dd/yyyy'),33,2010,1743,5139); INSERT INTO CALT VALUES (TO_DATE('08/20/2010','mm/dd/yyyy'),2010,163, TO_DATE('08/20/2010','mm/dd/yyyy'),33,2010,1744,5140); INSERT INTO CALT VALUES (TO_DATE('08/21/2010','mm/dd/yyyy'),2010,0, TO_DATE('08/20/2010','mm/dd/yyyy'),33,2010,1744,5141); INSERT INTO CALT VALUES (TO_DATE('08/22/2010','mm/dd/yyyy'),2010,0, TO_DATE('08/20/2010','mm/dd/yyyy'),34,2010,1744,5142); INSERT INTO CALT VALUES (TO_DATE('08/23/2010','mm/dd/yyyy'),2010,164, TO_DATE('08/23/2010','mm/dd/yyyy'),34,2010,1745,5143); INSERT INTO CALT VALUES (TO_DATE('08/24/2010','mm/dd/yyyy'),2010,165, TO_DATE('08/24/2010','mm/dd/yyyy'),34,2010,1746,5144); INSERT INTO CALT VALUES (TO_DATE('08/25/2010','mm/dd/yyyy'),2010,166, TO_DATE('08/25/2010','mm/dd/yyyy'),34,2010,1747,5145); INSERT INTO CALT VALUES (TO_DATE('08/26/2010','mm/dd/yyyy'),2010,167, TO_DATE('08/26/2010','mm/dd/yyyy'),34,2010,1748,5146); INSERT INTO CALT VALUES (TO_DATE('08/27/2010','mm/dd/yyyy'),2010,168, TO_DATE('08/27/2010','mm/dd/yyyy'),34,2010,1749,5147); INSERT INTO CALT VALUES (TO_DATE('08/28/2010','mm/dd/yyyy'),2010,0, TO_DATE('08/27/2010','mm/dd/yyyy'),34,2010,1749,5148); INSERT INTO CALT VALUES (TO_DATE('08/29/2010','mm/dd/yyyy'),2010,0, TO_DATE('08/27/2010','mm/dd/yyyy'),35,2010,1749,5149); INSERT INTO CALT VALUES (TO_DATE('08/30/2010','mm/dd/yyyy'),2010,169, TO_DATE('08/30/2010','mm/dd/yyyy'),35,2010,1750,5150); INSERT INTO CALT VALUES (TO_DATE('08/31/2010','mm/dd/yyyy'),2010,170, TO_DATE('08/31/2010','mm/dd/yyyy'),35,2010,1751,5151); INSERT INTO CALT VALUES (TO_DATE('09/01/2010','mm/dd/yyyy'),2010,171, TO_DATE('09/01/2010','mm/dd/yyyy'),35,2010,1752,5152); INSERT INTO CALT VALUES (TO_DATE('09/02/2010','mm/dd/yyyy'),2010,172, TO_DATE('09/02/2010','mm/dd/yyyy'),35,2010,1753,5153); INSERT INTO CALT VALUES (TO_DATE('09/03/2010','mm/dd/yyyy'),2010,173, TO_DATE('09/03/2010','mm/dd/yyyy'),35,2010,1754,5154); INSERT INTO CALT VALUES (TO_DATE('09/04/2010','mm/dd/yyyy'),2010,0, TO_DATE('09/03/2010','mm/dd/yyyy'),35,2010,1754,5155); INSERT INTO CALT VALUES (TO_DATE('09/05/2010','mm/dd/yyyy'),2010,0, TO_DATE('09/03/2010','mm/dd/yyyy'),36,2010,1754,5156); INSERT INTO CALT VALUES (TO_DATE('09/06/2010','mm/dd/yyyy'),2010,0, TO_DATE('09/03/2010','mm/dd/yyyy'),36,2010,1754,5157); INSERT INTO CALT VALUES (TO_DATE('09/07/2010','mm/dd/yyyy'),2010,174, TO_DATE('09/07/2010','mm/dd/yyyy'),36,2010,1755,5158); INSERT INTO CALT VALUES (TO_DATE('09/08/2010','mm/dd/yyyy'),2010,175, TO_DATE('09/08/2010','mm/dd/yyyy'),36,2010,1756,5159); INSERT INTO CALT VALUES (TO_DATE('09/09/2010','mm/dd/yyyy'),2010,176, TO_DATE('09/09/2010','mm/dd/yyyy'),36,2010,1757,5160); INSERT INTO CALT VALUES (TO_DATE('09/10/2010','mm/dd/yyyy'),2010,177, TO_DATE('09/10/2010','mm/dd/yyyy'),36,2010,1758,5161); INSERT INTO CALT VALUES (TO_DATE('09/11/2010','mm/dd/yyyy'),2010,0, TO_DATE('09/10/2010','mm/dd/yyyy'),36,2010,1758,5162); INSERT INTO CALT VALUES (TO_DATE('09/12/2010','mm/dd/yyyy'),2010,0, TO_DATE('09/10/2010','mm/dd/yyyy'),37,2010,1758,5163); INSERT INTO CALT VALUES (TO_DATE('09/13/2010','mm/dd/yyyy'),2010,178, TO_DATE('09/13/2010','mm/dd/yyyy'),37,2010,1759,5164); INSERT INTO CALT VALUES (TO_DATE('09/14/2010','mm/dd/yyyy'),2010,179, TO_DATE('09/14/2010','mm/dd/yyyy'),37,2010,1760,5165); INSERT INTO CALT VALUES (TO_DATE('09/15/2010','mm/dd/yyyy'),2010,180, TO_DATE('09/15/2010','mm/dd/yyyy'),37,2010,1761,5166); INSERT INTO CALT VALUES (TO_DATE('09/16/2010','mm/dd/yyyy'),2010,181, TO_DATE('09/16/2010','mm/dd/yyyy'),37,2010,1762,5167); INSERT INTO CALT VALUES (TO_DATE('09/17/2010','mm/dd/yyyy'),2010,182, TO_DATE('09/17/2010','mm/dd/yyyy'),37,2010,1763,5168); INSERT INTO CALT VALUES (TO_DATE('09/18/2010','mm/dd/yyyy'),2010,0, TO_DATE('09/17/2010','mm/dd/yyyy'),37,2010,1763,5169); INSERT INTO CALT VALUES (TO_DATE('09/19/2010','mm/dd/yyyy'),2010,0, TO_DATE('09/17/2010','mm/dd/yyyy'),38,2010,1763,5170); INSERT INTO CALT VALUES (TO_DATE('09/20/2010','mm/dd/yyyy'),2010,183, TO_DATE('09/20/2010','mm/dd/yyyy'),38,2010,1764,5171); INSERT INTO CALT VALUES (TO_DATE('09/21/2010','mm/dd/yyyy'),2010,184, TO_DATE('09/21/2010','mm/dd/yyyy'),38,2010,1765,5172); INSERT INTO CALT VALUES (TO_DATE('09/22/2010','mm/dd/yyyy'),2010,185, TO_DATE('09/22/2010','mm/dd/yyyy'),38,2010,1766,5173); INSERT INTO CALT VALUES (TO_DATE('09/23/2010','mm/dd/yyyy'),2010,186, TO_DATE('09/23/2010','mm/dd/yyyy'),38,2010,1767,5174); INSERT INTO CALT VALUES (TO_DATE('09/24/2010','mm/dd/yyyy'),2010,187, TO_DATE('09/24/2010','mm/dd/yyyy'),38,2010,1768,5175); INSERT INTO CALT VALUES (TO_DATE('09/25/2010','mm/dd/yyyy'),2010,0, TO_DATE('09/24/2010','mm/dd/yyyy'),38,2010,1768,5176); INSERT INTO CALT VALUES (TO_DATE('09/26/2010','mm/dd/yyyy'),2010,0, TO_DATE('09/24/2010','mm/dd/yyyy'),39,2010,1768,5177); INSERT INTO CALT VALUES (TO_DATE('09/27/2010','mm/dd/yyyy'),2010,188, TO_DATE('09/27/2010','mm/dd/yyyy'),39,2010,1769,5178); INSERT INTO CALT VALUES (TO_DATE('09/28/2010','mm/dd/yyyy'),2010,189, TO_DATE('09/28/2010','mm/dd/yyyy'),39,2010,1770,5179); INSERT INTO CALT VALUES (TO_DATE('09/29/2010','mm/dd/yyyy'),2010,190, TO_DATE('09/29/2010','mm/dd/yyyy'),39,2010,1771,5180); INSERT INTO CALT VALUES (TO_DATE('09/30/2010','mm/dd/yyyy'),2010,191, TO_DATE('09/30/2010','mm/dd/yyyy'),39,2010,1772,5181);
against my real data, I get:DEFINE days_out = 10 SELECT p.part_nbr , p.lead_time , r.date_reqd , c2.clndr_dt AS order_by FROM REQS_1 r , PART_1 p , CALT c , CALT c2 WHERE p.part_nbr = r.comp_part_nbr AND TRUNC(r.date_reqd) = TRUNC(c.clndr_dt) AND c2.work_days = c.work_days - p.lead_time AND c2.work_day <> 0 -- AND c2.clndr_dt <= SYSDATE + &days_out
The problem is that if I have a comment on the last line of the query, it is not essentially executed. With my complete query, I got "no more room in the temp space" errors of type, or it takes hours to run. My big problem is that I can't get just the plan of the explain output for the query (with this last line is not commented out). So I am successfully able to display a map to explain, I have just set autotrace on, which means that the query should work first before I get the plan of the explain command. This does not work so well when the query takes hours to run (or not at all)...117969 rows selected. Execution Plan ---------------------------------------------------------- 0 SELECT STATEMENT Optimizer=RULE 1 0 NESTED LOOPS 2 1 NESTED LOOPS 3 2 MERGE JOIN 4 3 SORT (JOIN) 5 4 TABLE ACCESS (FULL) OF 'CALT' 6 3 SORT (JOIN) 7 6 TABLE ACCESS (FULL) OF 'REQS_1' 8 2 TABLE ACCESS (BY INDEX ROWID) OF 'PART_1' 9 8 INDEX (RANGE SCAN) OF 'PART_1_PK' (UNIQUE) 10 1 TABLE ACCESS (BY INDEX ROWID) OF 'CALT' 11 10 INDEX (RANGE SCAN) OF 'CALT_IX4' (NON-UNIQUE) Statistics ---------------------------------------------------------- 0 recursive calls 323 db block gets 997239 consistent gets 34095 physical reads 0 redo size 9858097 bytes sent via SQL*Net to client 550791 bytes received via SQL*Net from client 7866 SQL*Net roundtrips to/from client 0 sorts (memory) 2 sorts (disk) 117969 rows processed timing for: query_timer Elapsed: 00:00:58.69
Anyone have any suggestions for me?If the test data really resembles your production data then you don't need the TRUNC around comparison of date column. However if this is not the case, then you can add an index of feature based on TRUNC (r.date_reqd). And check if that helps avoid the merge join.
Second thing, I don't really understand is why you must join the CSPA table twice? What logical reason (business) is behind all this?
-
Very slow queries when connecting through the listener in Oracle 10.2.0.4
Hello
I have a database 10g with a small table (2 columns, 9 lines).
When I connect to the db through the listener (sqlplus system/manager@SID) and run this query: select * table, the run time is approximately 500ms
When I connect to the db, giving the ORACLE_SID SID (export ORACLE_SID = SID; sqlplus system/manager) and run the same query, it is 10 x faster...
The listener is: TNSLSNR for Solaris: release 10.2.0.4.0 - Production
Is the database: Oracle Database 10g Enterprise Edition Release 10.2.0.4.0 - Production 64-bit
Any ideas?
Thank you... (I'm a newbie in oracle and English... so I apologize in advance)
Edited by: user1248176 APR 12. 2010 22:50steve80lyon wrote:
If this problem a network, then please note that I run the client and the server db on the same machine... a sun fire v240 and I'm alone on this server.I also tried it on another computer, run the client on the same machine as the server... It's the same question.
I am lost... I ran the client that connects to a Database 9i (the same structure but the data of the elder) I have a time to ' correct '...
Edited by: steve80lyon Apr 13. 2010 08:11
The request may not be leaving the machine, but it is still going through the network TCP stack. You have the gun of smoking showing exactly where the extra time is coming. Should it take that long? I don't know, but it seems to me that calculation adds up correctly to account for the difference between the tcp protocol and legacy connections.
-
Hi all
I'm sitting on 10.2.0.4.0 on GNU / linux. I have a complain people on demand, slow queries, he works long enough. I extracted the explain plan command and events waiting for the sessions and system and found commulative db file sequenciial read caused us awaits more. the same query worked fine a day before. not sure where the focus?
++ Query ++

SELECT A.ITEM, A.LOC, MAX(CO1.AFFBILLPR) AFFBILLPR, MAX(CO1.UNIT_COST) UNIT_COST FROM INVOPT_STG.TMP_COST_OCS CO1,
(SELECT SS.LOC, SS.MANUF_LOC, SS.ITEM, MAX(CO.ITEM_10D) ITEM_10D, COUNTRY_CD FROM INVOPT_STG.STG_LOC SL, TMP_COST_OCS CO, STG_SKU SS WHERE
CASE WHEN SL.COUNTRY_CD_COST = CO.COUNTRY_CD THEN SL.COUNTRY_CD_COST
WHEN SL.COUNTRY_CD_COST != NVL((SELECT DISTINCT CO3.COUNTRY_CD FROM INVOPT_STG.TMP_COST_OCS
CO3 WHERE CO3.ITEM_10D = CO.ITEM_10D AND CO3.FYEAR = CO.FYEAR AND CO3.COUNTRY_CD = SL.COUNTRY_CD_COST),' ')
AND SL.COUNTRY_CD_COST= 'US' THEN 'CAN' WHEN SL.COUNTRY_CD_COST != NVL((SELECT DISTINCT CO3.COUNTRY_CD
FROM INVOPT_STG.TMP_COST_OCS CO3 WHERE CO3.ITEM_10D = CO.
ITEM_10D AND CO3.FYEAR = CO.FYEAR AND CO3.COUNTRY_CD = SL.COUNTRY_CD_COST),' ')
AND SL.COUNTRY_CD_COST = 'CAN' THEN 'US' ELSE SL.COUNTRY_CD_COST END = CO.COUNTRY_CD AND CO.COST_TYPE IN ('F') AND CO.ITEM_10D !=
SS.ITEM_10D AND CO.ITEM_10D < SS.ITEM_10D AND
SUBSTR(CO.ITEM_10D,1,9) = SUBSTR(SS.ITEM_10D,1,9)
AND SUBSTR(SL.LOC,1,3) = SS.MANUF_LOC GROUP BY SS.LOC, SS.MANUF_LOC, SS.ITEM,
CO.COUNTRY_CD) A WHERE CO1.ITEM_10D = A.ITEM_10D AND CO1.FYEAR =
(SELECT MAX(CO2.FYEAR) FROM INVOPT_STG.TMP_COST_OCS CO2 WHERE CO2.ITEM_10D
= A.ITEM_10D AND CO2.COST_TYPE = 'F' AND CO2.COUNTRY_CD = A.COUNTRY_CD)
AND CO1.COST_TYPE = 'F' AND CO1.COUNTRY_CD = A.COUNTRY_CD GROUP BY A.ITEM, A.LOC
------ Eplain plan generated from shared pool +++++++++++ --------------------------------------------------------------------------------------------------------------- | Id | Operation | Name | E-Rows | OMem | 1Mem | Used-Mem | Used-Tmp| --------------------------------------------------------------------------------------------------------------- | 1 | HASH GROUP BY | | 1 | 11M| 2139K| 3095K (1)| 8192 | |* 2 | FILTER | | | | | | | |* 3 | TABLE ACCESS BY INDEX ROWID | TMP_COST_OCS | 1 | | | | | | 4 | NESTED LOOPS | | 1 | | | | | | 5 | VIEW | | 1 | | | | | | 6 | HASH GROUP BY | | 1 | 22M| 4334K| 3898K (1)| 17408 | |* 7 | FILTER | | | | | | | |* 8 | TABLE ACCESS BY INDEX ROWID | TMP_COST_OCS | 1 | | | | | | 9 | NESTED LOOPS | | 1 | | | | | |* 10 | HASH JOIN | | 1 | 1179K| 1179K| 1210K (0)| | | 11 | TABLE ACCESS FULL | STG_LOC | 155 | | | | | | 12 | TABLE ACCESS FULL | STG_SKU | 1738K| | | | | |* 13 | INDEX RANGE SCAN | TMP_COST_OCS_01 | 1 | | | | | | 14 | SORT UNIQUE NOSORT | | 1 | | | | | |* 15 | TABLE ACCESS BY INDEX ROWID | TMP_COST_OCS | 1 | | | | | |* 16 | INDEX RANGE SCAN | TMP_COST_OCS_01 | 3 | | | | | | 17 | SORT UNIQUE NOSORT | | 1 | | | | | |* 18 | TABLE ACCESS BY INDEX ROWID| TMP_COST_OCS | 1 | | | | | |* 19 | INDEX RANGE SCAN | TMP_COST_OCS_01 | 3 | | | | | |* 20 | INDEX RANGE SCAN | TMP_COST_OCS_01 | 3 | | | | | | 21 | SORT AGGREGATE | | 1 | | | | | |* 22 | TABLE ACCESS BY INDEX ROWID | TMP_COST_OCS | 1 | | | | | |* 23 | INDEX RANGE SCAN | TMP_COST_OCS_01 | 3 | | | | | --------------------------------------------------------------------------------------------------------------- Predicate Information (identified by operation id): --------------------------------------------------- 2 - filter("CO1"."FYEAR"=) 3 - filter(("CO1"."COST_TYPE"='F' AND "CO1"."COUNTRY_CD"="A"."COUNTRY_CD")) 7 - filter("CO"."COUNTRY_CD"=CASE WHEN ("SL"."COUNTRY_CD_COST"="CO"."COUNTRY_CD") THEN "SL"."COUNTRY_CD_COST" WHEN (("SL"."COUNTRY_CD_COST"<>NVL(,' ')) AND ("SL"."COUNTRY_CD_COST"='US')) THEN 'CAN' WHEN (("SL"."COUNTRY_CD_COST"<>NVL(,' ')) AND ("SL"."COUNTRY_CD_COST"='CAN')) THEN 'US' ELSE "SL"."COUNTRY_CD_COST" END ) 8 - filter("CO"."COST_TYPE"='F') 10 - access("SS"."MANUF_LOC"=SUBSTR("SL"."LOC",1,3)) 13 - access("CO"."ITEM_10D"<"SS"."ITEM_10D") filter(("CO"."ITEM_10D"<>"SS"."ITEM_10D" AND SUBSTR("CO"."ITEM_10D",1,9)=SUBSTR("SS"."ITEM_10D",1,9))) 15 - filter(("CO3"."COUNTRY_CD"=:B1 AND "CO3"."FYEAR"=:B2)) 16 - access("CO3"."ITEM_10D"=:B1) 18 - filter(("CO3"."COUNTRY_CD"=:B1 AND "CO3"."FYEAR"=:B2)) 19 - access("CO3"."ITEM_10D"=:B1) 20 - access("CO1"."ITEM_10D"="A"."ITEM_10D") 22 - filter(("CO2"."COUNTRY_CD"=:B1 AND "CO2"."COST_TYPE"='F')) 23 - access("CO2"."ITEM_10D"=:B1) Note ----- - Warning: basic plan statistics not available. These are only collected when: * hint 'gather_plan_statistics' is used for the statement or * parameter 'statistics_level' is set to 'ALL', at session or system level+++++ System Waits ++++++++ EVENT TOTAL_WAITS TIME_WAITED AVERAGE_WAIT ---------------------------------------------------------------- ----------- ----------- ------------ db file sequential read 11887758 3643542 .31 jobq slave wait 4434 1297399 292.6 db file scattered read 3821415 615568 .16 log file parallel write 778118 476860 .61 db file parallel write 652969 456530 .7 SQL*Net more data to client 93400714 364435 0 PX Idle Wait 1078 208509 193.42 control file parallel write 141212 62082 .44 log file switch (checkpoint incomplete) 323 22567 69.87 log buffer space 786 10051 12.79 log file sync 17816 7988 .45 db file single write 42869 5994 .14 read by other session 13713 5051 .37 log file switch completion 1125 4963 4.41 db file parallel read 756 3951 5.23 Data file init write 18444 3569 .19 cursor: pin S wait on X 3280 3409 1.04 os thread startup 452 2250 4.98 direct path read 4438445 1629 0 SQL*Net more data from client 73118 1613 .02 control file sequential read 291106 1523 .01 local write wait 4707 1169 .25 latch: shared pool 166 954 5.75 direct path read temp 4657234 921 0 library cache load lock 313 753 2.41 enq: KO - fast object checkpoint 5286 734 .14 PL/SQL lock timer 7 682 97.43 latch: library cache 501 614 1.23
Published by: user11983993 on May 18, 2012 11:12+++ commulative events for session +++ EVENT TOTAL_WAITS TIME_WAITED AVERAGE_WAIT ---------------------------------------------------------------- ----------- ----------- ------------ db file sequential read 6224 1978 .32 SQL*Net message from client 20 2 .09 SQL*Net message to client 20 0 0 log file sync 1 0 .17Hello
(1) http://docs.oracle.com/cd/B19306_01/appdev.102/b14258/d_stats.htm#i1046561
(2) if there was no FBI created, then most likely the plan slipped by accident. For example, a histogram obtained collected which biased the estimation of cardinality closer to the correct value. The important thing is that, unless you have an FBI (or extended his stats, but to do this, you must be on 11g or higher) you can not count on the coming optimizer with a reasonable plan for queries involving joins
(3) If you are unable to re - create the problem, you can use 10053 event tracing to see the origin of the error in the selectivity of the join of and that fixed it. If you are not sure of how to interpret a 10053 trace file, you can export a test case and post it here (or by mail to me).Best regards
Nikolai -
Slow index by using the query. Fast with full table Scan.
Salvation;
(Thanks for the links)
Here's my question correctly formatted.
The query:
Works on 32 seconds!SELECT count(1) from ehgeoconstru ec where ec.TYPE='BAR' AND ( ec.birthDate <= TO_DATE('2009-10-06 11:52:12', 'YYYY-MM-DD HH24:MI:SS') ) and deathdate is null and substr(ec.strgfd, 1, length('[CIMText')) <> '[CIMText'
Same query, but with an extra where clause:
This is 400 seconds.SELECT count(1) from ehgeoconstru ec where ec.TYPE='BAR' and ( (ec.contextVersion = 'REALWORLD') --- ADDED HERE AND ( ec.birthDate <= TO_DATE('2009-10-06 11:52:12', 'YYYY-MM-DD HH24:MI:SS') ) ) and deathdate is null and substr(ec.strgfd, 1, length('[CIMText')) <> '[CIMText'
It should return data from a table, given the conditions.
The database version is Oracle9i Release 9.2.0.7.0
These are the parameters relevant for the optimizer:
Here is the output of the PLAN to EXPLAIN for the first quick query:SQL> show parameter optimizer NAME TYPE VALUE ------------------------------------ ----------- ------------------------------ optimizer_dynamic_sampling integer 1 optimizer_features_enable string 9.2.0 optimizer_index_caching integer 99 optimizer_index_cost_adj integer 10 optimizer_max_permutations integer 2000 optimizer_mode string CHOOSE SQL>
Here is the output of the EXPLAIN of PLAN for slow queries:PLAN_TABLE_OUTPUT -------------------------------------------------------------------------------- -------------------------------------------------------------------------------- | Id | Operation | Name | Rows | Bytes | Cost | -------------------------------------------------------------------------------- | 0 | SELECT STATEMENT | | | | | | 1 | SORT AGGREGATE | | | | | |* 2 | TABLE ACCESS FULL | EHCONS | | | | -------------------------------------------------------------------------------- Predicate Information (identified by operation id): --------------------------------------------------- PLAN_TABLE_OUTPUT -------------------------------------------------------------------------------- 2 - filter(SUBSTR("EC"."strgfd",1,8)<>'[CIMText' AND "EC"."DEATHDATE" IS NULL AND "EC"."BIRTHDATE"<=TO_DATE('2009-10-06 11:52:12', 'yyyy -mm-dd hh24:mi:ss') AND "EC"."TYPE"='BAR') Note: rule based optimization
The TKPROF output for this slow statement is:PLAN_TABLE_OUTPUT -------------------------------------------------------------------------------- | | | 1 | SORT AGGREGATE | | | | | |* 2 | TABLE ACCESS BY INDEX ROWID| ehgeoconstru | | | | |* 3 | INDEX RANGE SCAN | ehgeoconstru_VSN | | | | PLAN_TABLE_OUTPUT -------------------------------------------------------------------------------- Predicate Information (identified by operation id): --------------------------------------------------- 2 - filter(SUBSTR("EC"."strgfd",1,8)<>'[CIMText' AND "EC"."DEATHDATE" IS NULL AND "EC"."TYPE"='BAR') PLAN_TABLE_OUTPUT -------------------------------------------------------------------------------- 3 - access("EC"."CONTEXTVERSION"='REALWORLD' AND "EC"."BIRTHDATE"<=TO_DATE('2 009-10-06 11:52:12', 'yyyy-mm-dd hh24:mi:ss')) filter("EC"."BIRTHDATE"<=TO_DATE('2009-10-06 11:52:12', 'yyyy-mm-dd hh24: mi:ss')) Note: rule based optimization
Published by: PauloSMO on November 17, 2009 04:21TKPROF: Release 9.2.0.7.0 - Production on Tue Nov 17 14:46:32 2009 Copyright (c) 1982, 2002, Oracle Corporation. All rights reserved. Trace file: gen_ora_3120.trc Sort options: prsela exeela fchela ******************************************************************************** count = number of times OCI procedure was executed cpu = cpu time in seconds executing elapsed = elapsed time in seconds executing disk = number of physical reads of buffers from disk query = number of buffers gotten for consistent read current = number of buffers gotten in current mode (usually for update) rows = number of rows processed by the fetch or execute call ******************************************************************************** SELECT count(1) from ehgeoconstru ec where ec.TYPE='BAR' and ( (ec.contextVersion = 'REALWORLD') AND ( ec.birthDate <= TO_DATE('2009-10-06 11:52:12', 'YYYY-MM-DD HH24:MI:SS') ) ) and deathdate is null and substr(ec.strgfd, 1, length('[CIMText')) <> '[CIMText' call count cpu elapsed disk query current rows ------- ------ -------- ---------- ---------- ---------- ---------- ---------- Parse 1 0.00 0.00 0 0 0 0 Execute 1 0.00 0.00 0 0 0 0 Fetch 2 0.00 538.12 162221 1355323 0 1 ------- ------ -------- ---------- ---------- ---------- ---------- ---------- total 4 0.00 538.12 162221 1355323 0 1 Misses in library cache during parse: 0 Optimizer goal: CHOOSE Parsing user id: 153 Rows Row Source Operation ------- --------------------------------------------------- 1 SORT AGGREGATE 27747 TABLE ACCESS BY INDEX ROWID OBJ#(73959) 2134955 INDEX RANGE SCAN OBJ#(73962) (object id 73962) ******************************************************************************** alter session set sql_trace=true call count cpu elapsed disk query current rows ------- ------ -------- ---------- ---------- ---------- ---------- ---------- Parse 0 0.00 0.00 0 0 0 0 Execute 1 0.00 0.02 0 0 0 0 Fetch 0 0.00 0.00 0 0 0 0 ------- ------ -------- ---------- ---------- ---------- ---------- ---------- total 1 0.00 0.02 0 0 0 0 Misses in library cache during parse: 0 Misses in library cache during execute: 1 Optimizer goal: CHOOSE Parsing user id: 153 ******************************************************************************** OVERALL TOTALS FOR ALL NON-RECURSIVE STATEMENTS call count cpu elapsed disk query current rows ------- ------ -------- ---------- ---------- ---------- ---------- ---------- Parse 1 0.00 0.00 0 0 0 0 Execute 2 0.00 0.02 0 0 0 0 Fetch 2 0.00 538.12 162221 1355323 0 1 ------- ------ -------- ---------- ---------- ---------- ---------- ---------- total 5 0.00 538.15 162221 1355323 0 1 Misses in library cache during parse: 0 Misses in library cache during execute: 1 OVERALL TOTALS FOR ALL RECURSIVE STATEMENTS call count cpu elapsed disk query current rows ------- ------ -------- ---------- ---------- ---------- ---------- ---------- Parse 0 0.00 0.00 0 0 0 0 Execute 0 0.00 0.00 0 0 0 0 Fetch 0 0.00 0.00 0 0 0 0 ------- ------ -------- ---------- ---------- ---------- ---------- ---------- total 0 0.00 0.00 0 0 0 0 Misses in library cache during parse: 0 2 user SQL statements in session. 0 internal SQL statements in session. 2 SQL statements in session. ******************************************************************************** Trace file: gen_ora_3120.trc Trace file compatibility: 9.02.00 Sort options: prsela exeela fchela 2 sessions in tracefile. 2 user SQL statements in trace file. 0 internal SQL statements in trace file. 2 SQL statements in trace file. 2 unique SQL statements in trace file. 94 lines in trace file.
Published by: PauloSMO on November 17, 2009 07:07
Published by: PauloSMO on November 17, 2009 07:38 - title changed to be more correct.Although your optimizer_mode is choosing, it seems that there are no statistics collected on ehgeoconstru. The absence of estimated costs and estimated row counts of each of the stages of the plan and the "Note: optimization based on rules" at the end of these two plans would tend to confirm this.
Optimizer_mode choose means that if statistics are collected then it will use the CBO, but if no statistic is present in any of the tables in the query, the optimizer to rule will be used. The RBO tends to be happy in the best of the index case. I guess the index ehgeoconstru_VSN contextversion as the main column and also includes the date of birth.
You can either gather statistics on the table (if all other tables have statistics) using dbms_stats.gather_table_stats, or suggest the query to use a full scan instead of index. Another solution would be to apply a function or an operation against the contextversion to prevent the use of the index. something like this:
SELECT COUNT(*)
FROM ehgeoconstru  ec
WHERE ec.type='BAR' and
      ec.contextVersion||'' = 'REALWORLD'
      ec.birthDate <= TO_DATE('2009-10-06 11:52:12', 'YYYY-MM-DD HH24:MI:SS') and
      deathdate is null and
      SUBSTR(ec.strgfd, 1, LENGTH('[CIMText')) <> '[CIMText'
or maybe UPPER (ec.contextVersion) so that would not change the rows returned.
John
-
I am using 11.2.0.4.0 - oracle Version. I have underwear paremters on GV$ parameter
pga_aggregate_target - 8GB
hash_area_size - 128 KB
Sort_area_size - 64 KB
Now under query plan is running for ~ 1 HR and resulting in question tempspace. Unable to extend segment temp of 128 in tablespace TEMP.
We have currently allocated ~ 200GB at the tempspace. This query runs good for the daily race with Nested loop and the required index, but to run monthly that it changes the plan due to the volume I think and I went for the join of HASH, who believe is good decision by the optimizer.AFAIK, the hash join reverse to temp will slow query response time, so I need expert advice, if we increase the pga_aggregate_target so that HASH_AREA_SIZE will be raised to adequate to accommadate the driving table in this? howmuch size and should put us, it should be the same as the size of the array of conduct? or are there other work around the same? Note - the size of the driving table B is "~ 400GB.
-----------------------------------------------------------------------------------------------------------------------------------
| Id  | Operation                      | Name                     | Rows  | Bytes |TempSpc| Cost (%CPU)| Time     | Pstart| Pstop |
-----------------------------------------------------------------------------------------------------------------------------------
|   0 | INSERT STATEMENT               |                          |       |       |       |    10M(100)|          |       |       |
|   1 |  LOAD TABLE CONVENTIONAL       |                          |       |       |       |            |          |       |       |
|   2 |   FILTER                       |                          |       |       |       |            |          |       |       |
|   3 |    HASH JOIN                   |                          |  8223K|  1811M|       |    10M  (1)| 35:30:55 |       |       |
|   4 |     TABLE ACCESS STORAGE FULL  | A_GT                     |    82 |   492 |       |     2   (0)| 00:00:01 |       |       |
|   5 |     HASH JOIN                  |                          |  8223K|  1764M|   737M|    10M  (1)| 35:30:55 |       |       |
|   6 |      PARTITION RANGE ITERATOR  |                          |  8223K|   643M|       |    10M  (1)| 34:18:55 |   KEY |   KEY |
|   7 |       TABLE ACCESS STORAGE FULL| B                        |  8223K|   643M|       |    10M  (1)| 34:18:55 |   KEY |   KEY |
|   8 |      TABLE ACCESS STORAGE FULL | C_GT                     |    27M|  3801M|       |   118K  (1)| 00:23:48 |       |       |
-----------------------------------------------------------------------------------------------------------------------------------
Find plans by trial and error is not an efficient use of the time - and if it was a good idea to avoid joins and hash, then Oracle have set up their in the first place. I can understand your DBA with a yen to avoid, however, because any spill of a hash for disc often join a (relative) effect much more important than you might expect. In this case, however, you have a loop nested in A_GT which operates 39M times to access a table of 82 lines index - clearly (a) CPU work to achieve would be reduced if you included table columns in the index definition, but more significantly the cost of CPU of the A_GT/C_GT join would drop if you have built a hash in memory of A_GT table that is not a hash join.
What you ask for is a description of how to optimize a warehouse of data on Exadata machine - a forum is not the right place for this discussion; all I can say is that you and your databases need to do some testing to find out the best way to match queries to the Exadata has, so keep an eye on queries that produces the application in case of change of usage patterns. There are a few trivial generalities that anyone could offer:
(a) partitioning a day is good, so you can ensure that your queries are able to do partitioning to remove only the days where they want; even better is if there is a limited set of partitions that you can
(b) e/s for joins of large hash spilling to disk can be catastrophic compared to the underlying i/o for tablescans for the first access to the data, which means that simple queries can give the impression that Exadata is incredibly fast (especially when the index the flash cache and storage are effective), but slightly more complex queries are surprisingly slow in comparison.
(c) once you have passed the flash server cell cache, single block reads are very large and slow - queries that do a lot of single e/s (viz: big reports using nested against randomly scattered data loops joins) can cause very slow IO.
You must know the data types, know the general structure of your queries, be ready to generate of materialized views for derived complex data and understand the strengths and weaknesses of the Exadata.
Concerning
Jonathan Lewis
-
SDO_RELATE within PL/SQL query with rownum clause runs slowly on 12 c - works great on 10 g
Hello
I use the database 12.1.0.2 with a node 2 RAC on Windows.
I am struck by a really weird performance problem with a particular query. Bear with me while I try to explain...
I have a chart with lines 30 sdo_geometry million, in 7 partitions with a local partitioned spatial index divided. Called BIG_PARTITIONED_TABLE for this example.
I query the table to search for one line with a geometry that is equal to the geometry of my request. In this case I use sdo_relate with "mask = equal". Instantly returns:
SQL> select id, geometry
  2  from       BIG_PARTITIONED_TABLE o
  3  where      sdo_relate(o.geometry, sdo_geometry(2002, 2157, NULL, SDO_ELEM_INFO_ARRAY(1, 2, 1),
  4     SDO_ORDINATE_ARRAY(604853.595, 692379.864, 604879.046, 692350.272)), 'mask=equal') = 'TRUE'
  5  and rownum = 1;

        ID
----------
GEOMETRY(SDO_GTYPE, SDO_SRID, SDO_POINT(X, Y, Z), SDO_ELEM_INFO, SDO_ORDINATES)
-------------------------------------------------------------------------------
2.5405E+12
SDO_GEOMETRY(2002, 2157, NULL, SDO_ELEM_INFO_ARRAY(1, 2, 1), SDO_ORDINATE_ARRAY(604853.595, 692379.864, 604879.046, 692350.272))

Elapsed: 00:00:00.10
But if I put the same query in PL/SQL, so it takes 21 seconds:
SQL> declare
  2     l_id number;
  3     l_geom sdo_geometry;
  4     l_window_geom sdo_geometry;
  5  begin
  6     l_window_geom := sdo_geometry(2002, 2157, NULL, SDO_ELEM_INFO_ARRAY(1, 2, 1),
  7             SDO_ORDINATE_ARRAY(604853.595, 692379.864, 604879.046, 692350.272));
  8
  9     select id, geometry
10     into l_id, l_geom
11     from    BIG_PARTITIONED_TABLE o
12     where   sdo_relate(o.geometry, l_window_geom, 'mask=equal') = 'TRUE'
13     and rownum = 1;
14
15  end;
16  /

PL/SQL procedure successfully completed.

Elapsed: 00:00:21.13
If I remove the "rownum = 1", then it returns instantly:
SQL> declare
  2     l_id number;
  3     l_geom sdo_geometry;
  4     l_window_geom sdo_geometry;
  5  begin
  6     l_window_geom := sdo_geometry(2002, 2157, NULL, SDO_ELEM_INFO_ARRAY(1, 2, 1),
  7             SDO_ORDINATE_ARRAY(604853.595, 692379.864, 604879.046, 692350.272));
  8
  9     select id, geometry
10     into l_id, l_geom
11     from    BIG_PARTITIONED_TABLE o
12     where   sdo_relate(o.geometry, l_window_geom, 'mask=equal') = 'TRUE';
13
14  end;
15  /

PL/SQL procedure successfully completed.

Elapsed: 00:00:00.03
If using sdo_equal instead of sdo_relate and keep the "rownum = 1", then it returns instantly.
SQL> declare
  2     l_id number;
  3     l_geom sdo_geometry;
  4     l_window_geom sdo_geometry;
  5  begin
  6     l_window_geom := sdo_geometry(2002, 2157, NULL, SDO_ELEM_INFO_ARRAY(1, 2, 1),
  7             SDO_ORDINATE_ARRAY(604853.595, 692379.864, 604879.046, 692350.272));
  8
  9     select id, geometry
10     into l_id, l_geom
11     from    BIG_PARTITIONED_TABLE o
12     where   sdo_equal(o.geometry, l_window_geom) = 'TRUE'
13     and rownum = 1;
14
15  end;
16  /

PL/SQL procedure successfully completed.

Elapsed: 00:00:00.13
Here is a comparison of the plans to explain. First, here's the good thing, that is using the spatial index (BIG_PARTITIONED_TABLE_SPIND):
select id, GEOMETRY
FROM
BIG_PARTITIONED_TABLE O WHERE SDO_EQUAL(O.GEOMETRY, :B1 ) = 'TRUE'
AND ROWNUM = 1

call     count       cpu    elapsed       disk      query    current        rows
------- ------  -------- ---------- ---------- ---------- ----------  ----------
Parse        1      0.00       0.00          0          0          0           0
Execute      1      0.01       0.02          0         39          0           0
Fetch        1      0.00       0.01          0         31          0           1
------- ------  -------- ---------- ---------- ---------- ----------  ----------
total        3      0.01       0.04          0         70          0           1

Misses in library cache during parse: 0
Optimizer mode: ALL_ROWS
Parsing user id: 263     (recursive depth: 1)
Number of plan statistics captured: 1

Rows (1st) Rows (avg) Rows (max)  Row Source Operation
---------- ---------- ----------  ---------------------------------------------------
         1          1          1  COUNT STOPKEY (cr=99 pr=0 pw=0 time=43307 us)
         1          1          1   PARTITION RANGE ALL PARTITION: 1 7 (cr=99 pr=0 pw=0 time=43297 us cost=0 size=66 card=1)
         1          1          1    TABLE ACCESS BY LOCAL INDEX ROWID BIG_PARTITIONED_TABLE PARTITION: 1 7 (cr=99 pr=0 pw=0 time=43280 us cost=0 size=66 card=1)
         1          1          1     DOMAIN INDEX  BIG_PARTITIONED_TABLE_SPIND (cr=98 pr=0 pw=0 time=43250 us)
Then the slow that does not use the spatial index.
select id, GEOMETRY
FROM
BIG_PARTITIONED_TABLE O WHERE SDO_RELATE(O.GEOMETRY, :B1 , 'mask=equal') = 'TRUE'
  AND ROWNUM = 1

call     count       cpu    elapsed       disk      query    current        rows
------- ------  -------- ---------- ---------- ---------- ----------  ----------
Parse        1      0.01       0.00          0          0          0           0
Execute      1      0.03       0.03          0       1123          0           0
Fetch        1     24.25      24.25          0     499429          0           1
------- ------  -------- ---------- ---------- ---------- ----------  ----------
total        3     24.30      24.29          0     500552          0           1

Misses in library cache during parse: 1
Misses in library cache during execute: 1
Optimizer mode: ALL_ROWS
Parsing user id: 263     (recursive depth: 1)
Number of plan statistics captured: 1

Rows (1st) Rows (avg) Rows (max)  Row Source Operation
---------- ---------- ----------  ---------------------------------------------------
         1          1          1  COUNT STOPKEY (cr=499532 pr=0 pw=0 time=24289612 us)
         1          1          1   HASH JOIN RIGHT SEMI (cr=499532 pr=0 pw=0 time=24289586 us cost=32 size=144 card=1)
         1          1          1    VIEW  VW_NSO_1 (cr=103 pr=0 pw=0 time=31110 us cost=29 size=98016 card=8168)
         1          1          1     COLLECTION ITERATOR PICKLER FETCH SDO_PQRY (cr=103 pr=0 pw=0 time=31104 us cost=29 size=16336 card=8168)
  16914892   16914892   16914892    PARTITION RANGE ALL PARTITION: 1 7 (cr=499429 pr=0 pw=0 time=28678375 us cost=3 size=6600 card=100)
  16914892   16914892   16914892     TABLE ACCESS FULL BIG_PARTITIONED_TABLE PARTITION: 1 7 (cr=499429 pr=0 pw=0 time=23406547 us cost=3 size=6600 card=100)
I tried adding an indication / * + index (o BIG_PARTITIONED_TABLE_SPIND) * / but that did not help.
I am struck this issue during testing of upgrade 10.2.0.5 to 12.1.0.2. The query works perfectly on 10g - we note only that this question on 12 c.
I can't use sdo_equal as the real mask that we want is equal + dommagescausdspar + covers. I'm just using equal here to simplify the test.
I use "rownum = 1" because I want to just the first result. In practice I can rewrite probably is a FOR LOOP, I get out after the first result, but that seems all just awful.
Any ideas? If anyone has seen anything like this before? Its an optimizer delivers really so I'm going to cross post the SQL Forum after a certain time, but thought I would post it here first.
Thank you
John
Hi John,.
Can you please try the following before your slow queries event?
"ALTER session set events ' trace 54669 name context forever."
Thank you
Ying
-
How do I know what the maximum number of agents I can put on a hyperic serv
How do I know what the maximum number of agents I can put on a hyperic server. ?? IM using the built in database on a linux unbuntu 4 cpu system ' s2592 MHZ. 7GB of Ram. I assumed that the
disk space can be the most important question? Any suggestions or any help to determine when to stop adding customers would be useful. We can use open source, but are also
talk about the EE version. The Hyperic server type would make a difference in space etc.?Disk i/o is probably a bit more critical than the disk space that the DB generally is not larger than 10-15 concerts.
Ability wise, your system is CPU/RAM. Disk i/o will probably be your main bottleneck and the thing that will determine the maximum number of agents that can have on the server.
Splitting of the DB from the HQ server would certainly help in the perspective of General load. Definitely put the DB a system with several piles of discs (part of a San, fast raid) will help you in the disk i/o.
If I was trying to answer the same question, I guess that I look at the Scriptures on disk on the DB as starting point, test the drive with systat/iostat or something to see what the drive is capable of in terms of read/write speeds and also look at postgres for slow queries, duration of execution of query, used memory and cpu. Naturally, I would do the majority of "look at her" go to HQ itself :)
Post edited by: ama
-
Improving the performance of sorts/group bys
Hello
We have a large warehouse partitioned bitmap index etc. star schema.
Can run fine queries on tables that do not involve money (measures, etc.).
Gender affected by these garages Group significantly slow queries down.
Any prospect of rom peormance tips to make queries with large sorts faster at daabse level.
The 3rd party reporting tool geneetaes queries and form
Select dim.attribute, dim2.attribute,...,
sum (fact.measure1, sum (fact.measure2)
in fact, dim2 dim.
where the...
Dim.attribute group, dim2.attribute...
Using Oracle 11.2.0.3
Thank youAny prospect of rom peormance tips to make queries with large sorts faster at daabse level.
I found the link that points to your question, may be of your interest below.
http://www.toadworld.com/knowledge/KnowledgeXpertforOracle/tabid/648/TopicId/IOSTS/default.aspxPlease be sure to read good PGA memory management:
http://docs.Oracle.com/CD/E11882_01/server.112/e16638/memory.htm#PFGRF01401Increase size SORT_AREA_SIZE improves the efficiency of the large kinds.
Always avoid the kinds of disc.
Since you work for large warehouse system, therefore, I hope that you have been there:
http://docs.Oracle.com/CD/E11882_01/server.112/e25555/tdpdw_system.htm#TDPDW00312Concerning
Girish Sharma
Maybe you are looking for
-
Satellite L650 - 13 M - high sound under the touchpad
Hello When I work with my laptop, I hear a sound of high light (as you may know an insect repellent, just a little louder). It's not very loud, but it can be really annoying. If you listen closely from below, you can see that it comes under the touch
-
Satellite M305D make "beep" and no longer restart itself
My brand-new Satellite M305D (1 week) is continuely do beep low battery, even if it is plugged into a socket a/c. In addition, after the installation of programs and having to restart, the screen turns off but the laptop never really turns off and I
-
Hi all. I just bought an S90 - A 2 GB ram 32 gb rom lenovo for use with dual sim. There is inside the profile of the audio settings menu for sim 1 & sim 2, but I can't seem to put 2 micro sim in the status bar. Any help?
-
note android double-sided printing
Hi, im using android samsung note 8, I want to make a double-sided printing in my hp deskjet printer 2545 of this note. Help me