writing data to the worksheet
Hi all
I am trying to extract frequencies to help extract information from your multiple. However, I am facing problem record the frequency, amplitude, and phase in the file. Give me an error (it can't be wired together as their data types (digital, string, array, cluster, etc.) do not match.) View the contextual help window to find out what type of data is required. The type of the source's queue Refnum. The type of the sink is Dynamic Data).
I have attached the file. Could you please help at this stage.
Khalid
In the 2D case of amplitude, frequency and phase table, you should unbudle the cluster by its name and integrate these elements build table functions. For your reference, I did sort of thing in your code. You can see the attachment.
Tags: NI Software
Similar Questions
-
chart of increment with the new data to the worksheet
I'm having a little trouble and could use some help if someone has a moment. My vi is streaming at 2 Hz data acquisition and adding data in a worksheet open. I would like to be able to view the data from the worksheet in graphic form, but I don't want to redraw all the data points whenever the worksheet is in graphic form. I have attached the section from vi which is dealing with this issue. I have included an incrementer in my loop (+ 0.5 each implimentation) to allow time (for (i = 0) that each data point is collected, so my spreadsheet has essentially 2 columns, one for the time (0, 0.5, 1.0, 1.5, etc.) and a second column of data point recorded. It all works very well. It's just the graphical representation that gives me. Assume that the broken wires are not broken in total vi. Any ideas on that?
For anyone interested, we solved this problem by attaching a waveform chart to the table converted out of my acquisition of data and define the history of this table to include the necessary length. It seems that a waveform graph is not enough, and each parcel will not appear unless the table is horizontally (columns instead of rows for each data point). Thanks to Jeff at home OR for the help on this one.
Matt
-
Writing data to the file when the trigger is activated?
Hi all
I'm quite new in lab mode, and I find it difficult to find a solution to this problem quite simple. I installed a gauge on a tank, and each time, he reached the limit of overflow of the VI should write all data to a file. I implemented my data tables, but I am struggling to find a way to have the VI writing the data when the specific trigger (the tank overflow) occurs. I'm sure the solution is quite simple, but was faced with this during a few days now so I decided to ask for help.
See you soon,.
Gasim
Gasim wrote:
Seems to work, but the program stops when the trigger activates and asks you a file name to write on and then reset the whole process. Is that anyway so he can write the data automatically, without any interruptions?
Yes, simply son by the name of desired file in VI of file write. If a cable it won't entice.
-
I tried, but in vain, to write data in the CSV file, with the column headers of the file labeled appropriately to each channel as we do in LabView (see attached CSV). I know that developers should do this same in .net. Can anyone provide a snippet of code to help me get started? In addition, maybe there is a completely different way to do the same thing instead of writing directly to the CSV file? (In fact, I really need to fill a table with data and who join the CSV every seconds of couple). I have the tables already coded for each channel, but I'm still stuck on how to get it in the CSV file. I'm coding in VB.net using Visual Studio 2012, Measurement Studio 2013 Standard. Any help would be greatly appreciated. Thank you.
a csv file is nothing more than a text file
There are many examples on how to write a text using .NET file
-
storage, reading and writing data to the file
Hello world
I am new to the Labview and his community. Asked me to acquire data on the measurement of the pressure using Labview. I could build the code and got it working, but when I look at my data that has been collected, there no stopping point. I just spent a lot of time looking at the data in the place where it begins and where it ends. The question I ask is how to create a code to read the pressure, storage, in memory until there finishes, collect data and then to write in a .csv file.
I use the NI USB-6009 case and hook upwards to ai0 and ai4. See the attached code so uncertain.
I want to record 100 data points and the system stops after these collection.
Thank you
John H.
You have a certain time which means your VI will continue to run until you press your button to stop the loop.
The DAQ Assistant is already set to 100 samples.
Just delete the while loop!
-
Writing data to the file trigger
Hello
I'm new to Labview and I'm having difficulty trying to make this work correctly.
What I do is followed the release of a transducer and when it reaches a certain critical value I want to write data to a file.
I have this part works fine, but I'm currently using a higher vi / equal to check the value against the flow of the instrument, so when the value is less than the critical it to stop recording. I want to continue to save for a number of minutes after reaching the critical value.
How can I do this?
Look at using the Express VI of elapsed time. So when the condition is met, it triggers the VI and it will keep logging data until the Express VI shows the elapsed time.
-
data in the worksheet sorted using php or spry dynamically
Good evening
I have a spreadsheet columns 5, 10 lines. I want the user to be able to click on one of the topics and then it be sorted in descending order. I do this with php or spry? And can you advise me how it's done, tutorials or site web link thx
PHP is a language server side, so the page would need to be reloaded from the server whenever the user wants to sort the data. The best way is to use JavaScript, that runs in the browser. You can do this with a Spry data set or many other JavaScript solutions. See, for example, http://www.kryogenix.org/code/browser/sorttable/. Just do a Google search for "sort the JavaScript array columns" and you'll find plenty of results.
-
How to find similar data in the worksheet?
Hello.
I need to find in my products from worksheet with the same name and find themselves their value on the cell.
How can I do?
Greetings
Barbara
Hi Barbara,
What do you mean by "collect their value in cell one (e)?
Do you mean something like this?

Summary::B2: = SUMIF (Data::A, A2, Data::B)
Fill down.
Kind regards
Barry
-
Writing data in the text file or excel spreadsheet
Hello
I have a silly question to ask questions about the writing of data in a text file or a spreadsheet. I have an example that simulates a sine-swept DAQmx. The output it provides is the (amplitude and phase) frequency response function that is plotted on a graph (see VI) attached. I like to use these data for further analysis by transmitting the data to a text file or a spreadsheet. I've tried a few things, but the thread is broken. I guess I use the sink badly - so I was wondering, can you please advise me on what sink should I use?
Your help would be very appreciated,
Thank you very much
REDA
The wire is broken, because you cannot connect this type of data to one of these two functions. The data source type is a table 1 d of the clusters, where each cluster contains two tables. The text file write accepts strings, not clusters. Writing on a file action accepts dynamic data, and while you can convert dynamic data tables, there is no built-in mechanism to convert a table 1 d of the clusters of two matrices.
What you need to do is to convert the data in a format which can be accepted by these functions. Since you want to have a "spreadsheet" file then you should use writing to the spreadsheet file that creates a delimited text file. Since the frequency data would be the same for the plot of the magnitude and phase diagrams, you can have 3 columns: frequency, amplitude, and phase. You can take off the items using Unbundle by name, and then create a table 2D of each element of the cluster. The real question is to know if you want to save the data at each iteration and if you simply add on the file. The attached figure shows write an initial header and then adding just streaming the data.
-
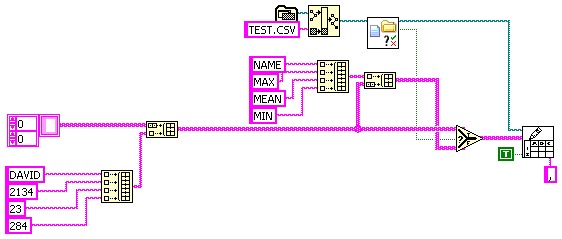
Write the header and mixed data on the worksheet
Hello world
I'm having some problems with writing my data in a spreadsheet file... Basically, I chewed my data and got the values that I want... When I stop the loop I want data saved in a spreadheet... The first line must be a header, and the lines below should be the corresponding data, consisting of a string and numeric data. See the example below.
Topic name, Max Force (N), means Force (N), Min Force (N);
David, 2134, 23, 284;
Phil, 1234, 43, 321;
Tina, 4059, 335, 55;Can someone please help with this?
Kind regards
Jack
This will create a queue (test.csv), check if file exists(no:_creates_header_plus_data...if_yes:appends_data_only):save to a folder first... vi test.csv will be saved in this folder also.
-
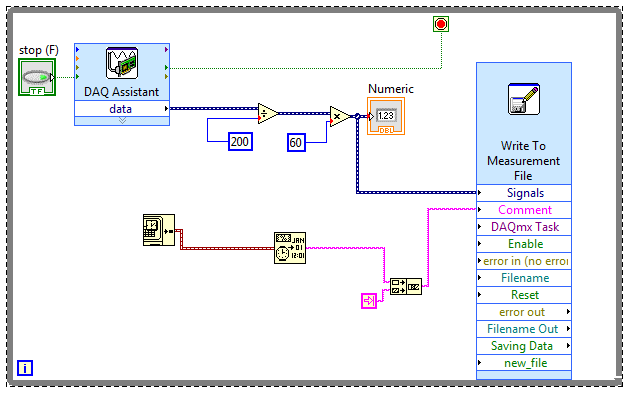
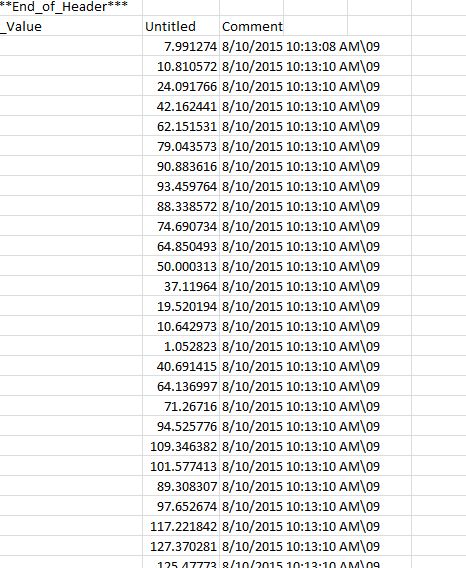
writing data to the file of measure
Hi all
I'm trying record rpm with an encoder in quadrature (200 ppm) in a LVM file with a timestamp of each saved value. It seems to work, except that it registers more values in the file LVM I want. I put the DAQ Assistant to save read 1 sample at a frequency of 1 Hz. However, when I open the file LVM generated by writing custom file Express VI, sometimes I get 42 values per second, sometimes I get 13 and so on. If I don't get a constant number of measurements per second. How can I specify just measure of folder 1 per second, or 5 measures and so on?
I'm using LabVIEW 2011. The encoder values be read as a frequency and then converted in rpm. Thank you! Files and images attached.
Your Express VI is not configured to play at 1 Hz. The synchronization method is the default value, which is used for the reading of the frequency as you do. This basically means you're sampling on the rising edge of the input signal, then you're really sampling rate at the same rate as your frequency.
To do what you want, you can change to mode 1 sample (on request) and add a 1000ms waiting your loop.
-
Problem writing data to the file that is inside the SD card.
Hello
I am trying to write the data to a text file that was inside the SD card in my application.
Everything worked well. If once I connect my camera to the PC via a USB port, then unplug the unit that also data are not added to the file system. Please can someone help me solve this problem.
Thank you
Schott Perfecto
1 single source can access both microSD card. So if the BlackBerry Smartphone is connected to a PC and mass storage mode, your application will not be able to access the microSD card. Mass storage mode allows your PC watch the microSD as a drive on your PC. It is configurable in the Options of the device. You can set it to on, off or invites.
-
Cannot download Persian data in the worksheet Excel to Unicode DB
We have created a 11g as DB with char set AL32UTF8. So, it should allow to insert data in Persian.
Now we have an XLS with the INSERT QUERIES where some columns have given in Persian. It displays the data in Persian letters in the XLS file. But when we opened SQL * more and copy and paste the XLS to SQL insert statement * Persian characters becomes funny characters.
We tried and then change the language and the keyboard to the PC in Persian using Windows locales. Now we can type in a notebook in Persian in the PC, but still when you copy and paste from XLS to Sql * more Persian words comes in funny characters.
How to make a transfer of data like that?
It is only for a single table. Some of the table have 100s of lines and we cannot copy and paste, he must run a SQL script. We've tried doint insertions in a SQL file, but even when the data (inserts of work), we wonder we get data not in Persian but in funny characters?
Any help would be greatly appreciated.So, it should allow to insert data in Persian.
Right. What you have here is a problem with the client that you are using - i.e. sql * more.
As mentioned above, Developer SQL is usually a better bet than sql * more.I'm not a big fan of copy and pasting of the insert statements as a mechanism of data transfer for precisely this kind of pattern.
Another alternative is to through external tables or same sql * loader and CSVs?
I think that MS products are normally at the USC-2 in terms of Unicode charactersets.
In this case, you just get the definiont characterset right in the external table definition / sqlloader. -
I changed one of the newbies ActiveX toolkits provided by Joe_H to enter a number in a spreadsheet by using the following code 'save to existing Spreadsheet.vi. However, since it was designed for a .xlsx, it uses an entry for the index of the sheet (that I set to 1 when you use my .csv file). Currently, the program works, but I was wondering if there is a way to remove the index sheet part. I tried to just delete, but I could not find how connections for refnums etc. should then work out. Thanks for any advice, even if it's just to say that nothing major should be done.
I don't think that there is a much easier way to do what you want then the code you provided.
-
Error when run through the function of path to add-in with writing to the amusement of the worksheet
Hello world
I wondered why the error no. 7 is coming as being attached, when I run the program.
My intention is to write (from the FIFO) data in the worksheet by using entry for measuring function. I connected 1 d table at the entrance of table 1 d of this function. I connecetd the file port add this sub VI to the controller of the file add. I couldn't connect with indicator file add. Wire broken watch by doing this.
Can you give me a suggestion needed to overcome this error and accomplish my data record using this sub VI (write to spreadsheet.vi)?
Required attachments are provided for your convenience.
Thank you.

Maybe you are looking for
-
HP Pavilion Elite h8 - 1070t: updated graphics card for HP Pavilion Elite h8 - 1070t
Up to what series Gtx is compatible with this model on computer? I tried to install a Gigabyte Gtx 960 card to my pc and it was not compatible. I have read similar problems for older models of PC and I was wondering the compatibility for this particu
-
3 TB hard drive works in Pavilion p6110f
Hello, I saw online the other day a hard drive 3 TB for sale and thought 'Hot Dog', I have to have one of these, I went and ordered one. It takes me a few days later and I thought 'cool' is going to have a boot of 3 TB drive, or so I thought, at lea
-
Can not load CD software for the printer 101-707 error code, what to do?
New printer Kodak ESP C315 and I can't install the software.
-
Bright keyboard MUTE indicator
My silent witness does not show however the function works. Lights work to lock the Stoppers and wifi! I have a Pavillion G6 2380sa! I hope you can help me solve the problem. I tried to search for updates on Device Manager and reinstall them also. I
-
15 n077so: 15 - n077so - can not find the driver for 'unknown device '.
After you have installed the drivers for my laptop, I still have an unknown device, I can't find. Hardware ID is: ACPI\HPQ6007 What can be? What SW I have to download? (SP6xxxx)? Tom :-)