calculate the columns of betweeen 2 percenteage ratio
HelloIn my table, we have a column with the name SEX that contains the values of'm ' and 'F' I need to know the percentage of woman.
Any suggestions are appreciated.
Thank you.
PK
Try this:
SQL> ed
Wrote file afiedt.buf

  1  with t as (select 'M' col1 from dual
  2  union all
  3  select 'M' from dual
  4  union all
  5  select 'M' from dual
  6  union all
  7  select 'M' from dual
  8  union all
  9  select 'M' from dual
 10  union all
 11  select 'M' from dual
 12  union all
 13  select 'F' from dual
 14   union all
 15   select 'F' from dual
 16   union all
 17   select 'F' from dual
 18   union all
 19   select 'F' from dual
 20   union all
 21   select 'F' from dual
 22   union all
 23   select 'F' from dual)
 24  SELECT col1,cnt,(cnt/total_cnt) * 100 "%" FROM
 25* (SELECT col1,COUNT(*) cnt,SUM(COUNT(*)) OVER() total_cnt FROM t group by col1)
SQL> /

C        CNT          %
- ---------- ----------
F          6         50
M          6         50

SQL>
Tags: Database
Similar Questions
-
How do I calculate the column in a table
Hello
I rate column and the amount in the table. I want to multiply these column for each line of entry and displays its result in the readonly in the amount column.
like as follows
: Amount: = quantity * side;
can someone help me
Thank you
HervéHello
Just add it to your query...
SELECT col2, col2, col3, col2*col3 col4
FROM my_table
Then change this column to read only in the report attributes.
See you soon
Ben
-
calculate the difference of unique column values
I tried the info and the website to learn how to perform a "calculation difference" function on a single column (channel) of data. For example if my data channel is a period of time to say the following: 100, 101, 99, 102, 100, 99... I would like to calculate 100-101 101 - 99 then then 99-102 and so on for all the values. How can I do this?
Hi ranger,
Looks like you're looking for the standard function "Calculate the disparity" ANALYSIS > basic math.
Hope this helps,
Ralf -
. For example, I need to calculate the difference between a date column, 'Table_Name '. "' Column_Name ' and (Current_Date-1). I tried different ways to do this. But nothing seems to work.
Try the below formula.
Replace "Time". "" Date "with your column.
TIMESTAMPDIFF (SQL_TSI_DAY, "Time". "Date", TIMESTAMPADD (SQL_TSI_DAY-1, CURRENT_DATE))
Thank you!
-
Calculate the sum of the columns
Hello!
Am using jdeveloper 11.1.2.1
I created a table VO based EO. I need to calculate the sum of the column named price.
I use the expression PoView.sum ("Price"). In this PoView is the name of VO and the price is the name of the column.
While spin AMModule I got an exception like
PoView name not found in the given object.Hello
You must use the name accessor EO or VO instead of the name of VO.
See https://blogs.oracle.com/adf/entry/using_groovy_aggregate_functions_in (there are even the same error message in one of the comments of this blog)concerning
Peter -
JavaScript to calculate the average of a column
I have my PDF file I'm trying to calculate the average in a column of fields.
My problem is that there are 7 areas, but all 7 can be omitted, so I think I need some sort of statement 'if' that would only count the number of fields containing values. Then, somehow working in the rest of my calculation...
That's what I have so far...
(function () {}
Get all the field values, as numbers
var v1 = + getField("column.0").value;
var v2 = + getField("column.1").value;var v3 = + getField("column.2").value;
var v4 = + getField("column.3").value;
V5 var = + getField("column.4").value;
var V6 = + getField("column.5").value;
v7 var = + getField("column.6").value;
var V8 = + getField("column.7").value;
Calculate the result and the value of this field
Event.Value = (v1 + v2 + v3 + v4 + v5 + v6 + v7) / the number of fields that have been filled;})();
I'm pretty new to javascript. Any help would be greatly appreciated! Thank you
First of all, I woul write this function withou field reference to make it more universal, and then I have a funcion of document level so it could be used more than once in a PDF document and easily put into another PDF file.
function Avg() {}
average computer of the last non-empty field names
var sum = 0; sum of the fields
var number = 0; meter for non-empty fields
for (i = 0; i< arguments.length;="" i++)="">
iField var = arguments [i]; get the element of arguments passed
var fField = this.getField(arguments[i]).value;
If (!) isNaN (fField)))) {}
field is a number
If (fField.ToString ()! = ") {}
field is not null or empty
sum += Number (fField); Add to the sum
Count ++; County of increment
} / / do not blank end
} / / end of number
} / / end of loop iterative arguments
If (count! = 0) {}
calculate the average if there is one or more items on average
to return the sum / count; Returns the average
} else {}
return ";
} / / no end no average calculated
} / / end of function AvgYour custom calculation script would then become:
Event.Value = Avg ("column. 0', 'column.1', 'column.2', 'column.3', 'column.4', 'column.5', 'column.6', 'column.7');
-
How to calculate this column (the last week of the month)?
I have a request where it shows a few months of calculations of sage
ex. This report is for Dec-2010
statement line. A reduced rate. Approved rate. Last week declined the rate |
-------------------------
Asia report | ------20%----- | -----45%-------- | --------4%------ |
Africa report | ------44% -----| -----21%-------- | ------12%-------|
I'm figuring the column rate declined last week . The logic is simply not coming to my mind.
Can someone suggest me how can I calculate this?We'll see. This report at any time after the previous month running has closed...
(1) TIMESTAMPADD (SQL_TSI_DAY, (DayOfMonth (CURRENT_DATE)) *-1, CURRENT_DATE) will give you the last day of the previous month.
(2) TIMESTAMPADD (SQL_TSI_DAY, DAYOFWEEK (TIMESTAMPADD (SQL_TSI_DAY, (DayOfMonth (CURRENT_DATE)) *-1, CURRENT_DATE)) *-1, TIMESTAMPADD (SQL_TSI_DAY, (DayOfMonth (CURRENT_DATE)) *-1, CURRENT_DATE)) will give you the Saturday before the last week of the month.
(3) TIMESTAMPADD (SQL_TSI_DAY, 1, TIMESTAMPADD (SQL_TSI_DAY, DAYOFWEEK (TIMESTAMPADD (SQL_TSI_DAY, (DayOfMonth (CURRENT_DATE)) *-1, CURRENT_DATE)) *-1, TIMESTAMPADD (SQL_TSI_DAY, (DayOfMonth (CURRENT_DATE)) *-1, CURRENT_DATE))) will give you the Sunday of the last week of the previous month.
Now that you have the start of the last day of the previous week, you can create your filter... It will be "(between 3) and 1)" above... "
-
calculate the sum of the two columns - display the result in the third column
Hello
I have a report and I want to calculate the sum of the two columns of the report and display the total in the third column.
For example: Sample_My_Report
Col1 Col2 (Col1 and Col2) Total
3-7-10
can someone help me with this question.
Thank you.Hello:
If your report is an IR you can use the menu "Tool" to add columns calculated at the State
CITY
-
Calculate the average of a report by column
Hello ~
I have several reports in several areas on a page. I have columns for the time, count, Total and average. I'm trying to understand how to calculate the average for the data that is displayed. For example:
By time
Time count Total average
2 2 4
5-2-10
10-3-30
-----
17 7 44 6.2857
What is happening now is that the app is on average each line first and then adding the middle column. Is there anyway to average the totals and not the lines?
Thank you
Deanna
Published by: Dclipse03 on October 7, 2008 10:00
-
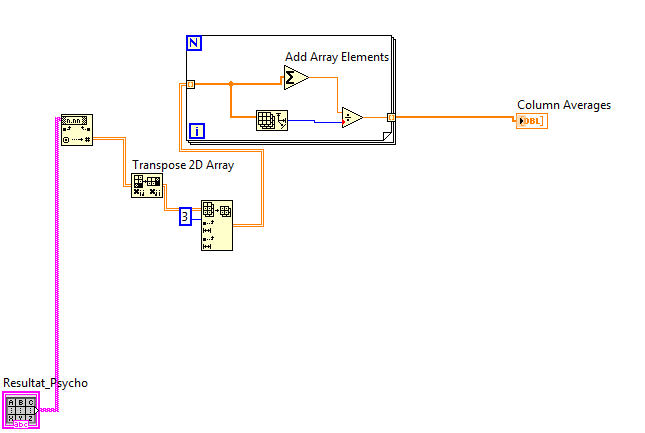
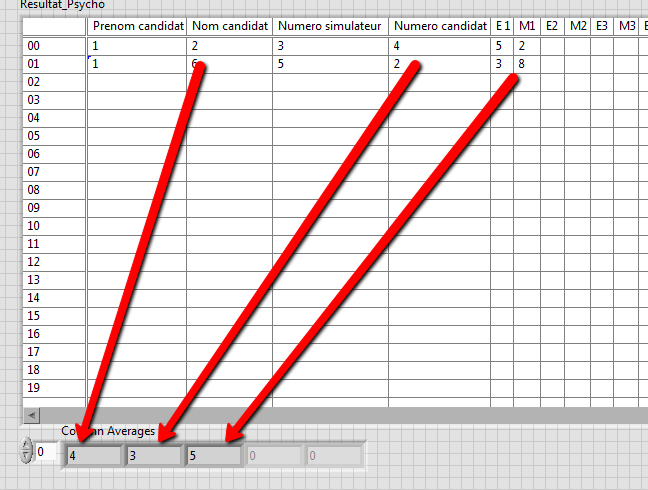
How to calculate the sum of the values of some columns in a table
Hello
I want to get the column just the average of the values of some columns not all columns of the table.what I have to change exactly in this block diagram.even if the table size is 25 average, I want the division as the number of values in each column (= number of lines)
just like that:
-
Calculate the values of a SharePoint workflow status Page column lines
On the workflow status page, how can I have a column with a value in the column lines? My workflow page lists commands that are in the workflow. I wish there was a column where the value of each PO, displays a running total of the PO rises before him.
Hello
It is not a community forum for issues of SharePoint. Please post to the appropriate
Forum on MSDN SharePoint.
http://social.msdn.Microsoft.com/forums/SharePoint/en-us/home
Don
-
Calculate the % with the pivot table columns
I created an application with these columns:
I want to create a pivot table looks like this.Metric Study Fast Slow On-Target Total --------------------------------------------------------------------------------- Metric1 Study1 1 0 0 1 Metric1 Study2 1 0 0 1 Metric1 Study3 0 0 1 1 Metric1 Study4 0 0 1 1 Metric1 Study5 0 1 0 1 Metric1 Study6 0 1 0 1 Metric1 Study7 0 0 1 1 Metric1 Study8 0 0 1 1 Metric1 Study9 1 0 0 1 Metric1 Study10 1 0 0 1
The fast, slow, on the target and Total columns are calculated fields. Picky, I'm having is to get the % columns to work. I also tried create columns % in the form of columns of the table, but at each level of study, the % is 100% or 0%.Metric Fast Slow On-Target Total % Fast % Slow % On Target ------------------------------------------------------------------------------------------------------ Metric1 4 2 4 10 40 20 40
I tried with duplicate columns, all different options to display the value as. None of them worked.
Could someone help me? The version of the OBI is 10.1.3.4
Thank you
Shi-ning
Published by: SPUD on November 21, 2011 23:09Sounds like it. You will need the account of studies as a measure in the criteria. You could do something in the repository, but the fastest way is:
Criteria:
Add the study in (it will not go into the PivotTable)
create new measure based on any existing measure that has the background you need with the formula:
cases where [existing] is not null then 1 else 0 endThis will give you 1 for each line that your measure in effect is valid. Add this new measure in the PivotTable and treat it as a normal amount.
-
How to calculate the month on month growth rates in an OBIEE application?
Hi all
I would like to ask for your help on how to calculate the months on growth rate previous/[(last month-previous month) month * 100%] in a query OBIEE. This report should always be calculated for the last 2 months available.
I have the following query:
Month0 | Months1. Month2
Produces a 500 | 100. 200
Product B 600 | 300. 150
I would like to add month on month column as follows:
Month0 | Months1. Month2. Month on Month (%)
Produces a 500 | 100. 200 | + 100.00%
Product B 600 | 300. 150. -50.00%
I tried to add a calculated item, but it failed because I couldn't find a way to not show the column calculated in percent with 2 decimal places. In addition, I would ideally prefer to have an automatic update but as far as I understand it can be done in the automatically calculated item
I also tried to add a new column to the column area and to filter the results for the last month, then for the previous month and then based on that to calculate the necessary ratio but unfortunately it does not work.
Thank you in advance your adviceHello
The best way to solve this problem is by using the function Ago. With this, you can create a logical column for the previous month. Then you will have 2 columns available with which you can do your calculations.
If you want to do this with a calculated item (don't know if formatting will work for you), but you can do the more general calculation using $1 for the $2 for the 2 column and 1 column in your calculation. If ($x) columns will change with the columns in your report.
Concerning
-
Calculate the average per slot?
Hi Chaps,
I am a beginner on numbers (almost everything on Mac I would say) and I need help to calculate average values.
These are calculated values (column 2) taken on a specific time of the day (column 1).
I managed to create a third using a built-in function to get the time slot (column 3).14:58:42
235
14
14:59:42
274
14
15:00:50
7937
15
15:01:55
5157
15
16:02:57
1822
16
16:03:57
207
16
Can please somebody see me step by step how to calculate the average by time slot as below?
14
254,5
15
6547
16
1014,5
Kind regards
Stone
This can help you

Assuming you data in a table named 'Data' and the information is summarised in another table (right) named "Summary".
Select cell B1 in the summary table and then type (or copy and paste from here):
= SUMIF(Data::C,a1,Data::B) ÷COUNTIF (Data::C, a1)
shortcut for this is:
B1 = SUMIF(Data::C,a1,Data::B) ÷COUNTIF (Data::C, a1)
Select cell B1, copy
Select column B, paste
-
How to calculate the signal / noise from the graph?
In my current project, I read a periphera voltage signal. the signal lead noise even after filtering. So, to identify the necessary data, I averaged the signal.
I have attached the file with an image of graphics. In this graph, the recorded data are drawn black and medium online graph is plotted in red. Now, I have to calculate the ratio of signal to noise to specify with these peak values. How to do?
As the signal passes through zero, be careful in the way you set the signal / noise. For sinusoidal signals, that ratio is defined as the RMS value of the noise (the signal with the desired sinusoidal signal deleted) divided by the effective value of sinusoidal component.
First of all I would like to subtract the average value of the raw signal. The difference is the noise. You can set the signal / noise. A RMS calculation might work. If you have a mathematical model for the desired signal, a fitting for this model can be useful too.
Lynn

Maybe you are looking for
-
definition of multiple rows of tabs
Please tell me how to put my Multiline tabs, so that I can view them without having to run after the arrows on one side or the other.
-
Unable to view my file update for laptop software and drivers
HY, I have recently upgraded my pc Windows 10 and wanted to check if there is a driver for my lapter I do not have any results, I tried to change Windows 8.1 operating system and it is also the same he give this suite of error)
-
My clock continues to change at the incorrect time after I turn it off.
I have to change constantly and I also change the synchronization Web site because they did not help. Can some give me a few tips pleaseee?
-
HP deskjet f4280 does not scan on MacBook Pro Mid 2010 (MacBookPro7, 1).
Hello! I have a hp deskjet f4280 and when I try to scan from my MacBook Pro Mid 2010 (MacBookPro7, 1) the scanner and image capture app froze... I was watching the issue closely, and I think that it is due to a problem with the "HPscanner.app" when h
-
"There no external display connected.
This message came suddenly on the screen and won't go away, even if I rebooted several times. It rises on the top of each window, and it is disturbing. What should I do to make it go away?