Change the axis labels
HelloIs it possible to change the labels of the axis on the length? Because we designed a graphic page where the SQL statements can be created dynamically. So the axis labels must also be changed. But I couldn't figure out how to make...
Thank you
Osman...
Hello
You can create hidden item dynamically set you the value.
Then use point as below on the attributes of table settings Axes
&Px_MY_ITEM.
Hope this helps and is what you are looking for
BR, Jari
Tags: Database
Similar Questions
-
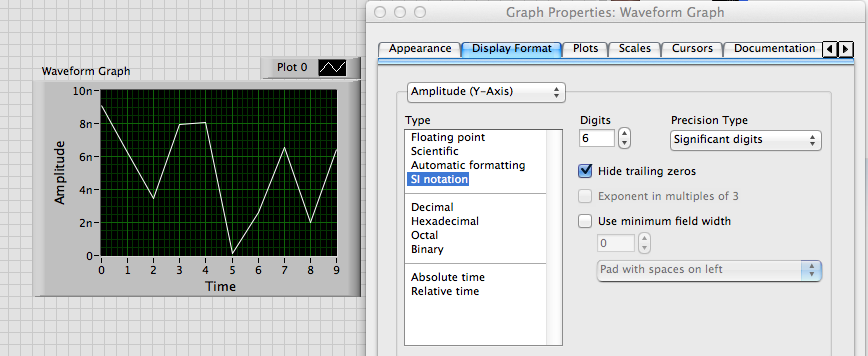
Change the axis label w.r.t. the scale automatically in the waveform graph
Hello
Is it possible to change category axis labels and the value the axis according to the scale automatically? I have a waveform graph which is automatically resized and values on the y-axis of milli, micro and nano volts according to the results of the output from the tests carried out. I need the label of the axis to change automatically according to the scale... Could someone tell me please how to do this. Thanks in advance.
Best regards
Julien
Alain,
I don't know exactly what you want.
If you want to just scale to change as follows: 10n or 5u, use the property format scale IF the Notation.
If you want to change the name of scale label text, you use the YScale.NameLbl.Text property. The attached VI shows one way to do something like that.
Lynn
-
ScatterGraph does not manually change the axis to execution interval
I use the ScatterGraph and the WaveFormGraph in VS2010 Winforms application. I have the interaction mode axes set to EditRange. The WaveFormGraph command allows to edit the axis range by clicking on the end of the axis labels and modify them. ScatterGraph control is not even though the documentation I've read says it should. The mode of the axis does not seem be the question that I have changed between fixed and AutoScaleLoose (which is not the choice to have everything showing changing data, if you want your range entered manually to maintain). I tried a new project with a ScatterGraph control with the default settings and checked that it does not change the axis interval. Is there a way to change the settings to allow you to manually edit a ScatterGraph range in this way when running?
Thank you!
Hi Lybro,
You have activated the "EditRange" of the graphical object of point clouds InteractionMode? There are two places that the mode of interaction is defined, one for the axis and the other for the scatter chart, both must be enabled for writing at work. I just tested this with Measurement Studio 2013 and it works. Let me know if it helps.
Kind regards
Kevin
-
Increase the police the axis labels and plot little away from the card.
Hello friends,
I developed a JavaFx program in which I traced a barchart.
I'm not able to increase the font of the axis labels and also I want to print some for chart axis labels so that the tick-mark labels, and axis labels would not cross.
In this table, I have "BOLD" axis-lines only in the left side and down. I also want the axis lines "BOLD" upstairs and to the right. If there is any way or method that please suggest me.
My program is given below: -.
SerializableAttribute public class BarChartHorzFx extends Application
{
the final static string AUSTRIA = "Austria";
the final static string BRAZIL = "Brazil";
final FRANCE Shared As String = "France";
final static string Britain = "Britain";
the final static string USA = "USA";
/**
* Main method
@param args
*/
Public Shared Sub main (String [] args)
{
Launch (args);
}
/**
* FX lettering from here.
*/
@Override
public void start (steps) throws exceptions
{
final NumberAxis xAxis = new NumberAxis (0, 120000, 20000);
xAxis.setLabel ("Value");
xAxis.setTickLabelRotation (90);
xAxis.setTickLabelFont (do ("Arial", 12));
last axis desabscisses yAxis = new CategoryAxis();
yAxis.setLabel ("Country");
yAxis.setTickLabelFont (do ("Arial", 12));
final BarChart < number, String > barChart = new (BarChart < number, String >
xAxis, yAxis);
barChart.setTitle ("summary of country");
XYChart.Series < number, String > firstSeries = new XYChart.Series < number, String > ();
firstSeries.setName("2007");
firstSeries.getData () .add ((in English only)
new XYChart.Data < number, String >(25601.34, AUSTRIA));
firstSeries.getData () .add ((in English only)
new XYChart.Data < number, String >(20148.20, BRAZIL));
firstSeries.getData () .add ((in English only)
new XYChart.Data < number, String >(10000, FRANCE));
firstSeries.getData () .add ((in English only)
new XYChart.Data < number, String >(35804.15, BRITAIN));
firstSeries.getData () .add (new XYChart.Data < number, String >(12000, USA));
Second series...
XYChart.Series < number, String > secondSeries = new XYChart.Series < number, String > ();
secondSeries.setName("2008");
secondSeries.getData () .add ((in English only)
new XYChart.Data < number, String >(57401.85, AUSTRIA));
secondSeries.getData () .add ((in English only)
new XYChart.Data < number, String >(41941.19, BRAZIL));
secondSeries.getData () .add ((in English only)
new XYChart.Data < number, String >(45263.37, FRANCE));
secondSeries.getData () .add ((in English only)
new XYChart.Data < number, String >(117320.16, BRITAIN));
secondSeries.getData () .add ((in English only)
new XYChart.Data < number, String >(14845.27, USA));
Third series...
XYChart.Series < number, String > thirdSeries = new XYChart.Series < number, String > ();
thirdSeries.setName("2009");
thirdSeries.getData () .add ((in English only)
new XYChart.Data < number, String >(45000.65, AUSTRIA));
thirdSeries.getData () .add ((in English only)
new XYChart.Data < number, String >(44835.76, BRAZIL));
thirdSeries.getData () .add ((in English only)
new XYChart.Data < number, String >(18722.18, FRANCE));
thirdSeries.getData () .add ((in English only)
new XYChart.Data < number, String >(17557.31, BRITAIN));
thirdSeries.getData () .add ((in English only)
new XYChart.Data < number, String >(92633.68, USA));
Addition of serieses to barchart
barChart.getData () .addAll (firstSeries, secondSeries, thirdSeries);
Scene = new Scene (barChart);
stage.setScene (scene);
stage.setTitle ("Histogram");
internship. Show();
}
}See tables to style with CSS documentation-online http://docs.oracle.com/javafx/2.0/charts/css-styles.htm#CIHGIAGE.
Fonts and the location can be changed via the - fx - police-* css types and -- translate - fx * types (see http://docs.oracle.com/javafx/2.0/api/javafx/scene/doc-files/cssref.html).
Code can be validated at the clearer in the forums if surrounded by markers of code between the brackets.Info of the axis can be looked up and changed via css as below (since the graphics to style with CSS documentation):
.axis { -fx-font-size: 1.2em; -fx-text-fill: #462300; -fx-tick-label-fill: #914800; -fx-font-family: Tahoma; -fx-tick-length: 20; -fx-minor-tick-length: 10; } -
Dynamic action to change the point label
Hi all
How can I use dynamic action to change the point label?
Thank you.Hello
I don't think that there is a solution out-of-the-box for it. However, it seems that the Apex 4 correct uses of the elements of the label HTML for labels. So you can use a jQuery selector that is simple to get and manipulate the tag of an element.
Something like this:
$('label[for="P1_CUSTOMER_NAME"]').html ("new label");
Note that there is sometimes a scope nested within the tag tag.
You can use a type of dynamic action "run the javascript" to do.
Luis
-
I have a bar chart and I need to completely remove the axis labels
I have a bar chart, and I need to completely remove the axis labels and have only black 1px on the axis lines.
I tried this in style but the font-size: 0; doesn't labels disappear completely.
BarChart {}
horizontalAxisStyleName:myAxisStyles;
verticalAxisStyleName:myAxisStyles;
}{.myAxisStyles}
tickPlacement: none;
do-size: 0;
}Try adding a verticalAxisRenderer and a horizontalAxisRenderer between your tags barChart.
That is to say.
....
...
The key is in setting showLabels property to false.
J
-
WPF chart: formatting of the axis labels
How to configure the chart to show only the first name label and the axis? I think that it is somehow needs to be done by changing the RangeLabeledDivisions.Mode property.
You can set the
Modeon theMajorDivisionsto a page count mode two:
...
This will show just the minimum and maximum divisions for the beach.
-
AutoScale after Zoom Pan and change the axis interval
I'm trying to connect the axes x many ScatterGraphs and I was wondering how to restore the graphics to their original point of view drawn once a user has made a lot of zoom, pan and axis range chages. Basically how do you perform an autoscale on one axis without having to cancel each operation individually. In the old graphic activex controls, there is an AutoScaleNow function that has done this.
Also, how to cancel a change of range that has been achieved through code? If interactively modify you a range, it seems the SHIFT-RIGHT CLICK to cancel the operation. If the event of range change is captured and applied to the other charts, it can not be canceled.
Use ScatterGraph.ResetZoomPan () to cancel all zoom, pan and change of range in a scattergraph operations. This will cancel the range changes made in the UI, but not changes made through code. To changes in the code, you will have to manage undo operations. You can store the original lines and go back to those who, when necessary. Or you can force a re-AutoScale by changing the mode of scale axis as shown below:
scatterGraph1.XAxes [0]. Mode = NationalInstruments.UI.AxisMode.Fixed;

scatterGraph1.XAxes [0]. Mode = NationalInstruments.UI.AxisMode.AutoScaleLoose;

scatterGraph1.YAxes [0]. Mode = NationalInstruments.UI.AxisMode.Fixed;

scatterGraph1.YAxes [0]. Mode = NationalInstruments.UI.AxisMode.AutoScaleLoose; -
Hello!
It is possible to add color labels that there by default or change the colors?
Thank you
Hi Curioso,
I do not want. Here is the link to put in a feature request. I tend to use labels very, very vaguely like reminders temporary for a project, because there are simply not enough colors to make it a really useful feature.
-
Cannot change the button label
Hello
I have a script here:
' Public Sub processRequest (pageContext OAPageContext, OAWebBean webBean)
{
super.processRequest (pageContext, webBean);
OATableBean = table
(OATableBean) webBean.findIndexedChildRecursive ("ResultTable");
table.setInsertable (true);
table.setAutoInsertion (false);
table.prepareForRendering (pageContext); 1
String buttonLabel =
pageContext.getMessage ("AK", "FWK_TBX_T_ADD_ANOTHER_ITEM", null);
buttonLabel = "new label";
AddRow OAAddTableRowBean = (OAAddTableRowBean) table.getColumnFooter ();
addRow.setText (buttonLabel);
table.prepareForRendering (pageContext); 2nd
DataObjectList columnFormats = table.getColumnFormats ();
ColumnFormat DictionaryData = null;
int childIndex = pageContext.findChildIndex (table, "DeleteSwitcher");
columnFormat = (DictionaryData) columnFormats.getItem (childIndex);
columnFormat.put (COLUMN_DATA_FORMAT_KEY, ICON_BUTTON_FORMAT);
}
If I had to assign another string in the buttonLabel, it did not appear the new label, if I removed the 2nd 'table.prepareForRendering (pageContext);"and run it again, the new label is displayed...
This code is copied elsewhere for purpose of test... may I know is just put the 1 "table.prepareForRendering (pageContext); only? the 2nd can be removed safely? any concern if we remove the 2nd in the code?Hello
You can call it only once.
Whenever you change the properties of the table, we should call this method.
Thank you
Gerard -
Change the display label font size?
I was wondering if there is a way to change the size of the font on the labels below the folders and icons of the image. Maybe just in front of me and I just missed it. Thank you.
There are many who would like this option, but currently there is none. Perhaps submit a feature request.
-
How to change the button label fontfamily
Hello
I want to change the fontfamily to a button. now, it would not be the problem, but the police (intaglio) have no bold... its just a different file name.
normal: CopperplateGothicStd - 31BC.otf
"BOLD": CopperplateGothicStd - 33BC.otf
I read in the flex doku:
Quote:
... or set the default font for the label of the button to match a font that you integrate. -
Can I change by graphical programming axis Label strings?
I use a chart control that has a Y axis with 8 equal divisions and axis label strings to each division. I always want to 8 divisions equal with the channels of the label to these divisions, however, the maximum on the graph may change (for example: 0, 10, 20, 30, 40, 50, 60, 70, 80 vs 0, 20, 40, 60, 80, 100, 120, 140, 160). I can easily set it up through the GUI editor. I can then allow the strings to Label and set the strings correspond to the values of my 8 divisions.
However, if the maximum axis value is edited by the user (for example, 80 to 160), is it possible to programattically changes the values that when the Label string axis? Is pretty simple change it the maximum axial, but this only me half the way there happens.
Thanks in advance!
Oh, and I am currently using v8.1 CVI.
This isn't a simple question!
Firstly, do you intend to do if the user enters, saying, 125 as the maximum axial value? What of your divisions? And how do prevent you the user to change the minimum value as well?
On the other hand, I remember, is not a special event that is triggered when the user changes the axis interval.
I suggest putting a separate button on the control panel to change the scale, have the use of the maximum desired value with PromptPopup or another method of entry, adapt it to a reasonable value and apply it at the graphic level, leaving the grpah to calculate the value of his 8 Division itself.
That being said, consider that the chart axis labels can be set programmatically using the label strings: see here, section "strings of the axis; the same can be set at design time in the Publisher of the IUR. This can be an option if you decide to go in a different way from the one I proposed.
-
How to stop labelling color to change the entire master clip?
I want to label clips separated from each other without changing the color label at the master clip on the timeline of color. Is this possible?
OK, I fixed it!
Go to the project settings > general, and at the bottom of the window there will be 'display the color name and label of project for all instances. Uncheck the box for it and it works.
See screenshot below.

-
Change the 'label' on an active vSphere license?
All,
I have a lot of "combined" vSphere licenses groups in vCenter 4.1, I would change the descriptive label on some of the or the vSphere currently loaded in vCenter licenses.
Cannot do through the UI, I have looked on the tables of database VPX_LIC_ * but don't see anything with the information on the label. I could go through the center of the license and get the keys to the 'News', but I have to go through several cycles to combine/split to obtain the appropriate keys, too much work.
Anyone know where this information is stored? I expect it to be in the same table as VPX_LIC_LICENSES (which is where the license keys are) but no dice.
Ben
The label can be changed by going to the page of vSphere vSphere Client licenses, view by product, then developing the object to see its keys.
Since the key line, click on the label and press F2 to edit the entry (or you can double click on it).
I've edited all my labels to better describe what they manage (such as Group A, Group B, etc.).
I was able to do this since vCenter 4.0, tested on 4.1 and it still works fine.

Maybe you are looking for
-
I am trying to install windows via BootCamp, but I got to know that the NTFS format that uses Windows is not automatically formatted on my drive. I also found I'm supposed to be able to do it in the installation under Windows (disk for installation s
-
HP Slimline 410-010 desktop: driver for my wireless card, cannot connect to WiFi
I just reinstalled WIndows 7 Professional. I find all the drivers except for the wireless adapter, I can not connect WiFi, here is the card number. I searched and could not find the driver. Thanks for any help. PCI\VEN_10EC & DEV_8179 & SUBSYS_804B1
-
I had to reformat my hard drive on my xp. I get the message that I need to install .net Framework 2.0 on my computer. I guess I have to find the .net 2.0 only and not with SP1 or SP2? I can't find anywhere. Where can I find this particular servic
-
Security question for the e1000 router
The E1000 router is equipped with a default security setting when installing using the supplied CD?
-
I have a small application which was developed using eclipse. When I try to test it on the device, I use the Jar file to install it, but after that I can't find anywhere... When to go to options/applications, it is said that its there... I tried remo