Change the Pivot graph in Obiee 11 g
Hi allCan I change the graphic Pivot in Obiee 11.1.1.5? I have a PivotTable with 3 measures and then I created the graphic pivot from that.
But the measures appeared in graphic pivot are the same with the pivot table (3 measures), how if I don't show that 2 measures graphic pivot?
Help, please.
Thank you
Joe
Published by: JoeSSI on July 12, 2012 21:16
Hey Joe,
Not possible, make it views both pivot with and without graphics. ARange both the views side by side in compound layout.
Kind regards
DpKa
Tags: Business Intelligence
Similar Questions
-
Is it possible to change the pivot of a symbol point?
Once a symbol created beachfront animate is possible to change the axis of rotation, so that it is not attached to the center of the object?
Thank you!
I found an answer here:
Rotate an object from a pivot point?
Thank you
-
How to change the handset filter requests OBIEE 11 g
Hi all
I'm using OBIEE 11 g. I try to combine the 2 simple requests. The first request is filtered by ColA = 'A', while the second request is filtered by ColB = 'B '.
How to add and remove the filter for each of the combined applications? 11 g, I don't see the place to change the filters when the combination of applications.
Any thoughts? Thank you very much.You combine the 2 applications by using a fixed operator (union, minus sign)? If this is the case there is a component of filter button to show/hide for each of your applications.
I hope this helps.
Quinten
-
How to change the date format in OBIEE
Hello
I have a need to change the column to a column of varchar by OBIEE...
The date column stores the data in the format "YYYY/MM/DD", I need to change that for a column of varchar with this format "YYYYMM"...
Since I'm pointing directly to the transactional database, I can't make changes to the database level, so I have to do in OBIEE layer, of the ideas of how this could be done?
Thanks in advance!Hi user,
Reference: http://varanasisaichand.blogspot.com/2010/01/how-to-change-data-format-to-our-custom.html
http://varanasisaichand.blogspot.com/2010/05/evaluate-function.html
Thank you
Saichand.v -
Cannot change the (visually) graph in Illustrator
I have Illustrator CS3 on Mac and I'm trying to create some graphic visuals for the work. After you have created the basic chart, I select and try to access the object > graph > design, or a Variant, but the object INTEGER from the file menu is not selectable. Even using the direct Selection tool, I can't go to object > graph > Design or column or marker. Any help?
You must first close the data table. Then, you can change the graphic attributes.
-
Hello
Is someone can you please tell me if it is possible to change the port used by OBI (for example, I want to change the port number of 9704 to 8080
So instead of http://localhost:9704 / analytical I want it to be http://localhost: 8080/analytical).
And if so, how do I do it?
Thank you very much!Hello...
If you want to run the websdervice on the port number different or better yet by default port 80, it's what you have to do.
Step 1: Navigate to your directory config of OC4J, ussally located in... :-OracleBI\oc4j_bi\j2ee\home\config
Step 2: Add a new directory called: "backup_orignal". Copy everything in the config directory to the new directory. (better save then sorry...)
Step 3: Open the file named by default-web - site.xml in an editor (XML).
Step 4: between the {site} find the tag = port, change port = "80". Save the file.
Step 5: Add a new directory called: "backup_change_YYYYMMDDNNN" (copy everything in the config directory to the new directory. (Why?, if you are not very careful during an upgrade you lose all your settings OC4J...)
Step 6: Stop and start your OC4J.
You can now run your OBIEE site from the new port number.
Of course, you also need to change the port number in OBIEE config files:
... \OracleBI\oc4j_bi\j2ee\home\applications\bioffice\bioffice\WEB-INF\bioffice. XML
...\OracleBI\xmlp\XMLP\Admin\Configuration\xmlp-server-config.XML
... \OracleBIData\web\config\instanceconfig. XMLThank you
Sandra Baludu.Published by: Sandra Baludu 7 May 2009 08:27
-
How to programmatically change the width of a graph?
How can I programmatically change the width of a form of wave or waveform graph? When I create an implicit property of a chart or a graph node, it is read-only. Change the boundaries of the parcel has worked in earlier versions of LabVIEW, but not anymore.
It works for me in LV2013 but I use the plot area: Dimensions: width property.
-
How to change the accuracy of output waveform and spreadsheet graph data acquisition
See attached vi, data acquisition connects to a waveform graph in a spreadsheet. I want to change the precision of the output of Wizard DAQ 6 decimal places with 2 decimals, but everywhere I looked on the DAQ assistant, I can't find a control accuracy. I missed something? What is the elegant way to do this?
Thank you.

Hello sunflower.
This seems related to this question...
Why do you want to change the output of the DAQ assistant?
Should not change the precision of the creation of the worksheet? To do, simply give a few parameters for the functions "to the string conversion..."
Outside the file save all the other screen precision parameters are just cosmetic measures!
-
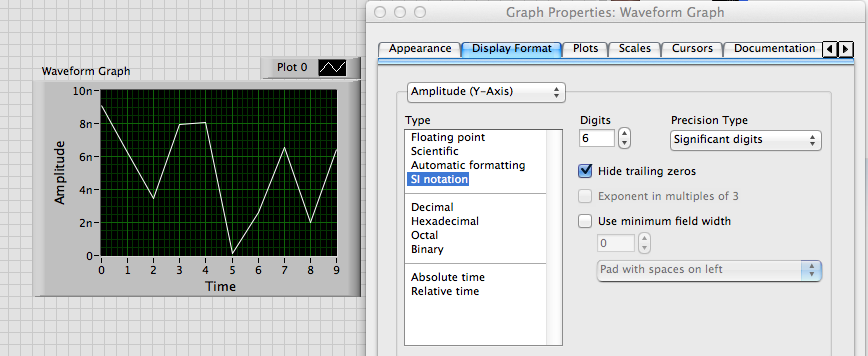
Change the axis label w.r.t. the scale automatically in the waveform graph
Hello
Is it possible to change category axis labels and the value the axis according to the scale automatically? I have a waveform graph which is automatically resized and values on the y-axis of milli, micro and nano volts according to the results of the output from the tests carried out. I need the label of the axis to change automatically according to the scale... Could someone tell me please how to do this. Thanks in advance.
Best regards
Julien
Alain,
I don't know exactly what you want.
If you want to just scale to change as follows: 10n or 5u, use the property format scale IF the Notation.
If you want to change the name of scale label text, you use the YScale.NameLbl.Text property. The attached VI shows one way to do something like that.
Lynn
-
Change the color of the graph by programming
HIII everybody,
I have to draw 12 plots in a waveform graph. I chose the colors in the legend of land for each parcel. But I don't want to display graph 12 at a time. I have as many checkboxes for selection as graphical user settings of the parameter to which want to see. I did what his works well.
But there is a problem in the color of the graph, if I select 12 parameters at a time, then it displays with the same color I selected on the legend of the plot. But if I choose to less than 12 parameters labview assign colors in series without distinction of color affected. I have attached the VI please help me with this.
Thank you best regards &,.
Manisha
Your problem isn't that you have changed the colors on the chart, it's that you have change the label. Actually, you have restructured your table in its entirety.
Why don't you use the Visible field? property to determine what is visible. Now you're talking almost no code.
-
Hi guys,.
is it possible to control the display mode of the interactive reports, i.e. display icon, list, view detail, group by, chart, pivot?

As I understand the current setting is stored as a preference of the user for each user... and again when his connection. A settings of the rules them all (all the stored report parameters).
The display mode switchable using a javascript, the api package apex_ir or via a link?
Thank you
~ Dietmar.Hi Dietmar,
It is not a supported way to change the display interactive report mode. With the device connected by Anthony internally, we will consider adding this because part of apex_ir or a link to the future.
Kind regards
Christina
-
Change the color of the points plotted on a linear graph
I was wondering if anyone knows how to change the color of the points plotted on my line graph (1e) to make it look like the 2nd. I want to emphasize the points plotted on top like the other online. Also, how to make tick marks on the x - axis as the second chart? If someone could help me that would be great
-Elise
You need to copy segments of track of the chart, and then paste in place. Then the color what he read.
With regard to the tick marks: find out how to enter your data for the Illustrator graphic function.
-
How can I change the color of line in a line graph?
I used Illustrator to create a line graph. (Not my option you want because I normally import from R and then edit, but the manual wanted to show that you can create graphic and edit them in Illustrator)
In any case, I did all the editing, except that I can't change the color of the line. My job requires me to match the example of manual and the manual does not provide any instructions on how to do it. I did pretty much any method I can think and the rest always gray line. I'm almost ready to give up everything and lose the points, but something as simple as the color cannot be that hard, right? Right?
You need spend the focus from filling in the race or the color Panel, or by using the shortcut SHIFT - X. You can use Select > same > Fill and stroke to select all parts of the line and then a Cmd (Ctrl)-J to connect all the parts.
-
change the value limit in default graphic view, obiee 11g
Hello
I have two measures with the columns of the year in my report, I have generated a graph.
In x - axis, the values of a single measure is beginning with 10,00,000
but another of the measurement values is no more than 10,000. If the second bar lines are not visible in the chart. My question is how to manually change the values on the x - axis.Modify the report-> change the properties of the graph-> scale-> change the limit from the default axis manually and enter the values min and max of the axes limits...
PLS, mark it contributes to...
-
Cannot generate the graph in OBIEE 11 g
Hi all
I have four columns in the report, the dimensions and columns makes three
Dim.Col1
Fact.Col2
Fact.Col3
Fact.Col4
Fact.Col4 is nothing, but I'm dividing Col2 and Col3, so in the Fact.Col4 formula, I have this
Fact.Col2/Fact.Col3
and these are the settings I've done for Fact.Col4
1. I replaced the default data in percentage number format
2 aggregation rule is default
3. have you checked "treat as an attribute column.
So my Fact.col4 has values like this
2.5%
4.5%
6.2%
Now when I'm trying to build a graph using the Sun columns. Col1 and fact. COL4, then the graph is not posting. It shows empty to me. But when I change the default percentage data format (means clear the check box), and then back to the chart. So we cannot create a chart on the column to which we put the data format to percentage. ? Can you get it someone please let me know what I'm missing here
Thank you
RonnyThe graph is displayed when I select this option for the column calculated measure (ex - Fact.Col1/Fact.col2) with the data in percentage format.
You can just try again? Please clear the cache of the browser as well.Thank you.


Maybe you are looking for
-
Drag n Drop works but is not accessible
I lost Drag n drop and reinstalled from my disc utilities. I run 2000 on this computer for backup. I loved this software if I have other software on my XP desktop. Prefer the Drag n Drop. Uninstalled and reinstalled 5 times. Can not find the software
-
Hello everyone and thanks for all the help that you have visited, have me here where I am with my project. I'm now trying to integrate my VISA with the USB-6002 device to write data in my spreadsheet. I tried in vain to get my data from the VISA unit
-
can I use hp7 compressed during charging?
Can I use my 7 HP Tablet it charging with the wall charger? What happened when immersed in us port to laptop?
-
Received this as an e-mail, you wanted for me to know. Dear account owner It is email to Windows Live Hotmail and send it to your user account for your security. Due to recording anonymous account that causes congestion to our service so we are closi
-
5560 MiraScan driver not found
Hello My scanner Benq 5560 work very well on my old computer with Windows XP. But it does not work in my new computer with Windows 7. The error message is 'not found Scanner"then I installed the driver using the CD that came with the scanner. The 200