Data points in chart
HelloHow we can display values Datapoint on Flex LineChart.
We can show Datapoint with the Mouseover event using showDataTips = true.
But I need display all Datapoints on above marker.
-Kumar
I don't know what you mean. Say you you want all the data displayed on the 'above' marker points, can you explain a little better what it is you want?
Is that what you want the details to the datapoints poster all the time, without having to mouse over them?
Tags: Flex
Similar Questions
-
I use a 2D line chart to show the status of my weight loss I will give my doctor.

I want to select a group of data points, or individual data in the notes to table and place the points or the labels on them so I can identify things like water weight loss, the consumption of food and splurges, and so on.
Thank you, Eric
There is no such feature.
You can, however, add a column to the table where you enter the data and make this new column 'Notes' or 'Description '.
You can also use the arrows and other graphic elements in the menu "Shapes" to highlight specific items of interest.
-
Line chart of several series with staggered data points
Hello
App of Hillary graphic sample includes an examples of charts and how to handle null values.
https://Apex.Oracle.com/pls/Apex/f?p=36648:55
I came across a scenario which goes a step further. If you have a series with a set of data points and another series that overlap, where a few data points are missing, for example:
create table graph_lines (series number, thedate date, thevalue number);
insert into graph_lines
select 1 series
  ,add_months(trunc(sysdate,'yy'),rownum-1) thedate
  ,log(2,rownum) thevalue
from dual
connect by level <= 12
union all
select 2
  ,add_months(trunc(sysdate,'yy'),rownum-1)
  ,case when mod(rownum,3) =0 or rownum =2 then log(3,rownum) end
from dual
connect by level <= 12;
I get the case where he's going to draw a line between the points that are next to each other, but the gaps it will display just the point

Https://apex.oracle.com/pls/apex/f?p=73000:35 image
I have no doubt a single this is the expected behavior, but I would like to know if anyone has any ideas on how to connect the dots.
I thought about a snazzy model clause generates middle in my data points might work, but this seems heavy handed and a little scary.
I thought that maybe there is a graphic solution?
APEX 4.2.x
Scott
The idea of 'Null' removal was not all that possible. After testing it out, I found apex will be always generated empty points. Explicitly define the XML to have only the data points with values does nothing either.
Because I thought it was a really interesting problem, I was wasting so much time on this :-). I was side on the reference guide and the user, modify the XML again and again and again.
I hoped that, by defining a second category axis and set regional and datetime parameters, change of the shaft in one type datetime and specifying a main grid with every month, the table would be plot my data on this axis. Unfortunately, it seems as if this is ignored - a very frustrating experience. Anychart would just keep trace points with its own calculated intervals.
Ultimately if I stumpled on a sort of difficulty, although I'm not sure how good it would be. There is a setting that you can set by using the custom XML part that ignores the missing data and the values of interpolation. It works well, but it always displays labels.
https://Apex.Oracle.com/pls/Apex/f?p=11031:4 apex_demo/demo
AnyChart | [AnyChart 6.x] How to connect mind lines...
node - reference XML - AnyChart.Com Flash Chart Component With all these nodes, is it easy to miss what you need... It's a bit weird, but who "ignore the missing" points, you must set the value to "false"? :-)
-
Anyway do not draw data points as nodes on a line chart?
I have no use for the each data point = function node on my chart, and I suspect that's the reason why in my application performance is very poor. I have a line chart which can be composed of several hundreds, or even thousands, individual data points----> I can not afford to draw a node for each of these points when he didn't need to do. I just need the line between the drawn points.
A quick ogle at the JavaDoc reveals no obvious way to do it. I can remove the Visual effect in CSS - and I have - but the nodes are still created.
How can I prevent the JavaFX creating a node for each point?
I have the same problem: try to use
lineChart.setCache(true);
lineChart.setCacheHint(CacheHint.SPEED);
This should speed up your data series
-
Lack of data Points in the chart Illustrator
Hello, I create a line chart in Illustrator (CC) on a Mac and after entering the data, one of the lines is lack of data points. When the line should be, it breaks everything. Here is a picture of what it looks like (see the purple line and the second column). I have not removed all the points or it separated. I tried to recreate it, and he did the same thing? Why the data points are missing? How can I fix this problem so that they appear?
(Note: I asked this via chat 0186206467 and it took so long to get an answer that cat quit on me.)

What happens if you enter the data without the comma? This missing data.
-
Hi all
I would like to know where is the location of the mouse position to a point of data compared to the graph. basically, the opposite of this person's job action:
The point value of graphic display WPF overview
Instead of getting a data point, hold the position of the mouse. I am the superposition of the shapes on the chart and would like to know for a specific point in the graph in pixel coordinates.
Thank you.
Of after your question, I assume you have a data value you want to translate (as opposed to an event arguments of mouse, which already has a
GetPositionmethod).You can use the
DataToScreento get a position of the screen in the plot area, so useDesiredPlotAreaMarginto compensate for this position on-screen to reference external graphic control (i.e.point.X += margin.Left; point.Y += margin.Top).You can also use the
DataToRelativeto get a relative position of a data point, then place an object in theChildrencollection (a bit like aPointAnnotation):XAML
xmlns: or = "http://schemas.ni.com/controls/2009/xaml/presentation."

xmlns:niPrimitives = "http://schemas.ni.com/controls/2009/xaml/presentation/primitives".

...


                 Width = "10".

                 Height = "10".

                 STROKE = "Black".

                 StrokeThickness = "2".

                 niPrimitives:RelativePanel.RelativeHorizontalAlignment = "Center"

                 niPrimitives:RelativePanel.RelativeVerticalAlignment = "Center"

                 />
Code
Parent = graphic point. DataToRelative (dataValue);

RelativePanel.SetRelativeHorizontalPosition (dataMarker, relative. (X);

RelativePanel.SetRelativeVerticalPosition (dataMarker, relative. Y);
-
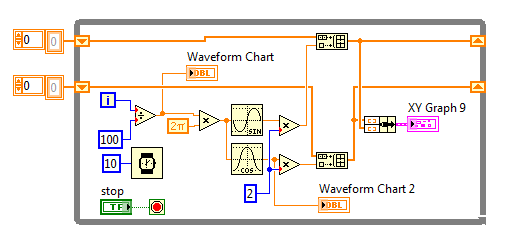
Hello
I am creating a VI that shows a circle being generated in real-time of the face before of the VI. I use a loop to generate values then pass the values to a block of cluster, then a graphic block. I have attached a VI for you to see where I am. When I run the VI while loop runs continuously and does not have information about the cluster. In the loop, the loop runs until it hits the number of meter and then transmits data to the cluser block on his way to the graphic block.
I'm doing the VI spend a data point outside the while loop and loop on each iteration for the chart. Can someone show me how to do this please?
Thank you very much
James
You can't get the data out of the loop until the loop ends (or unless you do something fancy unnecessarily). Programming LabVIEW is based entirely on the data flow and parallelism. It is incredibly powerful and has led to its success over the years (coupled with graphical programming), but is usually one of the first things the new developers stumble on. This is a simple resource to familiarize themselves with its functioning. The function to highlight execution is a great way to watch how your application uses data streams.
If you want to update the graphics are coming data, then you must move the graphical indicator terminal inside the loop. You can do so by completing one iteration to iteration that stored tables using shift registers.
-
I use X-zoom tool on the graphic palette. In this chart, the x-axis are time. Thus, for example, if I have 30 seconds displayed on the x-axis of the complete graph, and I want to zoom in on the Middle 10 seconds, how can I get the axis y data points that correspond to this average 10 seconds?
Similar to Cory's suggestion, could you use the X - Scale-> range-> the Min and Max properties to retrieve the appropriate data?
Maybe even link your sweater of data for the range of scale change event?
-
Graphical waveform data points, the performance impact to no.
Hello
I searched the forum, but I have only partial information yet about this behavior of graphics WF.
I have a TAB control on the façade, and a TAB page contains a WaveformChart. I traced points with speed of 0.5 Hz, and I have 8 (curves) plots on the chart.
I would like to have a lot of history, so I put the length of the graphic history to 44000.
Everything works as expected, but I see some sluggish behavior, when I click on another TAB page and return to the page of the TAB where the table.
In this case, the appearance of the graph takes about 1 to 2 seconds. This isn't a big problem, since the user typically controls the last minutes of ~ 10 (X-autoscale deactivation and change left "border" time). When this small amount of data points are visible on the graph, the new TAB page is fast after the click of the mouse. When several hours of data is presented, it's slow.
I guess the main reason for this behavior, it is that, when I switch back to the graphics TAB page, the OP system has to re - draw a large amount of data points, and it takes a lot of time?
I'm curious what is the 'best practice' in such a scenario? Shell I store data in a shift register and use an XY graph (I actually have data points such as the double and the corresponding time stamp, there are small fluctuations in time, so I need all THE timestamps)? Would it be useful? So I could add the new XY data point in the array in the register shift, and I redraw the graph at each new stage?
Thanks for the tips!
I don't know if this applies to your situation, but sometimes the LV refreshes no lights front panel which are not visible on a tab page that is not in front. Table has its internal buffer, but I have no idea how them redraws is managed at many points to accrue though not.
A graph redraws the data are written on it because you have to write all the data each time each time. With SHIFT register approach the graph would only see the most recent data when it becomes visible, so it seems that it needs to be adapted.
Another thing: your chart or table has no 44000 pixels along the x axis. LabVIEW will reduce the number of pixels to display the data. That takes some time too. Using the registry approach change, you can manage the data introduced to the 500-1000-2000 pixels will display your chart. This eliminates the need for BT to do and you can order the method: on average, decimate, sliding window and so on.
I'd go with the registry to offset and graph.
Lynn
-
problems with the date in the chart in the first instance
Hello
I have a date selection field (P2_START_DT), which has a default value in a table
Here's the code I used to set the default (thanks again to the expert for assistance)
Start
Select max (REC_DATE) dt in: P2_START_DT
from TABLE_A;
return: P2_START_DT;
end;
on the same page, I have a report (Type: SQL query) and a chart that takes P2_DATE as a parameter
This is a sample report SQL condition
...
where
RECORD_DATE >: P2_START_DT
This is a condition of samlpe SQL used for the graphics
...
where
RECORD_DATE >: P2_START_DT
condition is about the same for both
My problem is that when the page is loaded for the first time, the P2_DATE field and the report shows good data but my chart shows nothing.
to test, I added a button to submit the page.
When I click on the button both my chart and the report shows the right data... suggesting that for some reason any graph is not picking up the default value for P2_START_DT when the page is first loaded
Please notify.
The default value for your item is not saved in session state until you offer page. When your chart is rendered the first time the value of your object in session state (which makes graphic references) is not defined.
Create a calculation for your section header to set the value of the element in the session before the rendering of the graphics state.
Calculate the point: P2_START_DT
Calculation Point: before header
Type of calculation: (single return value) SQL query
Calculation:
select max(REC_DATE) dt
from TABLE_A;
Condition Type: point value / Expression 1 a NULL column
Expression 1: P2_START_DT
-
I have on some, but not all of my resources, a model where 4 datapoints are declared and then the 5th one is missing (grey appears in the table of availability). I suspect it's something like the agent is running out of time to collect or something like that, but there is no error in the agent.log messages that indicate this. Someone at - it ideas?
What are the intervals of collection which collects this measure? Also, what is the date range in the scoreboard?
The default indicator charts show 60 slices of time even for the date range you have set. If you have the default value of 8 hours each time slice is within 8 minutes. If the metric you are looking at has a collection interval greater than what shows the slot, you will have gaps in the data points. Changing the resolution of the date range must show that the 5th data point is here.
-
Is is possible to add a data Point to 'Stand hours?
Hello
I tried to add a data point to my hours of support in the application of health. I discovered, that 'stand hours' is the only category where the button "Add data Point" is missing. What is a possible way to add hours on another way?
I'm not allowed in the place where my watch at work, where I am standing approximately 11 hours. Caused by this, I am not able to reach my goals.
Hello
It is not currently possible to manually add the credit toward the daily goal of Stand to your Apple Watch.
If you want to suggest that Apple considers adding this as a new feature, you can do it here:
-
How can, during the collection of data, start a new column in my table every 100 data points?
Hello! I have a problem with my data - I get in a wide range of 1 x 1000, but it's the repeated measures, each taking about 500 data points. I want to break this table for this data string start a new column in my table every 500 points given. I don't know how to do it-please help!
datacompiler100 wrote:
Hey thanks for the sponsor and the first off I must apologize for the State, I am attaching my VI. I put the part of the VI that I am working on (my team has access, so didn't post everything here) and also attached the data file (when just written in a spreadsheet file, not through the attached VI). I want to convert the long row of data and then start a new column every 50, 100, 5 points (user-defined).
Using the data from the file, you can reshape everything simply (as you already!), followed by transposition (since you want columns instead of rows). 2D arrays must always be rectangular, so the last column is filled with zeros if necessary. Is that what you want?

Of course if you try to add a new column in a file, that will not work. You can only add lines in an existing file because of the way the data is organized. To add columns, the entire file must be read, intertwined and all re-written new data in the file.
-
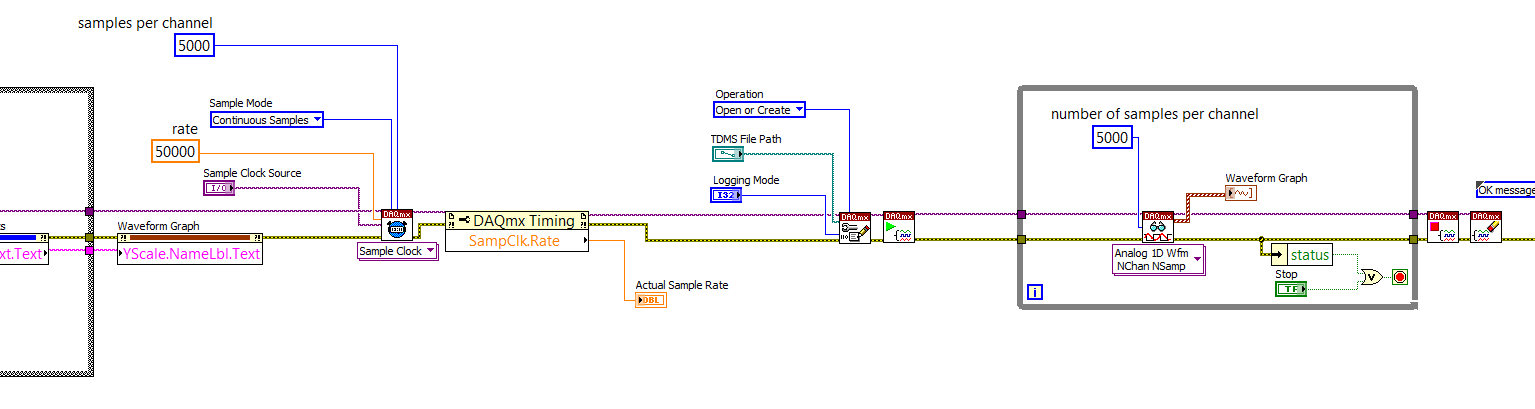
Sampling rate - too much data points
Hello community,
I use a sensor signal strength of pressure on DAQmx labview through 2014. My rate from the hardware synchronization function is 50 KHz. The samples per channel of timing and read screws are the same set to 5 Khz when the channels are a continuous sampling. The problem I'm having is that when I run labview for a few seconds, say 5 seconds, I'm half million points of data. I tried to run for 10 seconds and points were more than a million where it is difficult to analyze. I think that the vi generates too much data points and the buffer is large. Am I wrong? Can you please help me solve this problem?
Kind regards
Mike
You are now ready to learn a little of the power of LabVIEW and data flow programming. LabVIEW is an inherently parallel language - two loops can run independently and in parallel, allowing you to make time-sensitive (such as sampling data) and a lot of time (such as data logging and tracing) at the same time, using queues to pass data between the loops and ensure the buffering required.
If you open LabVIEW and click on the file menu in the toolbar, and then select new... (the points are important!), you will be able to create new ones (VI) from the model. Choose a Framework, Design Patterns, producer/consumer Design Pattern (data). It's what you want to do.
You basically set up a "pure DAQ Acquisition Loop" (without logging TDMS) as producer, creation of 5000-element arrays of data every tenth of a second (if you are sampling at 50 kHz). You create a queue of data outside the loop of producer whose elements are an array of 1 D of waveforms (the output of your Read DAQmx) and instead to send the data to a waveform graph, you put it in the queue.
You are under this loop, a parallel loop that gets the same queue and remove items. This loop will be sitting idle (no time taking CPU) until the data is queued. He then it takes away the poster and registers (logs) in a PDM file. Either way, you should open the TDMS file before entering this loop (consumer), write to the file inside the loop and close the file when the loop exits. Study the example of the VI, you create with the model and see how it works.
The beauty of this is that you can certainly 'keep up' with the writing of the data points in a TDMS file to 50 kHz. You might not be able to display all the points, but there is nothing to prevent you from data processing (by, say, decimating or "block average" it) to a more 'user-friendly' display (your eyes ' sees' a 50 KHz signal?) -you have a set of 100 msec prior to the next package arrives in the queue. Also note that the loop of producer probably takes very little time CPU - most of the time the material is waiting for its clock to 'tick', collection of points in a buffer, then transferring to the loop.
Now you can have your cake and the computer display, too.
Bob Schor
-
Flags Data Points: copy - lack of flags?
I use DIAdem 2012 to extract a FFT points. Whenever I use the function ' copy of flags Data Points: "created channels are missing the last point data (flag). in other words channel contains n - 1 points.
For the moment, I add an additional indicator to make sure I have copy all the flags that I really need, but I got apprcieate all the tips, I can miss something obvious... I have attached a screenshot.
Thanks in advance!
Padraig
Hello
Thanks for posting. I confirm that you are able to put all the flags you need, but that all those flags don't get copied? If that's what you do, you then select flags more than necessary, then copying all the? You may need to browse to re - select indicators and copy them, then start again.


Maybe you are looking for
-
Re: After installing W7, have no more sound
Hello After a clean install of windows xp, I had no more sound, so I thought that maybe with the installation of W7 it will work better, but no sound... I tried a lot of things that I found on various forums, but not solve the problem... The FN + ESC
-
wireless network and for baby monitor
I tried to find a solution for this. I currently have a WRT160 and a Summer Infant Baby monitor. When I turn on the monitor during the night, I can not access my wireless network. When I disable, wireless network is very good. I read somewhere ab
-
also I lost conecction with IE, also my computer when it is stopped down it auto starts in the middle of the night.
-
Hard drive controller is released on the PC need help with setting up new controller
I have a HP with a built NVidia controller on the mobo. The controller was an error and I am installing an Adaptec 2120SA on the system controller. The computer sees the controller and it tries to start the operating system but has problems it Blue
-
Replacement and HP ENVY Sleekbook 6-1014NR for assistance details screen replacement instructions?
Hello Need replacement and the replacement instructions screen HP ENVY Sleekbook 6-1014NR support HP company details?