Image of chart in the report
I can insert the image of a graph of visible front within a report, but I want to insert part of the non-visible graphic on the façade, as legend or title in the report also
Hello
to get a picture of your chart control and add it to a report, you can follow this example and this document.
This, however, will create an image of what is on the front panel. You can use graphics (for example, LegendVisible, CursorVisible...) property nodes to make items of interest visible only when the picture is taken.
I hope this will help you!
Bye!
Licia
Tags: NI Software
Similar Questions
-
integrate image and text in the report
I'm doing a label with a logo at the top left, a chart on the side right (an arrow indicating the direction of flow)
and the text in the body of the tag, so far without success. I tried to use the generation of report vi s to achieve this, but it seems that just the 'standard' reporting rather than on a word one (no Office product on the computer, has no... Works, yech!) limited considerably, although I do not know how the do with the ability of Word template, although I suspect that would make life much easier. I really don't understand what can do the "standard" report When I set the alignment of the Image to add to the report, there is no effect on the placement of my graphics. In addition, it is an addition, which means that I find myself with the image on a label, the text on the other. I want to do is have them both on the same label, the Logo above and the arrow to the right of the text.
I tried a lot of things, including using the generation of reports "Append façade image" and make a cluster that has been written to fill all of the panel before visible, but it was printed distorted and small, similarly Append control image.
The printer is a usb Zebra TLP3842
LV_Pro,
As FAS so I understand it, the alignment entries apply only to HTML format, so they do not affect the Standard reports.
Try to put your logo in the header of the standard report. Then on your front, create a tab control, where you place your text box and graph of arrow in the direction you want to print on the page. Make the background of the transparent tab control and add the image of the tab control to the report. I think that it will be justified to the left little matter what you prefer, so play with the size and spacing of everything until it comes out looking how you want.
-
Linking the chart to the report page
Hello everyone,
I have a pie chart that shows the items according to their category. For example: how many elements we have in Category1, Category2,... What I would like to make relates to the pie chart to the report page that displays items in this particular category. I have a report page that displays all the items, but I want when user clicks on the category of the card, he orders him to this particular category. Please notify.
Thank you
Hello
Change your where clause to
where)
InStr (upper ('CATEGORY'), superior (nvl (: P18_CATEGORY, 'CATEGORY'))) > 0
)
Gus
-
Write name of series in the chart to the report area
I have a sample application created for my use and its accessible via the link
https://Apex.Oracle.com/pls/Apex/f?p=78540:1:106638818610570:
Username and password is apex_global / apex_global
workspace: SHASAPEX
I'm doing an exploration down to a region of the graph to a regional report and when I click on my bar diagram - I want to be able to pass the name label and the serial in my region to report (Variables) - so in my example - I'm hoping to spend say - JUL-14 and eligible Evergreen when click on the blue bar in the region of JUL - 14 , then through java for the link action script, I do an update of my region to report after you have defined the required hidden items
But I don't know - how to pass the series name of my table for the report region - as of now, I have a javascript function to do a pop up of my values passed which shows JUL-14 and 2 when you click on my region example
Thank you
S
Hi Jeff / Mihai,.
Just thought to share my discoveries - has been able to make it work as I wanted (i, e - one query with several series of that) and then click for the series name to dig another report
The reason why this is essential, what I need where I don't know how much of series I'm going to so I'll construct my SQL in a function and return to the region of APEX - this way atleast I would like to know which series is clicked, and I would have to factor the name of set of real criteria SQL into sql report child I did ,
I updated my original with her test area if you want to take a look.
Basically, we need to make a listener on the loading of the page that looks something like (Note: here in static chart region ID is RG1_EVGEXP_BAR)
AnyChart.getChartById($("#RG1_EVGEXP_BAR_chart object").attr("id")).addEventListener("pointClick",function(e){
  console.log(e);
showChartPopup(e);
});
And a separate java script which binds the name of the series and then update my report region is.
function showChartPopup(pEvent){ alert(pEvent.data.Name); alert(pEvent.data.Series.Name); clickEvgExpBar(pEvent.data.Name,pEvent.data.Series.Name); } function clickEvgExpBar(pLabel,pValue){ $x('P1_R2_PERIOD').value = pLabel; $x('P1_R2_EVG_ELG').value = pValue; $('#R2_EVGEXP_CAT_DTLS').trigger('apexrefresh'); } -
Zoom on chart to the report - filter does not report value
Hi, I created a graphic for the type of item. I would like to click the chart element, and it brings me to the report point but filtered by item type. Currently, he clicks through but not filtered by type of item but pulls the whole report.
I'm following the general syntax:
The syntax of the URL of a link is:
f? p = App:Page:Session:Request:Debug:ClearCache:itemNames:itemValues:PrinterFriendly
My specific link of the syntax is:
Select ' f? p = & APP_ID.:2 :'|| : app_session |': P2_hw_type_id: "link,
HT. Model label,.
Count (h.ID) value1
from h, hw_type ht hw
where h.hw_type_id = ht.id
Ht.model group
Where am I missing the operation passes the value clicked in the report?
TIA
Pass information through the parameter is only half of the work, as you have discovered you need to add a clause where clause to limit the rows.
If you want to return the results, if the value is not given, a solution is to use a where clause such as clause:
where mycol. = coalesce (: P1_PARAM, mycol.)
-
Couldn't able to reduce the size of the image while storing in the report
Hi friends,
Im trying to save the image in my table, so that these are the steps that I follow...
First, I created a table:
After this sequence, relaxation and the procedure,.CREATE TABLE "A_IMAGES" ( "IMAGE_ID" NUMBER(10,0) NOT NULL ENABLE, "FILE_NAME" VARCHAR2(4000) NOT NULL ENABLE, "BLOB_CONTENT" BLOB, "MIME_TYPE" VARCHAR2(4000), CONSTRAINT "A_IMAGES_PK" PRIMARY KEY ("IMAGE_ID") ENABLE )
Let me show you the procedure
Everything worked fine, but the following error occurs when im trying to insert an image into a table with a browse button.create or replace PROCEDURE "DISPLAY_IMAGE" ( inID NUMBER ) AS vMIME VARCHAR2(48); vLENGTH NUMBER; vFILENAME VARCHAR2(2000); vBLOB BLOB; BEGIN SELECT MIME_TYPE, BLOB_CONTENT, FILE_NAME, DBMS_LOB.GETLENGTH(BLOB_CONTENT) INTO vMIME, vBLOB, vFILENAME, vLENGTH FROM A_IMAGES WHERE IMAGE_ID = inID; owa_util.mime_header(nvl(vMIME, 'application/octet'), FALSE); htp.p('Content-length: ' || vLENGTH); owa_util.http_header_close; wpg_docload.download_file(vBLOB); END;
ORA-06502: PL/SQL: digital or value error: character of number conversion error
The error above if I include the following line in the source code of my region report...
' < img src = "#OWNER #." DISPLAY_IMAGE? inID =' | NVL (IMAGE_ID, 0) | "" height = "50" width = "50" / > "IMAGE
mainly, I added the above line in my source region only query for the image (size setting)...
If I give the report source region coding as the means below, it works like a charm
:)
But what is the problem with the above code means, as he worked successfully and I can also see the images in the report, but each image is looking too big...SELECT FILE_NAME,IMAGE_ID, dbms_lob.getlength("BLOB_CONTENT") "IMAGE" FROM A_IMAGES ORDER BY FILE_NAME
In order to reduce the size of the image that I gave this line,
' < img src = "#OWNER #." DISPLAY_IMAGE? inID =' | NVL (IMAGE_ID, 0) | "'" height = "50" width = "50" / > ' IMAGE
but if I gave ways online, error is occurring as the image does not store in a size appropriate for the table...
But there, I noticed one thing,
dbms_lob.getlength ("BLOB_CONTENT") 'IMAGE' is normally in a type of NUMBER , and it works very well...
But instead of dbms_lob.getlength("BLOB_CONTENT") 'IMAGE', if I replaced it with *' < img src = "#OWNER #." DISPLAY_IMAGE? inID =' | NVL (IMAGE_ID, 0) | ' ' ' height = '50' * width = "50" / > ' IMAGE means, it is converted to a string...
I think mainly for that alone, it's show error...
How to rectify this problem friends...
I also downloaded this app in my sample workspace,
Please check with this application
application name: region 50787-new report and here is the link http://apex.oracle.com/pls/apex
WS: Mini_WS
United Nations: [email protected]
PWD: mini4i
Thanks in advance
Kind regards
MiniI created a new page 3 which shows how to use the CSS (in the header HTML page) to control the scaling of the images displayed in the reports using BLOB support declarative.
However, you really need to use generated thumbnails to the right size instead of scaling of the images in the browser. If the images used in your demo are for guidance, so they are waaayyyy too big to use in this scenario. This just kill performance on your web server and database and unnecessarily consume massive amounts of band network bandwidth. Your DBA, system administrators, ISPS and users will be very unhappy.
-
Add the label of the axis to a chart in the report of the word
Hello
Is there a way to add a label to the axis of the graph in a word of the report? Thank you!
Tom
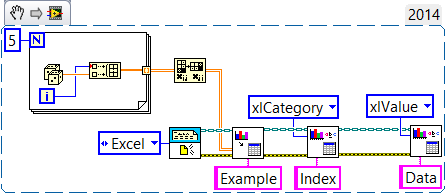
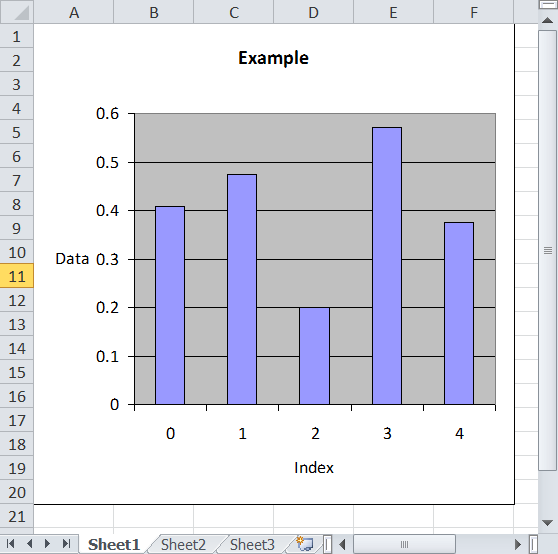
It is of course not very intuitive to use the word graphic Set make vi to set the label of the scale.
Use xlCategory and title of entry to affect the scale label x and use xlValue and title of entry to set the label of scale there.
It would have been nice and easy to add an entry to set the orientation of the text (just adding an argument in the node of the axis title property).
Ben64
-
Label chart in the report generator axis
Hello
can someone help me with my problem?
I need to add labels of the graph axis I've done by the Builder of Labview. Is it possible to do?
I thank very you much.
Patrik :-)
I guess you make the graph in Excel. The LabVIEW Report Generation Toolkit gives you a set of 'hooks' to make an Excel chart - it actually makes an 'object' that has a limited set of formatting options, but is quick and easy to use. If you need a more detailed field, you're probably better write an Excel macro to generate the Excel data plot, then using LabVIEW for sae data to Excel, and then run this "macro tracing' to make the fantasy plot.
However, here's how a conspiracy "simple." The loop For generates data that are plotted (after transposing the data to give a picture of X and an array of Y) with graphic Insert, where I also put the title of the chart. I then specify a label for the X ("category") and value axes, ('Value') with the result the plot shown below.
Bob Schor
-
problems with the date in the chart in the first instance
Hello
I have a date selection field (P2_START_DT), which has a default value in a table
Here's the code I used to set the default (thanks again to the expert for assistance)
Start
Select max (REC_DATE) dt in: P2_START_DT
from TABLE_A;
return: P2_START_DT;
end;
on the same page, I have a report (Type: SQL query) and a chart that takes P2_DATE as a parameter
This is a sample report SQL condition
...
where
RECORD_DATE >: P2_START_DT
This is a condition of samlpe SQL used for the graphics
...
where
RECORD_DATE >: P2_START_DT
condition is about the same for both
My problem is that when the page is loaded for the first time, the P2_DATE field and the report shows good data but my chart shows nothing.
to test, I added a button to submit the page.
When I click on the button both my chart and the report shows the right data... suggesting that for some reason any graph is not picking up the default value for P2_START_DT when the page is first loaded
Please notify.
The default value for your item is not saved in session state until you offer page. When your chart is rendered the first time the value of your object in session state (which makes graphic references) is not defined.
Create a calculation for your section header to set the value of the element in the session before the rendering of the graphics state.
Calculate the point: P2_START_DT
Calculation Point: before header
Type of calculation: (single return value) SQL query
Calculation:
select max(REC_DATE) dt
from TABLE_A;
Condition Type: point value / Expression 1 a NULL column
Expression 1: P2_START_DT
-
I use 14.04.1 ubuntu lts. my version of firefox is 35.0.1 and what update it says that it is the last available.
I fear that the health report shows activity on 13 February, when my computer is on 12 February at 20:00.
is it posible that someone has control over my internet conection and the person is 5 hours of my time zone?
or y at - it an explanation for this behavior of the report health firefox?
Thanks in advance for your help
I am downloading and the image of my screen where it shows my time in the top right of the screen and report on health with two events on Feb. 13.All computers use UTC (Coordinated Universal Time) internally, Greenwich time average aka, alias ZULU, as is called the US Navy. http://en.Wikipedia.org/wiki/UTC
Then the operating system subtracts the UTC offset as indicated in the user settings to the "local time". This shift from 5 hours to the hour UTC indicates the time Zone Eastern North Americam. -
Patterns of data record TestStand 2010 SP1 default shared this cluster in two tables stored as binary data, resulting in two graphs displayed in the report: one for data and one for X data Y. We need the elements X and Y, couples on the same graph. This cluster is marked for logging as a step output variable. It seems possible to add a table "PROP_XYGRAPH" (similar to the PROP_ANALOGWAVEFORM) to the schema to simplify the other treatment after the database record, but how can we get the Builder, to accept this type of data is displayed correctly? XY graphics come from LabVIEW 2013 SP1 exclusively as a cluster of two matrices, usually between 500 and 1,000 items long.
... Geoff.
Hello Geoff,
Had a few resources for you to check. Let us know if none of them work for you.
Inserting an image of LabVIEW Control:
<>http://www.NI.com/example/30736/en/ >
Display of graphics in TestStand:
<>https://decibel.NI.com/content/docs/doc-38945 >
Display of measurement data in the shape of graph:
<>http://zone.NI.com/reference/en-XX/help/370052J-01/tsref/infotopics/measurement_data/ >
See you soon!
-
SSRS 2008 SP4 - header or footer of the report contains the dynamic image does not change
Hello
Our version of Reporting SERVICES to current production is 2008 (not R2). And we have the problem that the header or footer of the report contains the dynamic image does not change accordingly.
According to this hotfix, the problem has been resolved in the last SP R2 and we tested, it works.
https://support.Microsoft.com/en-us/KB/2563216
So we applied the latest SP to SQL Server 2008, however, the problem persists.
However, we do not expect to upgrade the SQL Server 2008 to 2008 R2 for the moment.
Guys have faced the same problem before and has an idea how to solve this problem on SSRS 2008 or any workaround?
Thank you
Kind regards
Dan
Hi Dan,.
For assistance on questions related to SQL Server 2008 and SSRS 2008 SP4, ask your questions here:
https://social.technet.Microsoft.com/forums/WindowsServer/en-us/home
https://social.msdn.Microsoft.com/forums/en-us/home?category=SQLServer
Hope the information is useful.
-
Image of BLOB in the subquery of report
Hi guys,.
It seems like it should be a simple problem, but I can't get this to work.
I have an interactive report, in which I want to display a picture of BLOB columns in view image.
The table contains the details of the project.
Table B contains the categories of projects (including image BLOB and required image columns).
Report interactive sql:
select a.id,
 a.name,
 (select dbms_lob.getlength(b.blob_icon) from table b where b.id = a.category_id) icon
from
table b
In the interactive report, I chose the format BLOB in the image column and fill in the required fields with the details of table b for the image, including columns of type MIME table, ID, etc..
Again... the image column is empty in the report. Am I missing something? It seems that I use it as expected?
Apex 4.2.5
Thank you
Apex-user wrote:
It seems like it should be a simple problem, but I can't get this to work.
I have an interactive report, in which I want to display a picture of BLOB columns in view image.
The table contains the details of the project.
Table B contains the categories of projects (including image BLOB and required image columns).
Report interactive sql:
- Select a.id,
- B.SID,
- (select dbms_lob.getlength (b.blob_icon) in table b where b.id = a.category_id) icon
- Of
- table b
In the interactive report, I chose the format BLOB in the image column and fill in the required fields with the details of table b for the image, including columns of type MIME table, ID, etc..
Again... the image column is empty in the report. Am I missing something? It seems that I use it as expected?
The query as shown is not valid. The projection includes columns of table A, but only table B is referenced in the FROM clause. Publish the actual query.
Why you try to use a scalar subquery here? Is it because table B does not contain a line for each line in the table? In this case, use an outer join. The request must also contain the primary key column referenced in the BLOB format mask:
select a.id a_id , a.name , dbms_lob.getlength(b.blob_icon) icon , b.id from table_a a left outer join table_b b on a.category_id = b.id -
Apex 4.2, display image in the report.
Hi all
I'm a noob here Apex. I came across some problems with image display in a report. When I tried to have a report on a form of simple image download, it works perfectly with dbms_lob.getlength("IMAGEFILE") 'IMAGEFILE', workaround. Interactive report based on my table structure, already established the appropriate sections in report page for make my life easy.
Problem when I tried to create the report of a SQL query combining three tables (Image3, CustomerDB, PATMAN2). The report now generates a page where I can not have any selection of BLOB. The textual part, appears perfectly. I think my sql code is fine, but my generation of form Apex is faulty, but I need help to solve the problems.
-----------------
Here's the SQL code of the image gallery that works very well.
------------------
Select "PUBLICATION_NO."
"FILENNAME,"
DBMS_LOB. GetLength ("IMAGEFILE") "IMAGEFILE",.
"MIME TYPE"
'PDFNAME '.
DBMS_LOB. GetLength ("pdflink") "PDFLINK."
"LASTUPDATED"
"ID".
of ' #OWNER # '. " IMAGE3.
---------------------
And here is the one which does not show correctly the BLOB type.
---------------------
Select PATMAN2.ID as ID,
PATMAN2.PA as PA,
PATMAN2. SUCH as TITLE,
PATMAN2. OTHERS like the OTHERS,
PATMAN2. TYPE as the TYPE,
PATMAN2. PATENT_FAMILY as PATENT_FAMILY,
CUSTOMERDB.COMPANY_ID as COMPANY_ID,
PATMAN2. PUBLICATION_NO as PUBLICATION_NO,
IMAGE3. FILENNAME as FILENNAME,
DBMS_LOB. GetLength (IMAGEFILE) do IMAGEFILE,
IMAGE3. PDFNAME as PDFNAME,
DBMS_LOB. GetLength (pdflink) as PDFLINK,
IMAGE3. MIMETYPE as MIMETYPE,
PATMAN2. CUSTOMER_ID as CUSTOMER_ID
of IMAGE3 IMAGE3.
CUSTOMERDB CUSTOMERDB,
PATMAN2 PATMAN2
where PATMAN2. CUSTOMER_ID = CUSTOMERDB. CUSTOMER_ID
and PATMAN2. PUBLICATION_NO = IMAGE3. PUBLICATION_NO (+)
------------------------------
avman wrote:
Interactive report based on my table structure, already established the appropriate sections in report page for make my life easy.
Sorry, no idea what you mean by that.
Problem when I tried to create the report of a SQL query combining three tables (Image3, CustomerDB, PATMAN2). The report now generates a page where I can not have any selection of BLOB.
Still, it is far from clear what you mean by "that the report now generates a page where I can't have no matter what selection for BLOB".
The textual part, appears perfectly. I think my sql code is fine, but my generation of form Apex is faulty, but I need help to solve the problems.
-----------------
Here's the SQL code of the image gallery that works very well.
------------------
Select "PUBLICATION_NO."
"FILENNAME,"
DBMS_LOB. GetLength ("IMAGEFILE") "IMAGEFILE",.
"MIME TYPE"
'PDFNAME '.
DBMS_LOB. GetLength ("pdflink") "PDFLINK."
"LASTUPDATED"
"ID".
of ' #OWNER # '. " IMAGE3.
---------------------
And here is the one which does not show correctly the BLOB type.
---------------------
Select PATMAN2.ID as ID,
PATMAN2.PA as PA,
PATMAN2. SUCH as TITLE,
PATMAN2. OTHERS like the OTHERS,
PATMAN2. TYPE as the TYPE,
PATMAN2. PATENT_FAMILY as PATENT_FAMILY,
CUSTOMERDB.COMPANY_ID as COMPANY_ID,
PATMAN2. PUBLICATION_NO as PUBLICATION_NO,
IMAGE3. FILENNAME as FILENNAME,
DBMS_LOB. GetLength (IMAGEFILE) do IMAGEFILE,
IMAGE3. PDFNAME as PDFNAME,
DBMS_LOB. GetLength (pdflink) as PDFLINK,
IMAGE3. MIMETYPE as MIMETYPE,
PATMAN2. CUSTOMER_ID as CUSTOMER_ID
of IMAGE3 IMAGE3.
CUSTOMERDB CUSTOMERDB,
PATMAN2 PATMAN2
where PATMAN2. CUSTOMER_ID = CUSTOMERDB. CUSTOMER_ID
and PATMAN2. PUBLICATION_NO = IMAGE3. PUBLICATION_NO (+)
Did you specify IMAGE DOWNLOAD and BLOB format masks for the IMAGEFILE and PDFLINK columns? Select "BLOB" in the column of the number/Date Format attribute, then fill the section attributes of Blob column as requires it.
We cannot solve what we cannot see. We do not have your tables or data so we can not replicate this for ourselves. Please reproduce the problem with an example on apex.oracle.com and developer comments login information for the workspace here.
-
Dynamic image appears in the report of BI
Hello
I developed a BI letter when I display the logo dynamically. I have the image file stored in a BLOB of table field and then download the image using a procedure. I used the URL in my SQL report and changed the text of replacement on the image, but I still not able to view the image.
I created a test in oracel.apex application
PKTEST workspace
user pktest
pass 123test
I checked the old post and is therefore but it does not work.
Solve the problem.
There are several cause to the problem.
to start the process
PROCEDURE SAMPACC. "" DISPLAY_COMP_LOGO "(number p_refno)
is
l_logo blob.
number of l_length;
Start
-You can select one of your own table where you store the image
Select
colo_logo, DBMS_LOB. GetLength (colo_logo)
in l_logo, l_length
from company_locations where colo_refno = p_colo_refno;
owa_util.mime_header('image/jpeg',false);
HTP.p ("' Content-Disposition: attachment; filename =" ' |') Logo ' |' « ') ;
HTP.p ("Content-length: ' |") l_length);
owa_util.http_header_close;
wpg_docload.download_file (l_logo);
end;
/
create a public SYNONYM DISPLAY_COMP_LOGO for
. DISPLAY_COMP_LOGO; Grant execute on DISPLAY_COMP_LOGO to anonymous, public, APEX_PUBLIC_USER
then connect to aid the user in the system database, and then set it to the current schema
for example, Alter session set current_schema APEX_040200
for apex 4.2
change the following function to include the name of the procedure you
APEX_040200.wwv_flow_epg_include_mod_local
After modification, the function should look like this. If you have a false return after start this comment.
function wwv_flow_epg_include_mod_local)
Procedure_name in varchar2)
return a Boolean value
is
Start
--
-Administrator note: the procedure_name input parameter can be in the format:
--
-procedure
-schema.procedure
-package.procedure
-schema.package.procedure
--
-If the input parameter expected is a procedure name, the code IN listing below
-can be modified to list expected procedure names. Otherwise, you must analyze the
-parameter procedure_name and replace the simple code below with the code that will evaluate
-all the cases listed above.
--
If upper (procedure_name) in)
"SCHEMA. DISPLAY_COMP_LOGO') then
Return TRUE;
on the other
return FALSE;.
end if;
end wwv_flow_epg_include_mod_local;
Then, create the sql code
connect to apex select your application-> shared under query components select report and create a query
and call the procedure with parameter example
Select apex_application.get_g_base_href |' #OWNER #. DISPLAY_COMP_LOGO? P_COLO_REFNO =' | COLO_REFNO as company_location COMPLOGO
create a template and insert an image where you want to display the logo.
Select the image and right click and select Format on the property dialog box and the image passes to the last tab and enter the following text in the alt text field
URL: {//COMP_LOGO}
Save the template and upload in your application, then go to the report query and select the model.
You can run this in your application. If you test in the report query report then you must change the #OWNER # of your schema name.
I used my own company site table in the explanation. I created an application in apex.oracle, but it does not work because I can't change the function as
as well as the public synonym creation. Hope this will help.
Maybe you are looking for
-
Why some web pages are marked "cannot access" or "unauthorized"?
Try to delete my email in a list of mail, firefox will not allow the web page to open.
-
My Apple ID can not put Visa card please check my problem
For assistance, contact Support for iTunes at www.apple.com/support/itunes/ww/.
-
How to disable the keyboard in a Web site open in mozilla
Dear Sir.I created a Web site, it works fine, but I want it to be safer there I need to disable the keyboard key... my site is in asp.net c#
-
App Catalog: application installation fails after doctor
I own a Pre3 and I did the app update catalog certificate on time last year. Two weeks ago, that the e-mail application went weird. He reported my new messages as ever and showed them in the list but it have not download the body of the message and h
-
Install the new hard drive to laptop help!
I have a windows 7 HP Pavilion dv6-6170us, with a 750 GB hard drive. I want to install a new hard drive I bought is a 1.5 TB hard drive. Now I have already that I tried to see if it is from the hard drive new larger East and I unplug the old hdd and