property of waveform graph
Hello
I want to reset the offset of my signals with a mechanism simple subtraction, but I want to only do when the waveformchart updates a new page, I use the update mode: scanning.
Is there a waveformchart property to get a Boolean value when it is turned on it starts the chart?
Kind regards
Thijs
HEY buddy,
It is a property of the property node called history data, try using, by default it have 1024 data. Read in while loop if it is greater than 1024, and then do your job...
Let me know if this help
Tags: NI Software
Similar Questions
-
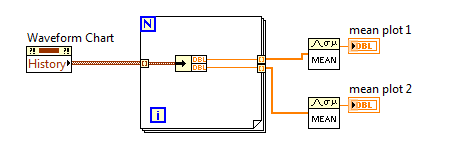
How to get the individual history of the multiple waveform graph plot
I have a table of waveform with several plots, which is a cluster as input.
I want to calculate the average of each of these plots. With simple concession of waveform graph, all I had to do is to use the property in the history of the graph node and pass the history to the generation averaged vi. With the array of multiple locations, I am unable to get the history of each parcel.
The property of the history of the land multi card node is an array of custers, not quite what I need to calculate the average.
How to me history of individual plots?
Thank you.
unbundle just your datapoints inside a loop like this
-
Two background colors for the same waveform graph
Hello guys!
I have a question for you: I am a new user of labview, so please be nice!

So here's the deal: I just created a thanks 4 thermocouple temperature registration program.
In real time, I then have a waveform graph 4 curves as soon as I start my program. And in my program, I had a button that allows me to record the temperature in a file for a period of time at a certain frequency.
So, what I have is: I got my chart of waveform with a black background for example, and once I pressed the button, the background color will be changed automatically to highlight the part of the graph where the record occurs, then the background will return to the black after finished recording. In this way, on the same graph, I could say that registration took place from here to there by looking at the graph. I have two different background on the same graph.
I don't know how to change the background of a chart using the property node, but is it possible to do what I want?
I hope I'm clear. Otherwise, feel free to ask me for more details... I might post my vi if necessary
See you soon
Well, I know this is not exactly what you want to do, but you can try the following.
Change the color of the line on the chart when recording occurs.
You could therefore have a red line, then press on save, then it turns blue, then back to red.
And when that is confusing since you have 4 different lines on the chart 1,
You can change to a red line and a dotted red line, for example.
Would that be acceptable? If so, I can show you how to do this.
-
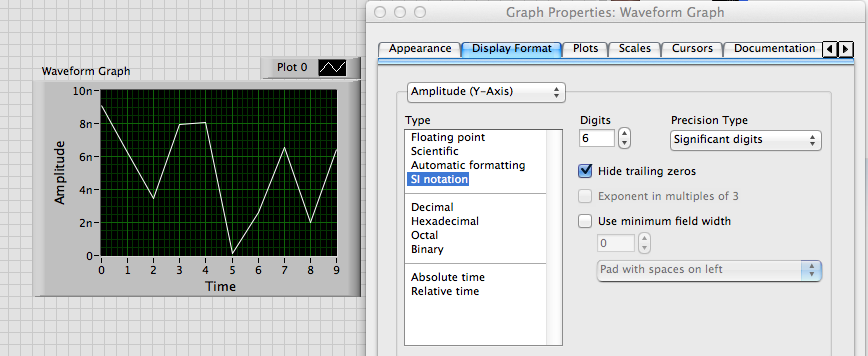
Change the axis label w.r.t. the scale automatically in the waveform graph
Hello
Is it possible to change category axis labels and the value the axis according to the scale automatically? I have a waveform graph which is automatically resized and values on the y-axis of milli, micro and nano volts according to the results of the output from the tests carried out. I need the label of the axis to change automatically according to the scale... Could someone tell me please how to do this. Thanks in advance.
Best regards
Julien
Alain,
I don't know exactly what you want.
If you want to just scale to change as follows: 10n or 5u, use the property format scale IF the Notation.
If you want to change the name of scale label text, you use the YScale.NameLbl.Text property. The attached VI shows one way to do something like that.
Lynn
-
switch between log and linear waveform graph
I have a waveform graph that plots linearly. However, it causes an error during the logarithmic line tracing. Is anyway to create a switch that allows me to change between log and linear plot without creating additional graph?
Thank you
Chris
Use a property node: Y Scale.Mapping Mode. Written 1 to the node passes in logarithmic mode and 0 is for the linear.
Lynn
-
amplitude of the waveform graph
Hi guys,.
could you please tell me how to control the amplitude of a waveform graph. I want the mV amplitude, and I want to control the scale of numbers also.
Thank you
Bill David
Bill David,
You want to manually set all by developing the program or by running program?
For a manual start by turning off Autoscaling on axis Y. Then comes the value end upper and lower values you want.
Programmatically is similar except that you use property nodes. Some properties have names that might be a little confusing, you may need to do some exploration and trial. Context-sensitive help and help detailed will be your friends.
Lynn
-
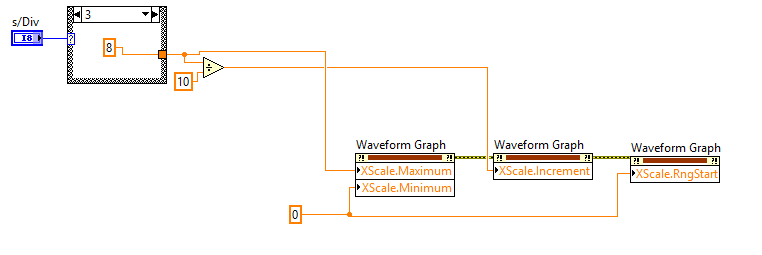
I'm working on a graph of waveform for a project, I want to use a node to control the time of the chart base. It works, but switching during the chart will display more divisions that I designed for a very short period of time, which is annoying. I have attached the vi and I'm appreciated if someone could help me on this problem.
Just found the solution, it seems that I sequence the function of the node of the property or the graph will be confused. Your suggestions has informed this solution. Thank you!
-
horizontal line on waveform graph
Hello world!
I'm still new to Labview, but I am trying to add a horizontal line to a already established "histogram" on my graph of the waveform. How this code works is that it takes a force of a forceplate (this force Exchange) and trace it as a bar to the left of the graph target (it's their strength of target - height represents the amount of force they wish to exercise). Ideally, you would like these bars have the same height (the person exerting the force uses the same amount as their target). To make it a little easier for them to see the target height, I'm wanting to draw a horizontal line at the height of the target, but keep the bar chart so that they can see how far their strength exercised power comes from their target they grow stronger or softer. Is there an easy way to do this? Ideally I'd like the bar chart and line, but if there must be two lines (one for the target does not move and one for the force that would change) which is very good also.
Thank you for your advice and your entries!
Emily
Dear emmaline35,
you use a waveform graph, not a graphic. Graphic does not markers (which would be the most simple solution to mark the extreme).
There is a suggestion that I have not tried: http://lavag.org/topic/11199-adding-a-reference-line-to-a-waveform-chart/?p=67119 (some solitions partially work are suggested earlier in the thread, too)
Suggestion 2) If you need this marker (horizontal) and if your application is not computationally intensive (which does not seem so), I would use a chart and add a horizontal guide. That can be set programmatically: property node > XScale > [MarkerValues] but you will have to replot the graph for each newly received value.
See you soon,.
-
How to connect a cluster of berries to a waveform graph
I'm trying to reproduce the pattern-block which is attached to this issue, but I don't know how I connect the waveform to my clusters of berries. I get an error that "the type of the source is table 1 d of cluster of 2 elements. The sink type is 1 d doubles [64-bit real (precision ~ 15 digits)].
You need a chart xy, not a waveform graph.
(Remember also that this table index is resizable. You only have a single instance. Your photo code is old, ~ LabVIEW 4.0 or MORE)
-
missing samples in the waveform graph
Hello world
When processing a file .wav into pieces, I noticed that there are missing samples on the waveform graph where two pieces must be met for the display. What could be the cause of this? Any help appreciated. Thank you!
Milan
Your method of reading in pieces in a for loop is create a table 1 d of waveforms with the tunnels of automatic indexation. It is as well as what you have the data appear in different plots. I don't know if that's what you want.
But if this is the case, the problem is that you get to the last point of the first plot, and the first point of the next parcel is a different value. Because they are two different plots that you do not get the line to join them, as you do between points that are part of the same plot.
-
Save the Studio measure waveform graph as a file for reading later
Hello
I would like to know if there is an easier way to record data are rendered on a waveform graph (configured as a graphic of the band) to capture incoming data in the code and send copies of it to a file. It would be nice if there was a method to do this, with all relevant metadata stored in the file (color, etc.). Better yet, the file could then be opened in a labview application (for example, a TDMS file) for later review.
Thank you.
PS. I use VS2010 and MS 2010.
So, it looks like you already have all the data points. For metadata that you mentioned, line color, plot colors, point colors, line styles, etc. are all accessible from the properties so if you wish, you can retrieve all that data.
I think that upon return from t0 is the same compensation history, you can use the ClearData() method.
-
Hello
I use the metal theme to design a façade of Labview. I would like to plot x, y of the data on a chart, however, there is only a graphic of waveform and waveform Graph available in the metallic theme. Can you help me in tracing the x, the data is in the curve of waveform in the attached VI?
Thank you
hiNi.
You can customize the graph of the metallic wave and replace it with a XY Chart and set some properties to match the waveform graph
Or let me do it for you
Joint back-saved for 2011
Cross posted at the "Discussion of UI military theme" on the side of the community
-
Hello
I have a question about the waveform graph. My prolbem is that the x-axis of graphic waveform shows only up to x = 0.1 and it does not show the chart more than that, and when I increase the X-AXIS scale in his PROPERTIS (lets say at x = 2), increase the Max on the x-axis (x = 2) but the chart presented to the 0.1! I have attached a very simple code that shows my problem.
Could you help me please? I need the graphics to show me for all values x, x = 0 to x = 10.5.
Thank you
Soran
Hi Soran,
Sorry, your question is still not clear to me.
You hear all the values up to 10? I kept freq = 0.1 and adjusted other values, don't know if that's what you are pregnant.
-
How to display the signal on a waveform graph in Labview Signal Express?
Hello
I want to display a signal in Signal Express 3.0 in a "waveform table", but don't know how to do it and I think that it may be impossible?
In Labview, there are two ways to view data, a 'waveform table' or a 'waveform graph. The great thing with 'picture of waveform' is that it allows you to set a length of history and you can see the data move to the left (option graphic strip) that samples are recovered. It works perfectly.
In Signal Express I can only select "Graph XY" or "Waveform curve" by doing a right-click of the mouse, but I can't select "table of waveform. Is it really true that it is not possible to view data in a graph of waveform "with Labview? (1 analog signal during streaming, 100 samples to read at the rate of 1 K)
Thank you in advance,
Enrique
Hi Enrique.
You are right that there is currently no graphic waveform in SignalExpress. The thing nearest you can join, is saved data under a log and then he looks one when recording (which I know this isn't quite the same interactive behavior).
For your last comment, you wrote 'waveform curve', but I guess you meant 'picture' here as well.
Sorry about that. We recently received this request, then perhaps in a future version.
Phil
-
Is there anyway to rotate a waveform graph, so that I can view them vertically? (the wave moves vertically, rather than left to right)
You vote for this idea on the exchange of ideas, swap axis allow for graphics signals and diagrams intensity (and possibly others)
Maybe you are looking for
-
Hi all, since upgrading to Firefox 25 every time I start Firefox I see briefly what follows in a small window while it is opening. "Ignore the devulcanization change... the general useragent. -What it means and if it is a problem how is it resolved?
-
I just downloaded the latest version of Firefox today because it is necessary for some of the websites that I need for my course at the college level. However, each unique Web site, I'm going to (even the Mozilla of sites, Google, etc.) says that the
-
Bookmark backup saved as type 'File' not JSON. How can I get my favorites?
Recently, I did a reinstall of Firefox. Before uninstalling, I made a backup of my favorites. I don't remember asking for file type, when I made the backup... I guess Firefox would use correct. When I tried to restore the backup after you install the
-
What means the error beep on S3000 - x 4 laptop computer code?
My trusty old S3000 - x 4 just give up on me! Can anyone identify it please an error beep code at startup for me?As soon as I turn on the old brick I get 1 beep continuous for about 3 seconds and then nothing for about 15 seconds then it just of repe
-
Where can I find the files for recovery after that photoshop crashes?
In Photoshop 6 recovering files is automatically opened. In this new version, they do not and I can not locate where they are to open them manually.