RMS measurement over time "long".
Hello
I want to measure the RMS of 'complex' waveforme, so it is quite difficult to calculate from the graph. I use a power - gauge. My proplem is that the result is digitally displayed and the result changes from time to time. the signal is periodic with a time - period of 112ms. is there a way to graphically display the RMS?
THX
Hello stenzer,
I don't know I understood exactly what you want to do, but I think that the functionality you need is the "postprocessor. With this function, you can perform calculations on the results of simulation and display them graphically. You will find the postprocessor in the simulation menu > postprocessor.
Tags: NI Software
Similar Questions
-
Want a ramp of output voltage over time and measure input 2 analog USB-6008
Hello
I want to produce an analog voltage output signal that increases over time with a certain slope, which I'll send in a potentiostat and at the same time I want to read voltage and current (both are represented by a voltage signal) that I want to open a session and ultimately draw from each other. To do this, I have a DAQ USB-6008 system at my disposal.
Creation of the analogue output with a linear ramp signal I was possible using a while loop and a delay time (see attachment). Important here is that I can put the slope of the linear ramp (for example, 10mV/s) and size level to make a smooth inclement. However when I want to measure an analog input signal he's going poorly.
To reduce noise from the influences I want for example to measure 10 values for example within 0.1 second and he averaged (this gives reading should be equal or faster then the wrong caused by the slope and the linear ramp step size.) Example: a slope of 10 mV/s is set with a 10 step size. Each 0.1 s analog output signal amounts to 1 mV. Then I want to read the analog input in this 0.1 s 10 values)
Because I use a timer to create the linear ramp and the analog input is in the same loop, the delay time also affects the analog input and I get an error every time. Separately, in different VI-programs (analog input and output) they work fine but not combined. I searched this forum to find a way to create the ramp in a different way, but because I'm not an experienced labview user I can't find another way.
To book it now a bit more complicated I said I want to measure 2 input analog (one for the voltage of the potentiostat) signals and one for the current (also represented by a voltage signal) and they should be measured more quickly then the bad of the analog signal. I have not yet started with because I couldn't read on channel work.
I hope someone can help me with this problem
An array of index. You want to index the columns for a single channel.
-
Advice on the restructuring of code to avoid the downturn over time
Hi, I am a new user of LabView, you want some advice on how to better structure the program I wrote and which is used to perform a hydrostatic test arrangement. Data are collected on a module of AI cDAQ 9207 and a cDAQ 9474 module is used to control the two valves that subsequently controls pressure in and out of the test Chamber. I enclose my first version of the reference code.
What the VI is supposed to do when the user of the weapon system and strikes then the execution, the program switch will cause a transition of the test chamber through several States corresponding to the levels of different pressure for some time. Time curve vs pressure is written to a file of measures. I built using a state machine structure.
My problem is, during the initial trial, when the duration of the test was about 5 minutes or so, the program went very well. However, once I started to test the length of the actual test of 2.5 hours, I noticed the program running slower and slower as time progressed to the point where it would take several seconds for each iteration of the loop, then by accident about an hour or two in the test. After scouring the articles and messages, I suspect the main culprit is the diagram of waveform and to a lesser extent DAQ assistant.
While I need the loop structure data collection and case to run pretty quickly (preferably the order a few hundred s/s) I need the code to be able to react to changes in pressure in the room quickly enough, the actual data, that I need to store and display the graph can be as slow as a sample per second or even longer. My guess is at this point that I have to rebuild the program using some sort of architecture of producer/consumer, I'm looking for some advice on how best to structure the program.
Data acquisition obviously belongs in the producer loop that will run at a fast enough pace and there will be a consumer loop that will run at a much slower pace for the Bulletin Board writing to the extent of the file vi, but where should I put the case of structure state machine which currently controls the valves? Should put in the loop of the producer since it must run at the same fast pace as the collection of data, so it can react to changes in pressure or should I build another loop of consumer for him? What other indicators (pressure and Boolean) and controls on the front panel, they should be on another loop operating at a medium speed I want to respond to a faster pace than the data to the chart/write the loop, but they do not need to be as fast as the data acquisition loop?
Finally, I'm not quite sure what would be the best way to reduce the sampling rate of the data that I have in fact appear on the graph and the store in the file, it wouldn't make sense to create another task of measurement that samples at a rate below just for that purpose. Suggestions and advice would be greatly appreciated! Thanks in advance!
Bob
My guess is that if you monitor the use of memory over time, you see that going up, Yes? Everything is is always a good idea to get rid of the express VIs, I would look for the problem of slowdown in the structure of the case. You repeatedly open and never close tasks which are created using some DIO channels. Hnece each time that the loop more memory is allocated. Try to move creating channel screws out of the loop, then the tasks are created once before the start of the loop and then written to as required inside the loop - and don't forget to delete tasks once the loop over.
Mike...
PS: You are right with your comments regarding the structure of the producer consumer. Basically it break up as things get quickly (DAQ IO) that there is in a loop, while the user interface and the stuff that can take a long time (such as the data record) are in another loop. You can even have three loops with one for the acquisition of input data and the other for the digital output.
PPS: Finally don't forget that even if the structure of consumption of the producer is usually represented with everything in a single diagram, there no need to be. I wrote a lot where each loop is in his own VI which is run dynamically, then the application starts.
-
Measurement of time in a While loop
Greetings gentleman;
I'm kinda new to Labview, and although I sought an answer without assignment, I wasn't able to find one.
So here my question, I would like to know how I can measure the time a loop sequence, in other words, what time is my point of view VI to run the main loop together?
A little explanation, the attached VI tries to be a Markov chain, it takes some values in the first case structure based on the previus loop, then, if the values are correct, it passes to the next step and so on. It's pretty simple, and yet, my problem lies in the measurement of time. Since it is a 'distribution', it would take infinite time to execute a simple loop if it does not fulfill the characteristics, but it is scheduled to meet them so an average time should work.
So, if you look to the while loop, should the big one, I want to measure how long I take for a ride.
Thanks for the help, I'd be happy to read some ideas on how to measure this.
Kind regards
IRAN.
You will find examples in the example Finder OR by searching for 'speed test' or ' reference '.
Essentially, you create a flat sequence structure inside of your loop. In the first image, you measure the current number of cycles. In the middle frame, you run your code. In the last image, you measure the number of cycles again and subtract the first number of this. This gives you the run time to execute the code.
You can see a page of the community about it here.
There is a high-resolution time tick count VI hang out somewhere which is great for benchmarking and improving efficiency, used instead the number of cycles (ms) primitive.
Edit - remember where he was

-
Measure the time between two digital pulse
Hello
For a non-critical calendar application, I need to measure the time interval between consecutive TTL pulses, ranging from the order of 0.5 s for a few seconds, with a low accuracy of +/-10-50ms. The interval being measured varies between the rising edge of the first pulse and the front of the next and so on.
I have several input lines I need to deal with. Because it's a critical machination low cost, I don't want to use digital counters for each line, so I work with an acquisition of data USB6008 and have connected the input rows TTL on the digital inputs of the device. Avoiding will be sufficient.
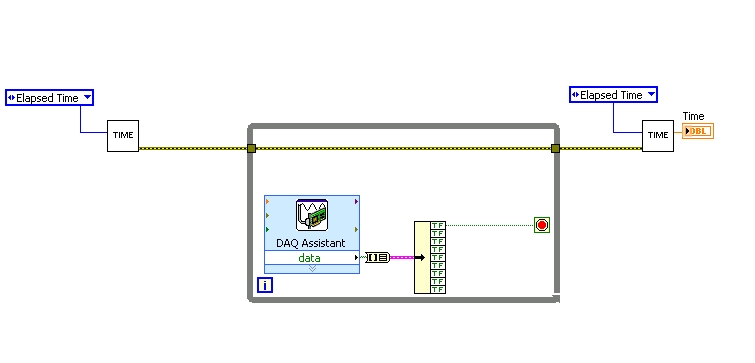
I found a good example of VI on discussion forums that does almost the same thing, only it uses instead of the DAQ Assistant user input. The VI works including the time the program going on in a while loop. I replaced with the DAQ Assistant output (a channel) user input in the hope that it is still work.
When I run the program in "run once" mode, it seems to work perfectly. However, in "continuous run" it measures only a very small interval, probably just the time between two samples. I think it has something to do with the help of a while loop in combination with the DAQ Assistant. Anyone who has any suggestions how to solve this problem?
Thank you!
OK... first of all, you should never use the button "run continuously. I wish that NEITHER would be to eliminate it, but told me that it is sometimes useful for debugging. If you want your program to run over and over again, use a while loop with a stop"" button.
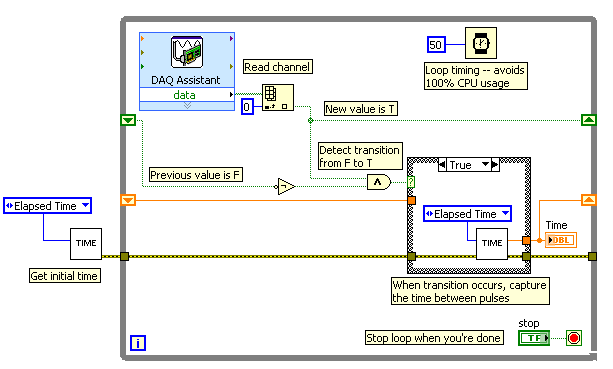
If I'm reading your code correctly, you make your initial moment, and then collect data from data acquisition. When one of the channels is "T", you stop your loop and the end time of capture. (By the way, why you convert your table to a cluster? Why not just index the appropriate channel in the table directly?)
Since you want to capture the time between two consecutive pulses, you need to know when a transition has occurred... i. e when your digital line went from F (no pulse) to T (pulse start). This will give you your forehead. Right now, all you're doing is looking for a value T - so you have no way of knowing if you are looking for to the previous impulse again, or a new impetus. You also burn 100% of your processor with the way you have your programme in place.
You need a small loop delay so that your VI is not 100% of your hogs CPU time. Given that you can live with an accuracy of 50msec, what I suggest that you use.
See attached picture for you give an idea of how to implement. He will probably need some refining operations, but it should point you in the right direction.
I hope this helps.
-
I2C communication slows down over time using USB-8451
Hi all!
I try to communicate via a device slave using a USB-8451 I2C and I noticed that after a while the communication speed slows way.
I can send and receive data very well and apparently my system seems to work. But the problem is that over time the speed of data transfer slows down so much so that if I let it run all night it has slowed to a crawl in the morning. My ultimate goal is to gather data, draw and save every second and at the beginning it is easily achievable, but after 10-15 hours I can no longer collect data as fast I need. I'm not quite sure if this is a problem with my code LabVIEW, the NI USB-8451 box or the slave device. But if I stop running the LabVIEW program and start it again, everything returns to normal.
The slave device is a personalized card with a microchip PIC which acts as a slave I2C and returns the data at the request of the master. I can't imagine anyone will be able to determine if this is a problem directly, but if we can rule out the other two (code LabVIEW or the NOR-8451) as the source of the problem so I know it's my slave device.
I've greatly simplified the LabVIEW code that I used to collect data on I2C and I see even this gradual slowing down over time. Attached, it's that the very simplified VI and the data file, it produced. I only ran it for about 45 minutes, but from the beginning to the end we see again that the enforcement timeframe is rising.
I hope I'm just doing something stupid, thanks in advance!
-Aaron
Aaron,
Do not have the additional module responsible for these functions, but I'm sure I know whats going on. It seems that each time through the loop 'OR-845 x I2C Create Configuration Reference.vi' creates a new reference. After a while it will start to slow things down. Better to open the reference before the while loop starts and spend just the reference in the loop. Don't forget to close the reference after the loop stops.
-
Svchost size seems to me like svchost (s) becomes larger and larger over time (between restart).
original title: svchost size
It seems that svchost (s) becomes larger and larger over time (between restart).
He/they tend to reach the top of the sort (PWS) in memory of my task manager.
It automatically get rid of her... whatever... it is now for use by more than one process (when they are no longer used)?
If not, is there a way for him to say?
Hello
Sometimes you try more than once (the link of MVP) and there may be a site
issue.Try this link to my profile
https://MVP.support.Microsoft.com/profile=D2CBAC3A-D59A-4085-BA97-22B57FD00DF2Here is the link to the signature
https://MVP.support.Microsoft.com/profile/Rob1I tried to answer the question in paragraph 1 above. Unless you encounter
a kind of system problem the SVChost in Taskmanager will vary, in particular
so shortly after a restart. And when you use the computer SVChost entries will be
adding and removing management tasks on the fly. Check the information in the upper part
two links in my previous answer.I hope this helps and happy holidays!
Rob Brown - Microsoft MVP<- profile="" -="" windows="" expert="" -="" consumer="" :="" bicycle=""><- mark="" twain="" said="" it="">
-
How to retrieve the value of a measure over a period determined using VROPS 6.1?
Hello!
Is it possible to extract a metric, using supermetrics for example or any other means, the value of a measure over a period of time?
For example, I will pick up average CPU usage of my VMs during the last hour with VROPS 6.1?
How could I do that please?
Concerning
Unfortunately, you are just such a feature (apply the calculation over a period of time) is not supported.
-
Since the installation on my Windows 7 64 - bit installed, Firefox has constantly gotten slow that hour passes, hangs for 10-15 seconds at a time and just gets worse over time with updates and all. It was fast when I installed first, but of the six latest mos has slown to a crawl.
upgrade your browser Firefox 8 and try
-
Can I create a spreadsheet to track events over time? If so, how?
Is it possible to use the numbers to track events over time? Dates would be the only numbers you use.
Can you give more details on what you are looking to do? Surely you don't want only a column of dates...
SG
-
Hallo,
I use the following system:
- OR PXI-1044 with controller NI PXI-8109
- OR PXI-2564 switch module to turn on the monitor of my test device
- Data acquisition multifunction NI PXI-6259 to measure the signal that responded to the questionnaire jump
The two cards are the same - PXI trigger bus. For both, PXI-2564 and PXI-6259 I use DAQmx to set the reading and writing of the channels.
Now, I want to measure the time between the digital output, my unit turns and the analog input, which measures the response of my system.
I can't do work by myself, please help me!
I thank Ludwig.
Hi Ludwig,.
If you can't give us any VI we have difficulties with to help you.
Because I Donat knowledge how your program is mounted it is not easy to know where you should enter signals.
Here's a question similar to yours:
http://forums.NI.com/T5/LabVIEW/best-way-to-measure-time/TD-p/178704
and 2 external links:
http://www.ehow.com/how_8698983_measure-time-LabVIEW.html
http://objectmix.com/LabVIEW/385152-how-can-i-use-LabVIEW-measure-time-between-analog-pulses.html
-
Plotting the amplitude of a spectral peak over time
Hello
I am creating a VI where the acquired continuously DAQ, plots and save a waveform in millisecond delay (which is already done in this case), then takes this waveform, finds a specific pic (probably the first) and trace the amplitude of this pic over time (+ 30 minutes, one point each scan which is obtained). Essentially, I have a detector quickly attached to a chromatograph, and I want to select a single ion and monitor the amplitude of this ion. I can draw the waveforms along with it in post processing, but I want to do is to have the 'slow' constantly plot to update and display when it moves through time. Joined the VI will go in, using IMS software V1.3.vi, the paragraph is the "GC" Mode it seems I should use the "peak detect.vi.", but I'm not familiar with this operation, and so I don't know how to show a constantly updated graphic or remove the amplitudes and draw. Thank you for your help,
<><>
Eric-WSU wrote:
I get an amplitude on plot of time, but it does not appear until after all the iterations are stopped
I have not watched your VI (because I'm in a previous version of LabVIEW), but it's probably because your graphic is outside the loop.
Here's how you can get a graph of the peaks (all vertices, by iteration):

Or if you want to only a certain PEAK (and how this pic changes with the number of iterations):

-
Hi, I have two decimal strings, each of them contains the numbers change over time. I want to plot them on the graph XY, a string for each axis. Can you show me how do?
This is not a formula, but a constant simple schema of a table complex. Wire remains, then do a right click of the terminal of the initializer of the feedback node and select "create constant. That should do it.

-
Measure the time between the ridges of the periodic input signal
We have built a circuit which is supposed to mimic an Exercycle. We have an IR switch and a spinning wheel, the rccb meets a comparator circuit and the output of the element of comparison, we have running in LabView. We successfully were able to measure the number of rotations of the wheel and the total distance travelled by the wheel, but are struggling to measure speed. We cannot find a way to measure the time between picks in real time, which we could then divide the wheel circumference and calculate the speed in real time. The VI I posted has a square wave simulated rather than the signal we receive on our circuit. Thanks in advance for the help.
Jon and David
I think you're overloading the things trying to get the time between two pulses. Instead, you can use the VI Express your measures and select frequency for her custom. Then, you can multiply the circumference of the wheel of the frequency to get the speed.
I hope this helps.
-Christina
-
full waveform graph to calculate the area under the curve over time
Hello
If please find my attached VI and help me please for integration to get area undercut for my chart of waveform.
I would like to find my wave power wind energy production chart oever within one month of time.
I think I have to integrate to get the area under the curve and so I m now using tool integrated into labview attached.
As I did not wait years for my result and so I want to make sure that the tool that I m using is correct.
Please advise me what method I will use for my chart.
Dominique says:
I would like to integrate my table of power over time (table of power is on each interval of a minute) and the entire graph is one month. So, I'll put dt = 1?
You put dt at some units you want in the final result. If you want Wh, you want dt in hours. If the spacing is currently a minute, you can express in fractional hours and use the result as dt. Try dt = 1/60.
Maybe you are looking for
-
I'm going to Turkey for several months and I wonder if I can buy a peg now or should I wait until I'm going to Turkey and buy the accessory it.Is there anything else I should buy until I leave. Thank youcokdeli
-
is there a rear camera on 6 16 GB ipod?
is there a rear camera on 6 16 GB ipod?
-
RmDev mean? Revimentor devices?
-
"choose the program you want to open this file" always comes up when I want to download something, and no matter what I choose, it will not download. frustrating... can anyone help pls.
-
New Z3 double with 6 monts warranty
Hello Distributor sold me new (?) Xperia Z3 double with only 6 months manufacturer warranty. Because of the shorter warranty I bought cheaper. Now I wonder if perhaps more short warranty to connect somehow with service history or renovated status. Is