full waveform graph to calculate the area under the curve over time
Hello
If please find my attached VI and help me please for integration to get area undercut for my chart of waveform.
I would like to find my wave power wind energy production chart oever within one month of time.
I think I have to integrate to get the area under the curve and so I m now using tool integrated into labview attached.
As I did not wait years for my result and so I want to make sure that the tool that I m using is correct.
Please advise me what method I will use for my chart.
Dominique says:
I would like to integrate my table of power over time (table of power is on each interval of a minute) and the entire graph is one month. So, I'll put dt = 1?
You put dt at some units you want in the final result. If you want Wh, you want dt in hours. If the spacing is currently a minute, you can express in fractional hours and use the result as dt. Try dt = 1/60.
Tags: NI Software
Similar Questions
-
Calculate the average over the last 12 months
Hello
I am trying to calculate the average value per customer and per month from and including the month and 12 months back
for example: 1 January 12 = average (agreed_rate) & (process_rate) average from February 1st, 11 'and 1st January 12'.
February 1, 12 = average (agreed_rate) & (process_rate) average of 1 March 11 'and 1 February 12'
March 1, 12 = average (agreed_rate) & (process_rate) average of 1 April 11 'and 1st March 12' etc.
create table (test)
cust_num varchar2 (5).
month, date, time,
number of agreed_rate
number of process_rate);
insert into test values ("A001", January 1, 11 ', 87, 65);
insert into test values ("A001", February 1, 11 ', 56, 62);
insert into test values ("A001", March 1, 11 ', 76, 88);
insert into test values ("A001", April 1, 11 ', 45, 69);
insert into test values ("A001", may 1, 11 ', 99, 65);
insert into test values ("A001", June 1, 11 ', 98, 43);
insert into test values ("A001", July 1, 11 ', 87, 70);
insert into test values ("A001", August 1, 11 ', 43, 99);
insert into test values (' A001', ' 01 - SEVEN.-11', 62, 32 ');
insert into test values ("A001", October 1, 11 ' 89, 44);
insert into test values ("A001", November 1, 11 ', 34, 65);
insert into test values ("A001", December 1, 11 ', 87, 87);
insert into test values ("A002", January 1, 12 ', 33, 65 ");
insert into test values ("A002", February 1, 12 ', 56, 23 ");
insert into test values ("A002', March 1, 12 ', 76, 46 '');
insert into test values ("A002', April 1, 12 ', 67, 69");
insert into test values ("A002', may 1, 12 ', 99, 33");
insert into test values ("A002', June 1, 12 ' 89, 21");
insert into test values ("A002', July 1, 12 ', 87, p. 77");
insert into test values ("A002', August 1, 12 ', 69, 99");
insert into test values ("A002', '' 01-SEP-12, 89, 32");
insert into test values ("A002', October 1, 12 ', 43, 20");
insert into test values ("A002', November 1, 12 ', 34, 56");
insert into test values ("A002', December 1, 12 ', 77, 78");
JAN-12 e.g. agreed_rate average = (33 + 87 + 34 + 89 + 62 + 43 + 87 + 98 + 99 + 45 + 76 + 56) / 12
FEB-12 average agreed_rate = (56 + 33 + 87 + 34 + 89 + 62 + 43 + 87 + 98 + 99 + 45 + 76) / 12
The results should be displayed per month (like the example above) and cust_num.
Can anyone help?
Thank youYou must go to the current line, that is included as twelfths a form 11 months.
If you round the result is 67,42 67,41 rather than. This is the result on all the cust_num.
If you want to the result for each customer comment just the partiton of clause.SELECT cust_num, month, agreed_rate , round (sum (agreed_rate) OVER ( --PARTITION BY cust_num ORDER BY month RANGE INTERVAL '11' month preceding ) / 12,2) AS avg_agreed_rate FROM test ORDER BY monthPartition on cust_num
SELECT      cust_num, month, agreed_rate
,      round (sum (agreed_rate) OVER ( PARTITION BY  cust_num
                                ORDER BY month
                   RANGE
                   INTERVAL '11' month
                   preceding
                   ) / 12,2) AS avg_agreed_rate
FROM       test
ORDER BY  month
Published by: chris227 on 01.02.2013 01:51
the corrected table namePublished by: chris227 on 01.02.2013 01:52
-
Need help to calculate the difference between times
Hi all
I have two fields that stores just the hour in 24-hour ex: 08:00 and 20:00 now I want to calculate the difference between two times
Kindle help me
Thanks for your help
Thank you
RaviHello
diiference in hours
SQL> WITH T AS (SELECT '08:00' ST_TIME, '20:00' END_TIME FROM DUAL)
  2  SELECT (TO_DATE (END_TIME, 'HH24:MI') - TO_DATE (ST_TIME, 'HH24:MI')) * 24 DIFF_HOURS
  3    FROM T;

DIFF_HOURS
----------
        12

SQL>
G.
-
Advice on the restructuring of code to avoid the downturn over time
Hi, I am a new user of LabView, you want some advice on how to better structure the program I wrote and which is used to perform a hydrostatic test arrangement. Data are collected on a module of AI cDAQ 9207 and a cDAQ 9474 module is used to control the two valves that subsequently controls pressure in and out of the test Chamber. I enclose my first version of the reference code.
What the VI is supposed to do when the user of the weapon system and strikes then the execution, the program switch will cause a transition of the test chamber through several States corresponding to the levels of different pressure for some time. Time curve vs pressure is written to a file of measures. I built using a state machine structure.
My problem is, during the initial trial, when the duration of the test was about 5 minutes or so, the program went very well. However, once I started to test the length of the actual test of 2.5 hours, I noticed the program running slower and slower as time progressed to the point where it would take several seconds for each iteration of the loop, then by accident about an hour or two in the test. After scouring the articles and messages, I suspect the main culprit is the diagram of waveform and to a lesser extent DAQ assistant.
While I need the loop structure data collection and case to run pretty quickly (preferably the order a few hundred s/s) I need the code to be able to react to changes in pressure in the room quickly enough, the actual data, that I need to store and display the graph can be as slow as a sample per second or even longer. My guess is at this point that I have to rebuild the program using some sort of architecture of producer/consumer, I'm looking for some advice on how best to structure the program.
Data acquisition obviously belongs in the producer loop that will run at a fast enough pace and there will be a consumer loop that will run at a much slower pace for the Bulletin Board writing to the extent of the file vi, but where should I put the case of structure state machine which currently controls the valves? Should put in the loop of the producer since it must run at the same fast pace as the collection of data, so it can react to changes in pressure or should I build another loop of consumer for him? What other indicators (pressure and Boolean) and controls on the front panel, they should be on another loop operating at a medium speed I want to respond to a faster pace than the data to the chart/write the loop, but they do not need to be as fast as the data acquisition loop?
Finally, I'm not quite sure what would be the best way to reduce the sampling rate of the data that I have in fact appear on the graph and the store in the file, it wouldn't make sense to create another task of measurement that samples at a rate below just for that purpose. Suggestions and advice would be greatly appreciated! Thanks in advance!
Bob
My guess is that if you monitor the use of memory over time, you see that going up, Yes? Everything is is always a good idea to get rid of the express VIs, I would look for the problem of slowdown in the structure of the case. You repeatedly open and never close tasks which are created using some DIO channels. Hnece each time that the loop more memory is allocated. Try to move creating channel screws out of the loop, then the tasks are created once before the start of the loop and then written to as required inside the loop - and don't forget to delete tasks once the loop over.
Mike...
PS: You are right with your comments regarding the structure of the producer consumer. Basically it break up as things get quickly (DAQ IO) that there is in a loop, while the user interface and the stuff that can take a long time (such as the data record) are in another loop. You can even have three loops with one for the acquisition of input data and the other for the digital output.
PPS: Finally don't forget that even if the structure of consumption of the producer is usually represented with everything in a single diagram, there no need to be. I wrote a lot where each loop is in his own VI which is run dynamically, then the application starts.
-
Is it possible to generate an output voltage on a DAQ 6009 A0? I have a data excel sheet that I put in a 2D array. The voltage is not constant over time. I have problems with the synchronization of the signal. I was able to trace the signal on a chart. This is the same as the original data to excel. I have two data streams. Voltage and time. But after separating the two signals how can I generate the graph?
-
Hey!
Doeas someone knows a way to check the property opacity over time? I need something more than. activeAtTime()
found this
App.Project.Item (index) .layer (index).propertySpec.valueAtTime (time, preExpression)
-
Calculate the correct/snapshot time
We have statspack runs every 10 minutes - so there's a fresh snap_id STATS$ SNAPSHOT to (for example) 10:00, 10:10, 10:20, 10:30 and so on.
When there is a problem with the database, was asked to calculate various statistics immediately, as well as to display the corresponding statistics of the time equivalent a week ago. Of course, the problem could arise in (say) 10:12. So I sort of know that I would be interested in snapshots 10:10 and 10:20 last week.
I can't just around my current sysdate for the next 10 minutes, however, because some databases could take regular pictures every 20 minutes, every hour or every half hour.
So is there a generic part of SQL that would take my current sysdate, look at his STATS$ SNAPSHOT and train dynamically what are the two correct snapshots in use from around the same time a week previously, please? The rule simply being you get back exactly 7 days, then will find two clichés of the time closest to the combination current hour/minute.
(Yes, on a database where the snapshots are taken every hour, if it is 10:12, I would be interested in snapshots of 10:00 and 11:00; if photos have been taken average about half an hour, I would look to find the 10:00 and 10:30; and if they are taken every 10 minutes, I'd be trying to find the 10:00 and 10:20 ones).Hello
To find the nearest snap_times before and after the point exactly 7 days before the date d:
SELECT     MAX (CASE WHEN snap_time <= d - 7 THEN snap_time END)     AS prev_snap_time
,     MIN (CASE WHEN snap_time >= d - 7 THEN snap_time END)     AS next_snap_time
FROM     stats$snapshot
;
If it is found be a line exactly 7 days before, then that date will be returned as prev_snap_time and next_snap_time.
Once you know the exact time of pick up, you can get the values of those moments.I hope that answers your question.
If not, post a small example of data (CREATE TABLE and only relevant columns, INSERT statements) for all of the tables involved and the results desired from these data.
Explain, using specific examples, how you get these results from these data.
Always tell what version of Oracle you are using. -
How can I move the CRA over time default text?
I have placed "Default Text" on a separate video track. In the video, a hand is oriented along an arc for 1.5 seconds. I want the text to follow the CRA that the hand moves.
I stumbled on how to do this all by pointing and dragging various things in the framework, then I screwed up the edit and CTRL-Z got myself back to a better point AND I LOST THE ABILITY to do so.
While it worked, I would see my text in its framework, and the center of the image has a cross. By positioning the scrubber at the beginning and ending points, there was a line drawn from the cross to the text. The starting point was a line showing the starting position, the point of arrival had it showing the end position.
Now, when I try to move the text, I get one of two things (none of them work for my plan):
(1) I have the window "Settings" open and the pointer tool is used to fix the position of the text in my "Default Text" setting.
(2) I'm moving the entire frame in the preview window and the cross moves with it.
I stumble on something and I don't know how I got there.
Thanks for any help you can give.
Me: 64-bit Windows 8.1, Adobe Premiere Elements 13
billsbayou
Great news. Great job.
Timeline clip selection, Panel applied effects tab/Applied effects Palette/movement extended to get across (to zoom) and properties of Position (panoramic view).
That's where I was pointing you in my previous post when I wrote
But if everything you want to do is to move text along a path in Premiere Elements, which can be done Motion Keyframing scale (to zoom) or
Position (panoramic view) / probably better using this framing key to the Position property. Have you tried yet?
There is always another way... creating keyframes for Position at the level of the "elastic" timeline, orange line that scrolls horizontally on a video editing or audio clip. More info on another time if you are interested.
But, at present, a lot of progress.
RTA
-
How to calculate the polynomial graphic adjustment of waveform
Hi all
I am new to lab - view so would need a little assistance in one of the problem I have right now.
My problem is: how to calculate the polynomial graph of waveform data adjustment? I need to convert the waveform to XY graph data, and then use the polynomial vi made integrated to calculate the fitting?
Detail: My problem is that I have waveform graph, I calculate the vertices and the Valley, but because of the noise, my peaks and Valley detection is sometimes not exact, so to smooth the chart that I must apply the polynomial fit.
If anyone can help me in this, I'll be very grateful.
Thanks in advance
Hi Omar,.
have you seen the suggestion of Lynn above?
You already have the values of Y (your table). Now, you need build the table of X as indicated, only to replace the value of dt with your spacing from point to point. Somewhere in your code, you know that the value that you have an x-axis indicated in milliseconds...
-
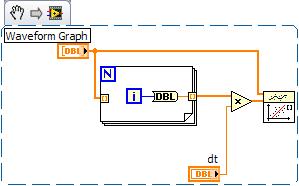
change the dt on a waveform graph
Hey guys,.
Im trying to create a graphical representation of the temperature over time, currently using a graph in the form of wave. I want the user to be able to select the interval that the temperature reading is held and the level which is considered to be a noteworthy event. I have the level and random data by plotting the curve on the same graph, which is a start, now I'm trying to get the interval between readings to reflect in the axis of the x.
I see the graphic waveform always incriments by any reading, this works very well if the measurement interval is one second, but if the user selects 2 seconds I want the next value on the x axis for incriment by two.
I found something that has a value of Y and a value of dt (waveform of the construction), I'm sure that im using wrong by sending a single value at a time. is there a way to do what I want to do?
Ill post a screenshot of what I have, thanks for any help
Ben wrote:
-
Hello to you all, useful forum fans! :-)
I implements an array of tape showing the values of several parameters in real time, using a waveform graph, but during the race he keeps resetting of the history of the card at irregular intervals. Unfortunately, because it is for my work, I can't post the code. I'll do my best to describe the problem and the installation program, however.
I have a data acquisition loop to read the values in real-time in a table of the floats and stores it in a global variable functional memory data buffer that contains a table 2D of floats, a 'page' of floats by time interval. This forum works at 50 Hz through the expectation of millisecond Schedule VI.
I then a chart update the loop running at 10 Hz via forward schedule VI. This loop reads the data of all samples buffer VI he has accumulated (usually 5, but sometimes 4 or 6) and converts it to an array of waveforms through the VI of waveform build by taking each column of data and by assigning to it, definition dt to 0.02 (50 Hz), and parameter t0 to time less dt current multiplied by the number of samples in the table. The terminal waveform graph is then set to this table of waveforms.
Most of the time that it works well, with the new values added the previous values to create a smooth graph of multiple plots with the correct values are displayed. However, sporadically the chart Flash empty and begin to fill again from scratch. I can tell is just jump in time (the axis of abscissa) because I can move the axis scroll bar and there is no other data to scroll.
I in addition to these two loop loops a GUI-structure of the event and a task of State machine loop. However, I have excluded these two loops ownership history of the graph through inspection and breakpoints. This is why I can only think that there are conditions or the type of data which, once introduced in terminal results of the graph by adding DO NOT present data as usual. Empty array is not the answer; I tested with a separate simple test VI, and therefore in the chart, keeping the currently displayed data but do not update new data.
I would appreciate any idea what any of you have as to the possible causes of this behavior. I apologize again for not being able to view the actual code, although I can work to establish a similar setup with the data buffer, etc. in a separate VI and after that. Also, I would like to know if you want me to describe the other logic, settings, or the circumstances for you.
Thank you very much for your help!
-Joe
Whenever I've seen this problem when you use a waveform he chart endded up being a problem with;
(1) the number of parcels has changed.
(2) the names of the plot has changed (WF attribute).
(3) time info Goffy where t0 and dt were inconsistent with what was already posted (new data point a t0 that is earlier than what is already plotted this plot)
It's a pain to figure out the first time.
Ben
-
Calculate the average per slot?
Hi Chaps,
I am a beginner on numbers (almost everything on Mac I would say) and I need help to calculate average values.
These are calculated values (column 2) taken on a specific time of the day (column 1).
I managed to create a third using a built-in function to get the time slot (column 3).14:58:42
235
14
14:59:42
274
14
15:00:50
7937
15
15:01:55
5157
15
16:02:57
1822
16
16:03:57
207
16
Can please somebody see me step by step how to calculate the average by time slot as below?
14
254,5
15
6547
16
1014,5
Kind regards
Stone
This can help you

Assuming you data in a table named 'Data' and the information is summarised in another table (right) named "Summary".
Select cell B1 in the summary table and then type (or copy and paste from here):
= SUMIF(Data::C,a1,Data::B) ÷COUNTIF (Data::C, a1)
shortcut for this is:
B1 = SUMIF(Data::C,a1,Data::B) ÷COUNTIF (Data::C, a1)
Select cell B1, copy
Select column B, paste
-
Hello
I use the metal theme to design a façade of Labview. I would like to plot x, y of the data on a chart, however, there is only a graphic of waveform and waveform Graph available in the metallic theme. Can you help me in tracing the x, the data is in the curve of waveform in the attached VI?
Thank you
hiNi.
You can customize the graph of the metallic wave and replace it with a XY Chart and set some properties to match the waveform graph
Or let me do it for you
Joint back-saved for 2011
Cross posted at the "Discussion of UI military theme" on the side of the community
-
How to calculate the periods that overlap between two or more given the date range?
Hi all
If there are several durations then how we can calculate the period of time that overlap between these times.
For example: for 3 time periods. 03/12/2015-16/08/2015, 05/01/2015 to 31/07/2015 and the 06/09/2015 to 30/11/2015, how the overlap period can be calculated?
There are many potential unknowns in your question. For example, you want to count any overlap at all? If two dates overlap, what matters? Overlap - each of them?
In any case, here is a solution that counts how many periods are overlapping in any point in time... She, of course, using temporal logic. You can then use ValueAt(), WhenLast(), WhenNext(), etc. as appropriate.
Assume that your model has a child entity called 'the period' with name 'all time periods' relationship and basic attributes 'start date of the period of time' and 'date of end of period of time'.
In your example:
an entity should have the time period start date = 03/12/2015 and the date of end of period of time = 16/08/2015
another entity might have the time period start date = 01/05/2015 and the date of end of period of time = 31/07/2015
another entity might have the time period start date = 06/09/2015 and the date of end of period of time = 30/11/2015
To find the number of overlapping over time, we want to count or entities that have an active period, so the rule is perhaps the sum:
the number of overlapping = the number of all the periods for which it is true that the time period is active
How do we know a time is active? This is the time logic comes in. He is active on or after the start date or no later than the end date:
the time period is active if
TemporalOnOrAfter (the date of beginning of period of time) and
TemporalOnOrBefore (date of end of period of time)
That's all. Now, you can perform a temporal visualization of the 'number of overlapping' and you'll see it rise and fall over time. As a reference, he said that the number of overlapping = 3.0 from 06/09/2015 across 31/07/2015.
I hope this helps. You can use the same model to count periods of time functions, but you end up having to use the most logical date. You of course can count the total number of entities and compare this number of overlap over time to see if they overlap, but I digress...
-
Calc. custom to return a percentage of the number of times 'Yes' is returned in other areas.
Hello
I have a number of areas that require a Yes, no, n/a answer in a drop down. Then I need to auto calculate the number of times 'Yes' is selected, divided by the number of Yes and No of (but excludes the addition of the na in the denominator). Numerator = Countif("yes")/denominator = Countif ("Yes" or "no").
Thank you
OK, then you can use this code as the calculation script custom of the field where you want the result to appear (PC MCKTOTAL):
var totalYes = 0;
var total = 0;
for (var i=1; i<=5; i++) {
    var f = this.getField("PC MCKRow"+i);
    if (f.valueAsString=="Yes") {
        totalYes++;
        total++;
    } else if (f.valueAsString=="No") {
        total++;
    }
}
if (total==0) event.value = "";
else event.value = totalYes / total;

Maybe you are looking for
-
Mac pro book cannot open a session vertical lines sometimes change a dark blue screen It came once and then the screen went crazy with different vertical lines When I try to sign in with my password it initiates, but then it does nothing
-
Need help about Remoteapp outside the local network (2008 R2 Std)
Hello We have installed and configured all the 4 services (RDGM, RDLM, RDWA, RemoteApp Manager). Inside the lan, all published remote applications work correctly but When accessing the log on credentials wan are invited on several occasions. We use a
-
I received this email, which poses as Windows Live mail, but I doubt that it is legitimate. Is there a support email, that I can give him, so you can check? Here's the e-mail: Windows Live team Topic: UPDATE! (FINAL NOTICE) Date: August 31, 2011 10:
-
Just around the beginning of July (2011) I started to have remote Office questions when connecting from home to work. If I minimize the connection for a while and come back later, it will be often does not. I'll have to hit the close X button several
-
I am running windows vista home. I seem to have lost the ability to copy a file from one place to another or to rename a file. Or I can create or rename folders. I can open a file and save it under a new name. Does anyone have ideas, what would ca