Rotate the Plot chart legend of XY
Is it possible to rotate the legend of the plot for the plot names letters run from the bottom to the top rather than in the whole of the operator interface?
The names of my plots are bigger and I need to show at least four plots at the same time. Put the scales to the right/left/above or below without rotating can cause a short XY Chart!
Any ideas for me?
Concerning
Waris K
Hello
I don't know if there is a native way to do it, but you can 'cheat' to do this:
You can move the table where the captions are, or even make the table turn into lines instead of the column.
Is the idea ok for you?
Tags: NI Software
Similar Questions
-
Insert the 3D chart into a PowerPoint presentation
Hello world!
I would like to insert a graphic 3D object generated with LV in a Powerpoint document. So far, the copy of a static image isn't a problem, but I would like to power pan/rotate the 3D chart. Any idea?...
Thanks for your help!
CC
In LabVIEW, right-click on your 3-d chart and choose CW3DGraph > Style export to export the graphic style to a file. Then go into powerpoint and choose View > Toolbars > Control Toolbox. On the right of the low side is the area for additional controls. Select this option and select the CWGraph3D object. Drag a box on the powerpoint slide and the graphical object should appear. Right-click on the object and go to control CW3DGraph (National Instruments) and select Style Import and select the style that you previously exported. When you run your slide show, you will have the opportunity to rotate/etc that you have imported style.
Marcus
-
How to control the direction of expansion of a XY chart legend
Hello
I adjust the number of plots by using the property node "Legend.Number of Rows (LegNumRows)" a XY Chart. I wish that the legend spread in the horizontal direction (right). I can choose the direction of expansion or growth of the legend on the front panel using the point of the scale on the right edge of the legend, similar to a table. So far so good. But the problem arises when the number of plots (LegNumRows) property drops to 1 or 0. What I mean is: I have 3 parcels on the legend laid in the horizontal direction. I run the application. Then I reduce the number of parcels programmatically (using the LegNumRows property node) to 1. Finally, I increase the number of plots again to 3. This time the legend grows / grows in the vertical direction. But I want him to stay in the horizontal direction.
Is it possible to do this?
As a side note, I discovered that the legend is in fact an array of clusters. I discovered by first customize the XY Chart, then customize the legend. But still no luck. Is there a way to programatically change the internal objects of a control to run?
I'm curious to know if there is any programmatic elegant solution to this problem. I appreciate any help or idea.
Thank you.
Burak Soysal
You can create a custom control and replace the control with your own image that corresponds to the background. Then place this control on extra legend items to hide. It's a little hard to describe so I made you an example:
When running, the cover of the legend merges with the background and the legend.
I did a Boolean, then went to advanced > customize. I copied then a section of screenshot that I took of the edge of a legend in to replace the normal Boolean image. Put this value just right, you can cover one end of the legend and if you disable the Boolean value the user will not be able to click on it. When you need more or less than the element 1 legend, you can hide the Boolean value programmatically.
It takes some tinkering with the photo (I used the paint), but I bet you can get it right if you spend time on it.
-
Legend of the plot does not update?
My legend of conspiracy will not show the new names I'm wiring. It displays the default plot 0, track 1, and so on, rather than the column headers it is supposed to read the data file.
Any ideas? See the attached VI and the associated text file that I am trying to trace.
In the example you have validated, your table for the colors of the plot is empty if the because the loop will not run.
-
Can I detect a change of name of plot event in a legend of the plot?
I want to update a configuration file, if a user changes the name of a conspiracy in the plot legend.
Events, I see plots are: value change, the change of range autoscale, plot attribute change and change of range of scale.
Change of attribute plot doesn't seem to understand anything like on behalf of the parcel, and others obviously do not contain this info either.
Is it possible to recover this event?
Thank you.
Jordan
First of all, remember that there is no simple way to encode anything, so I can offer a possible solution for you, but it certainly isn't the only one.
LabVIEW has no property to check if the name has been changed through a structure of the event, but you can create your own LabVIEW can read events. I found this really good which may help you. Read this and mess around with it and see if it gets you anywhere: Creation of user events
Once you get to trigger the appropriate, then its just get this deal to update the file you want.
Another possible workaround solution that isn't ideal, is to create a chain control and who have to be on top of the name of the parcel. You would be able to produce then an event in this chain, change the value.
I hope this helps.
-
Hide the Excel using LabVIEW Report Generation Toolkit or active chart legend
Hello Eveyone:
I'm working on tool report generation in labview and creat excle report. I create the chart in the report, but I can't hide the chart legend or change the font size using the report generation tools.
I appriciate you guys time.
Thank you
Howdy!
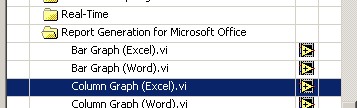
What version of LabVIEW Report Generation Toolkit you use? Did you take a peek at the .vi LabVIEW example column chart (Excel)
and he looked at using the Excel insert graphical VI and Excel graphic Set do?
-
This VI (ftp://ftp.ni.com/pub/devzone/epd/201150.vi) works exactly as I want to apply for a 8.6 at-, but the property node used in the example is no longer supported.
I can add/remove sites and resize the legend of the plot with 8.6 using the 'LegNumRows' property, but this property does not behave in the same way.
It seems like it should be simple, but I must be missing something.
Thank you to confirm that this property does not work in the same way as in the example when it is used with a XY graph clusters and no dynamic data.
I left the property node in the structure of the case (just as it was in the original example) while not to jam too when you went to compare two examples - my application does not for the reasons you stated.
I will implement a legend Manager to ensure the follow-up of the plots in the legend.
Thanks for the validation test!
-
Hello
I recently migrated my Flex 3.2 to 4.5 Flex application. I use a few cards in my application. I noticed a strange problem when I run my application with Flex 4.5. The legend of my piechart is not visible. The text is visible but the colors beside the text is invisible. The application works fine in Flex 3. Can someone help me in this regard.
Thanks in advance,
Nirmal Kumar Blues
Thanks for the reply.
in any case, I got the answer. My legend appeared once I commented SeriesInterpolate I used as an effect to the pie chart. Need to check how it works in Flex 4.5.
Thank you
Nirmal Kumar Blues
-
Change the "Default" location for the chart legend
Hello
By default, when you create a natalLa legend appears to the right of the chart itself. As a society, all our legends are upstairs. Is there anyway to set the default location of albums rather than right?
Thank youHi Baqpuss,
You should be able to edit the files cxml and pcxml that are used by Corda Popcharts to set the default value.
You will find the files that will be of interest to you:
C:\OracleBI\web\app\res\s_oracle10\popbin
C:\OracleBI\web\app\res\s_oracle10\chartsupport
C:\OracleBI\web\app\res\s_oracle10\chartsDon't forget to make a backup before you change them. Once you have completed your changes, you must restart the BI server and the presentation service.
For more information about editing the files, see the reference document. C:\OracleBI\corda50\docs\graph_reference\graph_reference.PDF
I recommend you to create a chart type custom rather than change the existing chart types.
John Minkjan has done a bit in this area. See his blog for more details: [http://obiee101.blogspot.com/search/label/CORDA]
-Joe
-
the names of the plots on the chart and use these channels in the menu of the ring
Hello everyone!
I table 1 d which is more a cluster of 2 elements: one is a number and other string. These string contains the information on the name of signals. I connected this table 1 d to reshape the array with a dimension of 10. Then the consistent table is connected to the table in the cluster. This cluster has led is still naked to get the name of the plots. The problem is that I don't want these 9 unbundle blocks to get the name of the plots. Is there anyway I can do it without use of unbundling 9 times. I though that the use of loop for or while loop, but I need some suggestions.
So I have two questions:
How to get the name of plots is without using unbundle so many times?
Second is how to display the names of these plots on my menu ring?
I must have missed something, I didn't see any large cluster on your drawing. Change this large cluster in a table, because there a lot of the same element. Then proceed as attaché.
-
Secondary axis on the WPF chart
Hello
I'm tracing a secondary value axis on my WPF chart. I have a graphic linked to a table of AnalogWaveform
of objects that I change during execution. This table can be different sizes depending on the user's selection, however assume that there are two types of data to the chart. I would like to match a data type of my main axis and the other guy to my axis is secondary. For example, I have four AnalogWaveform
opposes the plot, two of whom are in Hz (primary) and the other two in Volts (secondary). According to the documentation, I need an additional of
element under my definition of . What I have is:
This adds a second value axis to the left of my main axis. What I need is for this axis which will be located to the right of my chart and somehow to draw each
AnalogWaveform on the right y-axis. I build my locations in the code as follows:
_graph. Plots.Clear ();
RawData is my AnalogWaveform[], built in advance based on a response from the server
foreach (AnalogWaveformwaveform in RawData)
{
If (waveform! = null)
{
field = new plot (waveform. ChannelName);
parcel of land. DataContext = waveform;plots. Add (Plot); plots is a simple list
}
}_graph. Plots.AddRange (studs); Add locations to graph
_legend. ItemsSource = plots. Add locations to the legend
Any help would be appreciated on how to do it.
Thanks in advance.
To position your second Y axis across the graph, set the
Locationproperty on the axis ofFar.To associate a plot to a default axis, set the
VerticalScaleproperty on the ground in the axis value is appropriate. -
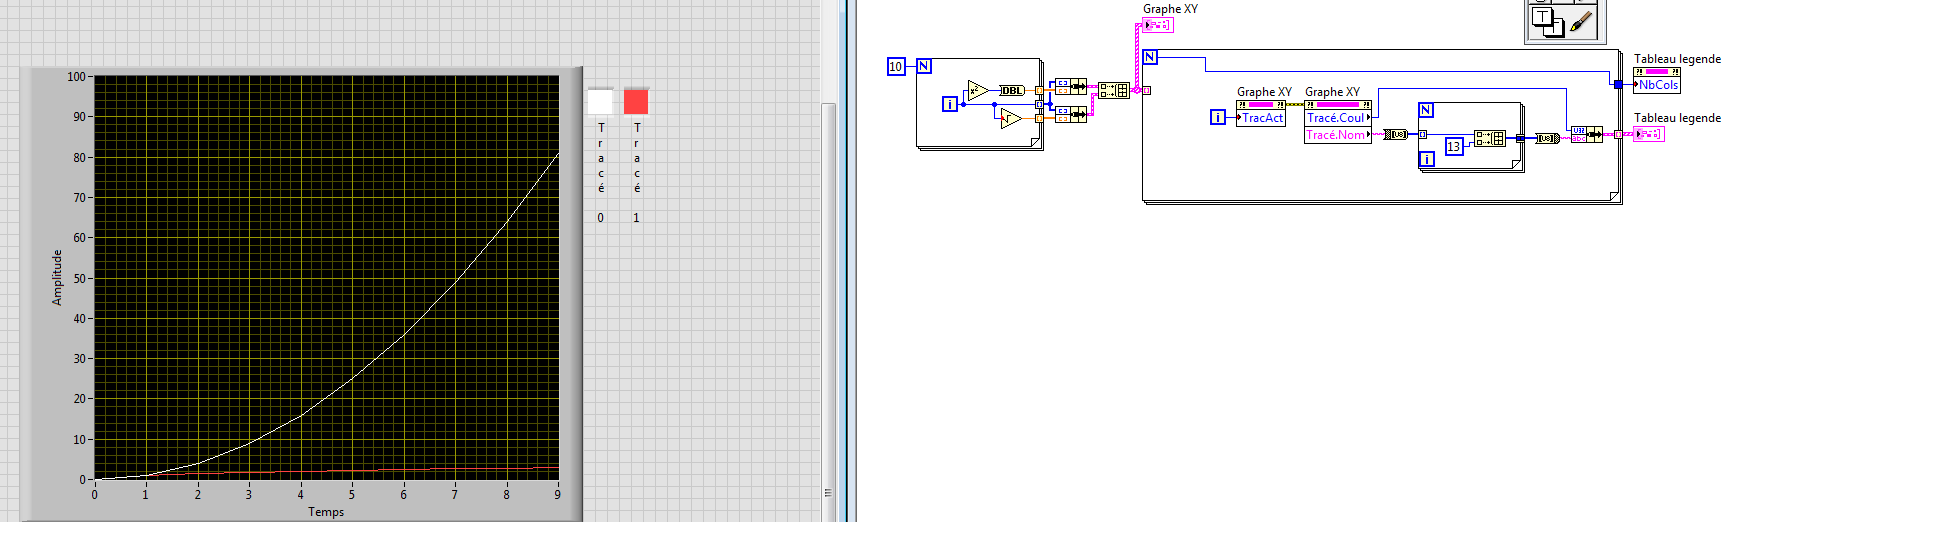
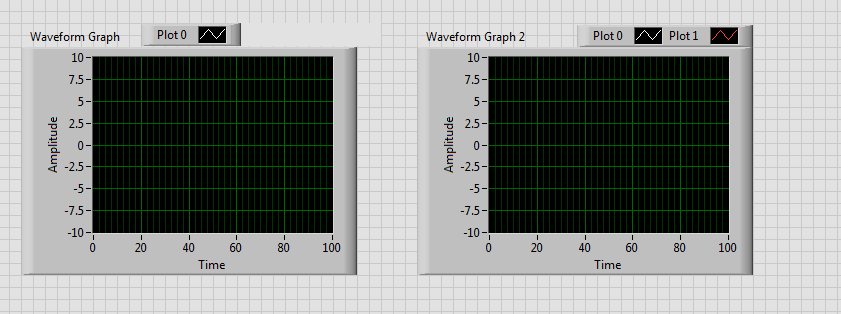
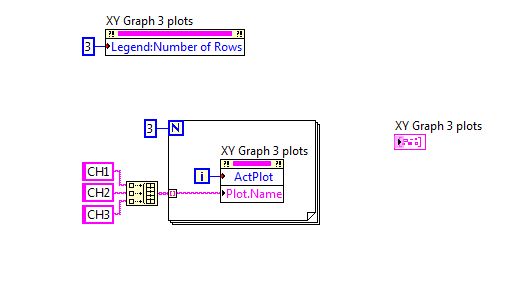
Dynamically manage the names of legend by using nodes of property
I have to draw several temperature - time data on a XY Chart. Now traced works perfectly fine, but when I try to stup the legend name using property nodes, it gives error if I use something like in the first picture. It seems that the "ActPlot" property cannot access values greater than 1. Works perfectly although for two plots.
I tried to use one for, as in fig. 2, it does not work. It blocks every time ActPlot hits 2.
Suggestions or advice?
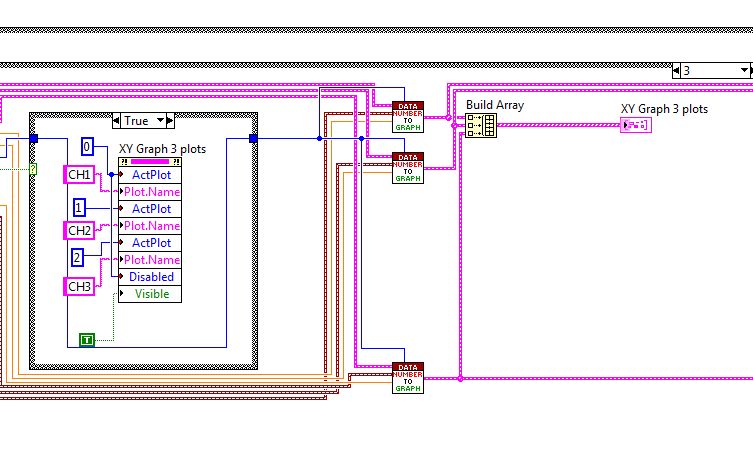
Hey,.
Please test the attached VI (registered to 8.2) to define the names of the plot, use it as a Subvi.
BTW, in your second picture you have connected 3 to the connector of the loop for AND and autoindexed table with 3 elements.
Christian
-
synchronization of a listbox and a chart legend
Hi all
I'm working on a code where I would be able to select/deselect 50 locations on a XY Chart. Due to the relatively large number of field names, it makes sense to place them in a scrolling caption or listbox.
Problem is (AFAIK), the legend of the parcel can not be used to * easily * plots do disappear and appear with a single click - must right click, go to colors and select transparent, etc. and then reverse the procedure to return the plot.
An alternative might be to use a list box 10 long lines as main indicator, then use some of its properties to create a dynamic chart borrowed from a second hidden chart legend. This legend of the plot to reconfigure its colors of dynamic line/symbol based on where the user is in the scrolling list box.
A problem I encountered is that the Label.ScrollPosition property is not going to write an indicator for me. See the code example.
Top row provides comments in the list box, but not enough information to do the job properly.
Any thoughts?
Kind regards
Ted
Hi to know the position of the list box item...
Try this...
> -
Hello!
There is a simple XY Chart with legend on attacched photo; in the legend, the index display is visible. I would like to read the index by a knot of property or something like that, but I'm not able to find the appropriate property node or a way to do it programmatically in my VI.
Any suggestion?
Thank you
Antonio
Hi Antonio,.
I don't think that display index legend could be used in such a way, because the index in legend display helps us tell what index plot the legend is not as input. Maybe using a table / control ring containing the name of the parcel could help you achieve the same result. Here, I have attached an example for you. Hope this helps.
-
How to force a refresh of the plot
I'm trying to load some data from a text file and it draw 2 different contour (3d surface plots). Inevitably, the first time that I load the file after that I open the VI, crass conspiracy does not refresh. However, the plot very well done. I don't know if it's a matter of timing of the completion of all the data of the file loading, or what. I tried to re-wiring son error to force the sequence and tried sequential structures. Nothing seems to work and I can't find a control for me to force him to cool off. Anyone know what could be going on here? I have included the 2 required VI and an example of text file. Can someone help me out here?
Thank you
Chris
Hi Chris,
I ran your code with the enforcement tool point high (light bulb next to the pause button in the run menu - sorry if I've just insulted your intelligence, but not sure about your experience with LabVIEW). I noticed that the variables local just outside the structure of sequence would first update with values 0.0 then the code could perform the function of file as well as the previous code dialog box this feature. Given that local variables were called first in LabVIEW and updated with zeros as opposed to data acquired from your text file, the result is a track of course empty.
When you run the code a second time, locals have since been updated with the correct values, which is why you get the plot.
I have attached a screenshot and a .vi of my suggestions for what you can do to ensure the update of these local variables at the appropriate time and allow the data to chart at the interpolation of course in the first run. I hope that this solves your problem. If this isn't the case, please let me know.
Also, I will take a lot of heat from other programmers out there if I did not at least mention that using multiple local variables throughout your .vi can be problematic in the sense that it can be difficult to properly manage the data flow and can lead to the frustration of troubleshooting. There are certainly better alternatives, but I thought you'd rather have a quick solution for now and worry not about cleaning up the code later.
Hope this helps,
Cory
Maybe you are looking for
-
How to upgrade an iphone 4 that will not be updated
How to upgrade an iphone 4 if it used to let me update
-
My Firefox's normal opening page disappeared. I is a page with about 12 Web pages in the small windows that are links to my frequently used sites. Some of them are the Wordpress administration pages, and I need them to access my sites. How can I get
-
HP Photosmart 5520 - analysis problems
10.9.2 OSX HP Photosmart 5520 Connected wireless to the MacBook Pro. Have been able to search more than a year. But suddenly the scan does not work. (Error message: Communication cannot be established). I tried to uninstall and reinstall. Now the but
-
Send the message under the sign of the Subscriber in the menu
After a Subscriber signature in the unit, he or she has the option to send the message by pressing 2. The pulse is «...» Spell out the name and then... » Is it possible to change not only this prompt, but also the search option to be the FIRST and LA
-
Doesnot work of digitization of the NAC
Hello; I got the website tenable nessus plugins, and downloaded on the nac manager then tried to apply the plugins in the installation of plugins, but I have found nothing is there any cli or installation process I must perform a operation of nessus