Waveform control
Please see attachment. I recently picked up a project for which the previous developer is therefore more around. I have virtually no experience with LabView before be introduced in this project. I read 'LabView for all' and comfortable with the basics of programming.
The existing VI uses a waveform to generate tension in order to operate a set of mass flow controllers. My problem is that I can't open and manipulate the waveform. I have improved the hardware on the system and therefore, manipulate these signals to adjust to improve the system.
Does anyone know how to open or manipulate the attached? I assume that it is a file that has been converted to a file only readable/executable for LabView use in VI. I searched the rest of the computer to the original file, nothing helps...
If you can't help with the attachment could you please direct me to any documents that could teach me how to build one such controller of waveform?
Thank you
Bradley
When you said that you can not open and manipulate waveform, I took this to mean that you could not read the file. Based on what you're saying now, you can open the file as follows the waveform. You just need to change the waveform. Two different things.
What to do to the waveform? Or what type of waveform you trying to create? There are many functions in the range of Signal Processing, and with a simple manipulation, as the scaling, you can also use the arithmetic functions.
Tags: NI Software
Similar Questions
-
tables of fixed size in FPGA compilation error - how to implement a waveform control in an FPGA?
Hello
After being stuck for two days, please let me briefly describe my project and the problem:
I want to use the cRIO FPGA for iterative control of waveforms. I want to capture a full period of the waveform, subtracting a reference waveform period and apply control algorithms on this. Subsequently the new period of correction must be sent again for the output module OR. If it does not work, the captured waveform will look like the one reference after several iterations.
I am planing to create an array of size fixed for the capture and the reference waveform (each around 2,000 items for a given period). I use so 2 paintings of each elements of 2000. I use the function 'replace the subset of table' to update each element captured in the loop sampling and a feedback for each table node to keep in memory (I also tried shift registers, but then the berries do not have a fixed size any more and I can't start the compilation process).
If I try to compile the FPGA vi, I get the following error:
Details:
ERROR ortability:3 - Xilinx this application runs out of memory or met a memory conflict. Use of current memory is 4167696 KB. You can try to increase physical or virtual memory of your system. If you are using a Win32 system, you can increase your application from 2 GB to 3 GB memory using the 3 G switch in your boot.ini file. For more information, please visit Xilinx answer Record #14932. For technical support on this issue, you can open a WebCase with this project attached to http://www.xilinx.com/support.
"Synthesize - XST" process failedBefore I added berries to my code I could compile the FPGA without problems. So, it seems that the tables are too big for the FPGA. :-(
Therefore, I would like to ask if there is perhaps a better method to implement my problem in LabVIEW FPGA? How could avoid the tables to save my waveforms on a period?
Thanks a lot for your help in advance.
Best regards
Andreas
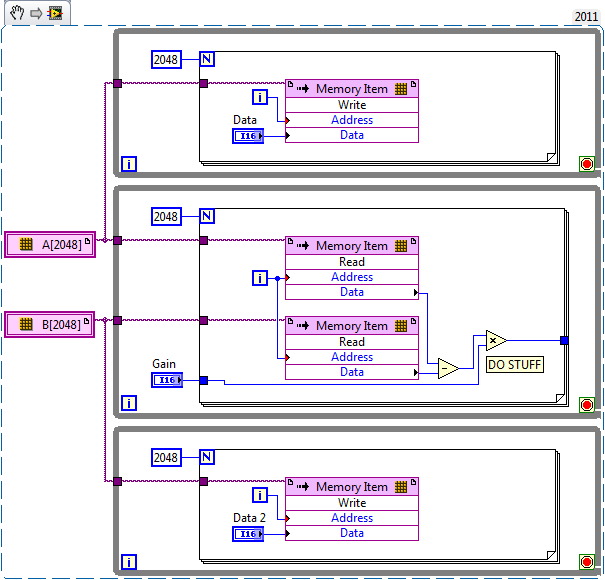
Unfortunately, the LabVIEW FPGA compiler cannot deduct stores shipped from berries (yet). When you create these two large paintings, you are creating essentially several registers very, very large. Just by looking at your picture, I guess that there are at least 4 copies of each of the tables.
You want to use LabVIEW FPGA memories instead. You can create memories outside the loop and then read/write them where you are currently referencing the berries. The only change that you really need to do is to break down your treatment in scalar operations. I have attached a simplified version of your plan, I hope it helps. Let us know if you have any other questions.
-
Graph waveform control - limit lower and upper limit Autoscale
The graph is a waveform their a way to define the lower limit of the graph Y to zero and then have it autoscale the Y maximum limit as a percentage of the maximum value of the graph (150% for example)?
Direction of examples or read about a starting point would be great!
Thank you
Joe
Ireland
Turn off autoscale and put the max with a property node based on the max of the data table.
-
Update of waveform outside under VI
Hello
I have a fairly complex (for me!) program with several sub VI, pressure measurement loop calls main VI a VI void is a while, each value is plotted on the graph of the waveform is measured in real time. I want to display this graph in real time in the main VI. However the table of waveform in the VI main shows only the last delivered value of sub VI after the sub VI has finished its execution of the loop.
Is there a way to configure the waveform table in primary VI to only show data in real time to know duplicate what the table VI of void?
Thank you
It seems simple enough.
Refer to the map of waveform control (by right-clicking on the graph > Create > reference) and place it in the main VI Subvi. The sub VI must have a point of order of the same type. Within the Subvi, you can update data using a property node. If you want to update the chart in each iteration of the loop, use the node property inside the loop.
-
How to transfer data from waveform for a sub vi
I'm seeing plots in a Subvi when I want. In my test, the waveform in the main VI display several plots of channels as I expected, but the Subvi shows only a single parcel. Joint programme.
I can simply convert the dynamic data in table 2D Digital to display several plots, but I will loss the timestamps I really want to show in the plot than in the main program.
Thank you
hrwang wrote:
Thank you. I tried to follow your instructions.
In fact you have not. You did not create an indicator of waveform bays to copy onto the Subvi bays of waveform control. See attached Subvi that I modified.
However, it still shows a plot in the sub vi and plot begins time 0. The new program is attached.
This is because you have created a table 1 d double which means only 1 field and no data delay
I think that the 2D table are necessary to have several plots.
No. a table 1 d of waveforms can be used for several plots.
I want to run the program for the day, so it is convenient if I see the date/time in the x axile, like the one in the main program, instead of from the time 0. Dynamics of the data type is complicated and I don't want to deal with its structure, that's why I use a waveform as a control chart, hoping the information all dynamic data is transferred to the Subvi plot properly. Apparently, it did not work.
If you don't want to use dynamic data, then do not use the DAQ assistant. The DAQ assistant, is what gives you dynamic data. I see that you did to a conversion of DDT in a table 1 d of waveforms, which is good. Now you just send this table 1 d waveform to the Subvi. Because you used a table 1 d of doubles in the Subvi, you have a conversion point.
All solutions?
Thanks again.
-
See block labeled "digital data" in my attachment for reference. Currently, we can consider that the point of digital data for the current time step (it is removed before the following appears). However, I like it showed all the samples in the table as in the example that appears on this link under "digital waveform control":
http://zone.NI.com/reference/en-XX/help/371361H-01/lvconcepts/fp_controls_indicators/
Thanks a lot for your suggestions! I am new to Labview, so I appreciate your help.
Hey westerman111,
If you are looking to produce your display includes information of the previous steps of Solver solution, you'll need to buffer the previous data. How to implement this in a loop of Simulation of design by & control uses the Memory.vi under control design Simulation & > Simulation > utilities > Memory.vi. It will allow you to save previous information generated in the simulation for letter simulation environment.
I've attached an example that should help you get started using the Memory.vi.
I'd also sure that what you are trying to achieve is suitable for the control loop & Simulation. I know you said that you were new to LabVIEW, so I wanted to make sure that you went to sea in the right direction. Is there a particular reason, why you use the control loop & Loop Simulation instead of a standard time or a forum? The loop control design simulation & is unique in that it calculates the solution of a dynamic system to a no prescribed time and the ODE solver. It also provides tools to interact with the model you solve during execution. However, if you are looking for measurements (instead of the simulation of the dynamic model) and data acquisition I advise to use the standard features of LabVIEW.
Here are a few useful references for the departure with the two LabVIEW Control Design and Simulation Module.
Tutorial: Introduction to Simulation (Control Design and Simulation Module)
http://zone.NI.com/reference/en-XX/help/371894G-01/lvsimhowto/sim_h_gs/
Getting Started with LabVIEW
http://digital.NI.com/manuals.nsf/WebSearch/ba2fb433a7940e7a862579d40070cc2c
-
The code attached is supposed to focus on a cluster and read the name and the data type of each control of the cluster. When I put a timestamp control in the cluster it returns its data in the form of wave type, I thought timestamp has its own data type. I need to get the type of correct data I use this to a database. I need to be able to tell the difference between a timestamp data type and a waveform, because I do not want to insert a data with waveform data type in the database in the form of stamp and I do not want to insert a time stamp in a place where the waveform data must be. Any ideas?

One of the subVIs is password protected, and it is the one that generates the error.
Using the properties class ID and the name class seems to work OK, producing ID = 60 and the class name = AbsTime for the timestamp and ID = 47 and name = WaveformData for waveform control.
Lynn
-
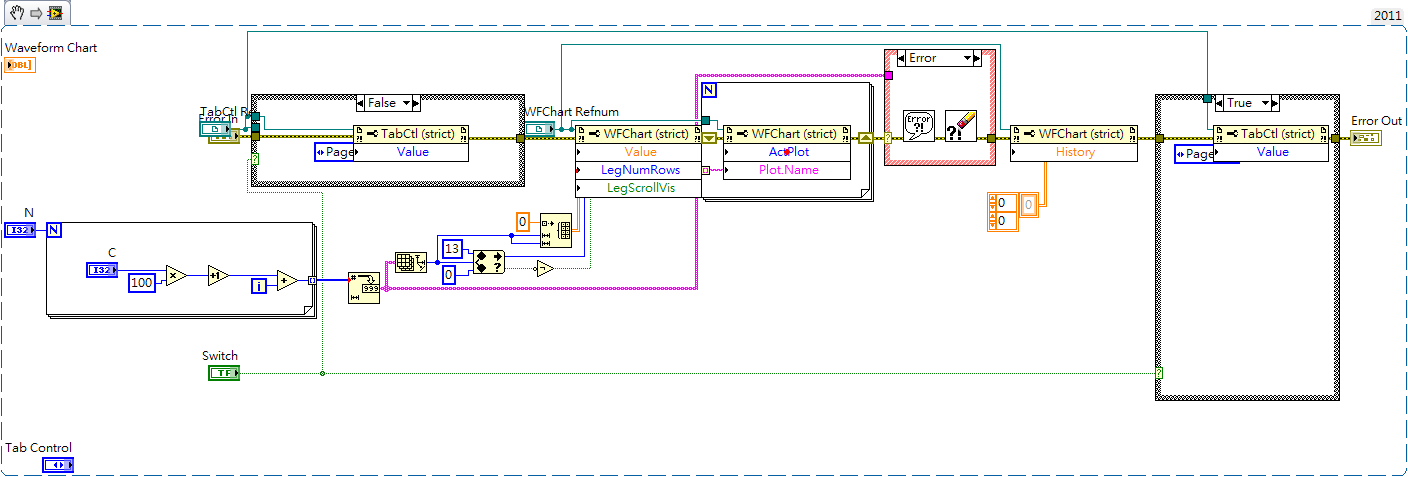
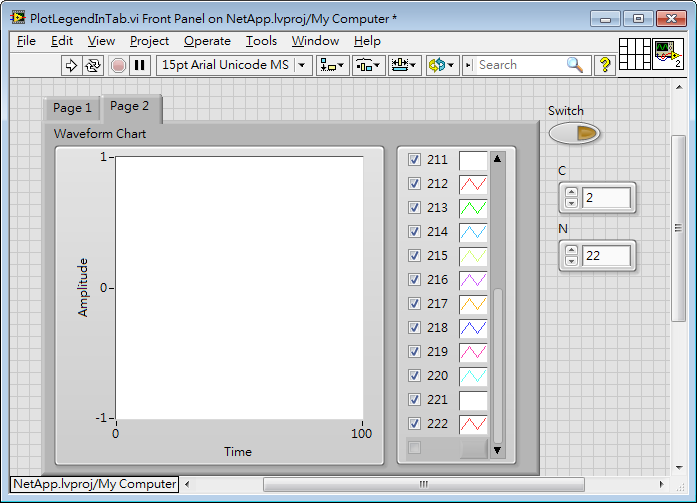
The table of waveform in the tab control
Hello
I would change the parcel number and the name of a waveform graph plotting in a tab control.
First of all, it works fine without a tab control, but I have several cards (such as temperature, pressure, tension...) while I put every chart in the pages of a tab control.
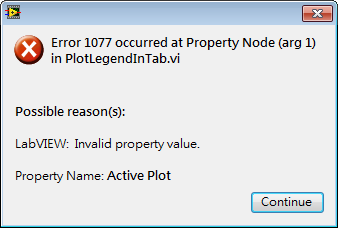
1077 error happened when I "add" the parcel number and change the name of the parcel.
Here is a sample I did to describe this problem.
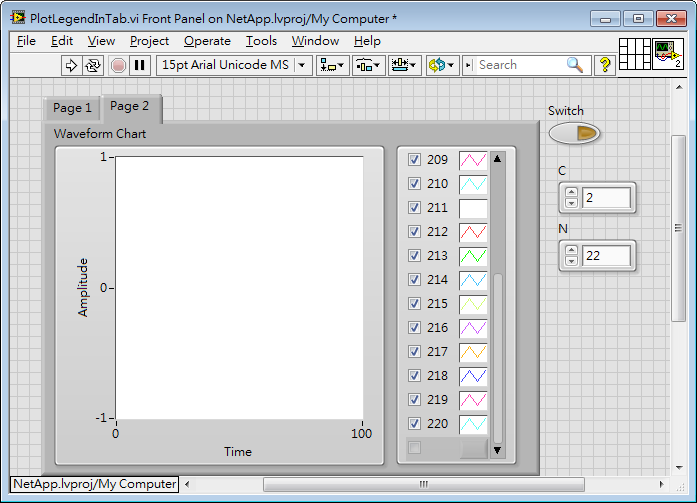
Start, if the number is 20, there are 20 plots in this table on page 2.
t
Do not operate the switch, replace C 3, N-18 and run that and it can be seen that the tab control will pass to page 1.
Switch to page 2 and field names are updated, but left a relic.
Add N 22, replace C 2, and then run it again.
Error 1077 has arrived! Go to page 2 and the parcel number is always 20, and field names are updated at 20.
Run it again and it works fine!
It is very difficult for me.
If I spend first on page 2 and run the program, it works very well also.
(In other words, if the switch is active, then the program works very well.)
The version of LabVIEW mine is 2011.
I don't know I missed or misunderstanded something about this problem.
Is someone can give me any suggestions? Thank you very much

Step 1: Do not use tabs, use sub-panels. You can get the same user experience, but with a much simpler code.
Start here: http://www.notatamelion.com/2015/02/09/building-a-subpanel-based-user-interface/
Mike...
-
Graphical waveform power button control
Hey all,.
I have a VI with a waveform graph, and I want to be able to do a few things with it. Currently I have the chart starts when I press the button "O". But this is where I am stuck. Then I need the graph to stop (pause) on a key shot without losing any data. I also need a key combination to reset the graph to a blank screen. Any help would be great.
See attached VI.
You answered my original question completely so I'll give you the solution.
Furthermore, I would like to implement several of them in a tab control - see VI. It doesn't seem to work. Could help you with that?
-
[BUG] LabVIEW crashes when replacing a control of waveform with a digital table
Steps to reproduce:
- Started with LabVIEW
- Create a new VI
- Please control waveform on the front panel
- Right-click on the control of waveform and select replace-> Silver-> table, matrix & Cluster-> table - Numeric (Silver)
- See LabVIEW crash with error internal 0xC9381CDA in datamgr.cpp
Tested on LabVIEW, 13.0.1f5 (32 bit) and 14.0f1 (32 bit), Windows 8.1 x 64 LabVIEW.
Hi all
The CAR initially submitted DFGray has been corrected in LabVIEW 2015! You can find a link to download here.
-
How to make my waveform in the simulation design and control work continuously?
Hi all, I m a begineer to Labview and have a few question.
I use the Labview to design and implement a controller for FOPTD system, but I found that the waveform in the 'loop control and simulation"does not work continuously. I mean keep repeating in the same graph from 0 to 10 seconds. Is there an approach to make it run continuously?
Thank you very much.
Whenever a loop Control Design and Simulation is executed, it connects a full simulation, the initial time for the last time. When you drop a new loop CD & Sim down, the default values are zero second initial time and 10 seconds for the last time. I guess what you probably want is for simulation do not stop at 10 seconds. Double-click the left node attached to the CD & Sim loop and extend the end time. You can change the end of 'Inf' time if you want it to run until the VI is stopped.
-
Business Structure - timer / controlled waveform
Hello world
I am building a waveform of controlled time/switch. I have three different parts of waveform to 8192 samples each. I have a case of Structure inside the While loop.
Structure of the case must have the following properties:
-1st line (from above) on the output until what you press Start. This is the first part of waveform (normal state of the signal) so I can write these data several times.
-When you press Start, the current examples are written after that write data of 2nd line exactly once (it's a transitional part of waveform)
-end of the transient wave, write the fixed part of the signal (3rd line)
- and finally, return to the 1st line of entry.
Switch box must be done after prior data wrote because I need to synchronize the start of a signal which ends on the other.
Any help would be greatly appreciated.
Thomas,
I did something like this before. I've handled by putting the waveforme write and play in a loop (with a case defining structure that array to write to the data acquisition card). In this way, if there is no action from the user, a default waveform is always written on the card and played. When the user presses a button, a Boolean value has triggered another round of case (you will use the Boolean value to trigger a simple state machine that determines what table to write). The final value of the state machine to go back to your original state.
Example:
State 00: Normal default waveform running
State 01: User Action to start-> tracks 'line 2'-> change boolean to go to State 10
State 10: series 'line 3'-> change to 00 status boolean
State 11: {unused condition}
The only part that this should affect is the writing of the real array to the data acquisition card (i.e. keep the rest of the code out of the apparatus of State, but within the main loop)
I hope this helps,
Sean
-
How to control each channel of the signals emitted by the generator of digital waveforms?
Generator has digital waveforms of 8 channels. I need to generate two different signals for HSDIO. How to change and control two different ways? In addition, how to translate pinout of the PXI-6541 to channels? I need pin 1,3,29 and 31 control signal individually.
Thank you!!
You need to combine your personal data in a table. The digital waveforms is simply a numeric representation of the binary table. It always boils down to bit 0 of each element of the array will channel 0 (or the first string that you specify in creating dynamic channels). The next bit goes to the next channel. My last post is very clear. To display the table in binary, right-click on a table element, then select the display Format, then select binary. You can also right click on the element, select Visible, then select Radix Show to display the small b before the number. One last thing, in the display Format window, uncheck the box next to the minimum field width to use. Then set the digital just below zone 8. Then select Pad with zeros to the left in the box below.
You should not use waveforms up to what learn you more about how the HSDIO operates on the input data. It is not difficult to combine waveforms, but it is not as clear as it is using an array of U8, U16 or U32.
Trying to explain further. The first number to be written to the HSDIO will have this effect: Bit 0 (LSB) of the number is written to the first HSDIO string you specify. Bit 7 is on channel 8, you specify. If you specify no 8 channels, the bits download ignored. If wiring in a certain number will produce only a single bit on each channel. In other words, the number has already combines the bits of all channels that you specify. Combine you do nothing yourself. Return to my photo on my last post. By wiring in a table, you cause a binary model must be generated.
I hope that is more clear.
-
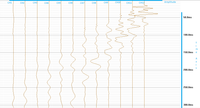
Custom waveform or an XY Chart control
Hello
I need to a waveform graph or a special control of XY-Graph in LV2009
Take a look at the next photo or seizure.
There are 12 channels and all channels have the same x-axis (axis of time actually)
But each channel has different and 'separate' value (Amplitude) axis
Is it possible to do this in LV2009? or LabVIEW already has something like that?Sorry for my bad English!
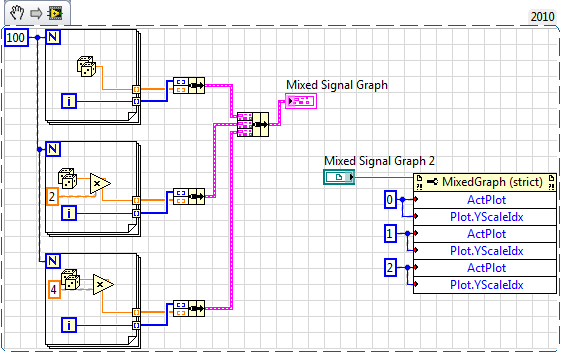
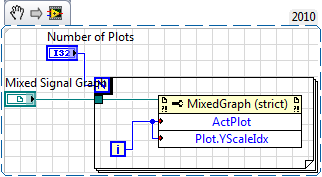
Ah, here we are. Use the property of "Active conspiracy" and set "scale index Y" on each plot of active.
(Due to the way of working clips, the reference became a control).
Also, for your application, you probably want to put it in a loop that runs through all 15 plots:
-
Control of data using multiple thermocouples via indicators and the waveform in real-time
I apologize in advance for this question is probably a bit simple but I'm all new to labview and the forum and could use some advice. I have a CompaqDAQ with two 9213 16 modules of track and I'm trying to read in 30 thermocouples in a waveform, but also display 30 indicators so I can mark each indicator with the thermocouple for real-time tracking. Each thermocouple corresponds to a specific location and it is essential that the interface has an accurate indication or a label for each of them. I wonder if there is an easy way to do this in addition to split the signal and have 30 thermometers on my diagram? Perhaps a table any? If I use a table to create 30 thermometers, the DAQ assistant automatically sorts the thermocouples according to ascending numerical order. For example, would be the indicators of first and second on my interface automatically assigned to channels a0 and a1 of the first module, or should I do it manually? Even for the waveform? Thank you very much!
PS - Do not know if this message had need of more details, but let me know if more information is needed, and I'll give you!
I see that you use the DAQ Assistant to create your task. Now I understand why you may have about labelling. It is easy of the seller NOR spiel booting... But in any case, you already have a task to the MAX instead of use the DAQ Assistant? The interface is similar and there may be a step or two, but your end application will be more effective and you will have more options with your data and properties. For example, I tried to update the names of physical channel in the DAQ Assistant installation program, that it let you do, but it propagates that change forward to waveform chart legend. Also, I don't know any property for this dynamic data type node, although I never use it either. I suggest the setting up of your task and channels, Max if you'd give it a go.
Since I thought I didn't really takes you all the way with you help, I wrote another one. It uses a cluster, even if it's a bit barbaric. I thought that there was a more eloquent way to do by changing labels, but I could not it works as I had expected.

Maybe you are looking for
-
Airport Extrem ' device not Born ".
Dear friends I have a serious problem with my Airport Extrem. I have a small network with an airport extrem and two airport express. The two express equip different flowers in the building as Wi - Fi. On the events of the airport, I also have a USB h
-
received a call from 800-330-6363 indicator of trouble with my computer. Is it really of windows?
-
HP Photosmart C4780: I try to print from the web
I try to print from the web. When I click on the ePrint icon and choose web web page, that I have already printed is still there. I don't know how to remove it so I can print the new page.
-
Routers using broadband as simple access points?
I need a simple Access Point and the WAP610N seems sufficient. However, I would like to get capacity simultaneous dula-band, and it seems that I have to go to something like the WRT400N to get the. However, the WRT400N has a broadband connection. I c
-
DVD drive does not open. What can I do?
Yesterday, the DVD drive in my Dell laptop, Inspiron, Windows Vista has worked very well. This morning, the drive does not open when I pressed the eject button, although the indicator flashed several times. Dell support site mentions try "eject featu