Draw the rectangle to the intensity chart (position where clicked)
I am able to extract the coordinates using the mouse down and mouse to the top of the structure of the event, but unable to draw the rectangle at the specified position. I get the coordinates to the mouse down and mouse up to the event within these limits. I want to draw a rectangle in the position coordinates, but unable to do so.
One last thing, since you use the Rectangle to draw, you need to deal with cases where the rectangle is not drawn from top left to bottom right. Please make sure that the minimum value X goes to the entrance on the LEFT and the minimum value of go at the TOP of the terminal of the vi entrance Rectangle rect. Use the Max & Min function from the palette of comparison for that.
Ben64
Tags: NI Software
Similar Questions
-
How can I draw the intensity in real time of a picture in time real (imaq 1394)?
I have a firewire camera.
I hooked up my camera to my pc with labview and now I display image in real time. How can I draw the intensity of a region dependent on time?
Y - intensity
X - time... I would watch the variaions real-time intensity...Thanks in advance
The light meter example is pretty much what you want to do. It is located here:
\National Instruments\ \examples\Vision\2. Functions\Light Meter\Light meter Example.llb\Light meter Example.vi In the example, the x axis are the number of iteration, but it is easy to modify to use a graphic instead of a graph and chart the time instead.
Hope that helps.
Christophe
-
LabVIEW hangs with in the intensity chart
Twice this morning, LV2010 weighed ("program is not repsonding") when I tried to put a graphic on my front intesity. In one case, I copied the graphic in an example program OR my VI. When I tried to reposition the chart on my forehead panael, LV unresponsive. Same thing happened when I tried again; the second time, I have the graph of the intensity of the palette of tables and graphs. I LV 2010, version 10.0f2 and windows XP. Thank you.
Hello!
The following KnowledgeBase explains why this could happen.
http://digital.NI.com/public.nsf/allkb/9A8FB888BFCED9658625721500434A31
Basically, this table might contain a large amount of data, and when you move, LabVIEW must reorganize all this information in RAM as you move the chart. You can write smaller data, or save all data in a separate table in the table at the end of the execution so you can save it. If you want to view a chart later, simply enter it in a graph.
-
draw lines on the graph of the intensity
I want to draw lines on the graph of the intensity.
I am already looking for some questions before.
I know there is a vi could draw line on the graph of the intensity by dragging the mouse.
But I need more precisely what set the length and the angle between the horzontal line.
The setting is very ideal for me. But I don't know how to use it in the intensity chart.
Is there anyone can help or give some advice?
Your example is not so great because it uses 100% of CPU on a kernel at any time, do nothing.
Here's a quick rewrite of my old example here. He draws an angle with the specified length and angle to where you click on the chart. This should help you get started. Modify if needed. (Also remember that trigonometry is much easier when using complex numbers
 )
) -
How can I specify pixels in the graph of the intensity?
Hello
I want to specify the number of pixels in the in the intensity chart. I have 56 values want to display. How can I do this?
Hi jerryvdk,
By specifying the number of Pixels, you hear, allowing only a specific land area size of the chart itself?
You can change this through the use of a property node.
Steps to change the plot area size:
- Right-click on the graph of the intensities.
- "" "" Scroll create "property Node" plot area "size" all items.
- This will create a property node that will allow you to change the property of area of the draw of the intensity card.
By specifying a space of draw of the 56 x 1, this would allow a 56px draw area size fate. Is that what you meant?
-
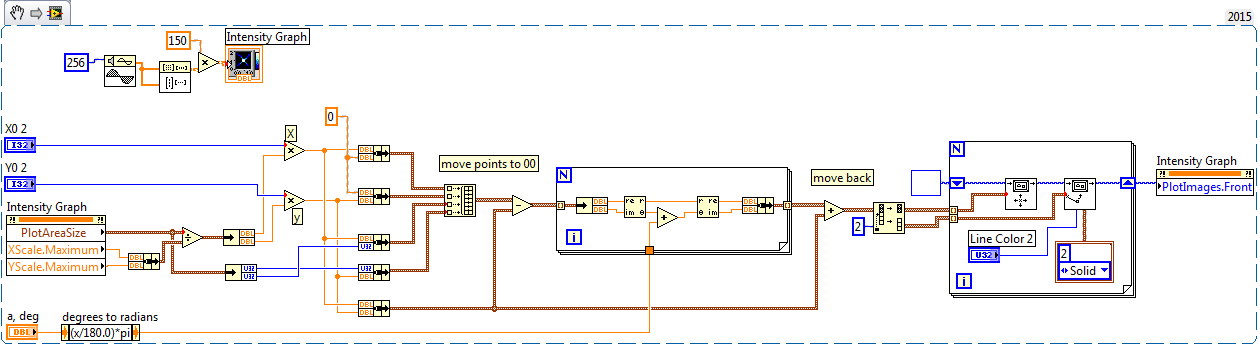
Draw the new lines on the graph of the intensity
I'm trying to attract the XY axes by an arbitrary point on a graph of intensity. I can draw two lines across the image (suite of messages like this link below), but they don't really seem FDNE to the top one the coordinates I spesify. I know that I have to correct the fact that the vertical scale increases from top to bottom, but how do I draw lines to the (x 0, y0) position I spesify? It seems that the lines are superimposed on the image, but not related to the axes of the actual intensity chart.
http://forums.NI.com/T5/LabVIEW/overlaying-XY-line-onto-intensity-graph/TD-p/398963
but you need made "vertical mirror".
-
Draw a line connecting two points in the WPF chart
I'm trying to understand the best way to draw a line between two existing points on my graph in WPF. At first, I thought I had it works fine; I just added another parcel to my graph then given exactly two points for rendering. But I quickly noticed that the app has become surprisingly slow and CPU was quite high (adding other plots does not affect the use of the CPU as long as they have a complete set of points (?)). He wants me if I looked at using the DataToScreen method on the chart but I can't know what the parameters are. The second parameter is simply an IList that tells me a lot. This seems to be the method I want to use for the coordinates of a point on the graph screen.
No one knows what the second parameter is supposed to be for the DataToScreen method? Everything I tried throws an Exception of Argument.
Thank you
DanDataToScreenwill return a screen coordinate in the plot area of a chart of the value of the raw data horizontal and vertical in the given list. The parameter value is aIListfor compatibility with other methods of graphical query such asFindNearestValue, returnIListvalues containing raw data.A concrete example, say you had a graphical configuration with a wide horizontal axis ranging from 0 to 100 and a vertical axis double precision ranging from 10 to 20:
To get the screen coordinates of the value at the center of the two axes, you can call:
graph.DataToScreen(plot, new object[] { 50, 15.0 })Note that the raw data values corresponding to the type of axes (horizontal
AxisInt32returns the integer50and verticalAxisDoubleGets the value15.0).You also mentioned a performance issue where "adding other plots does not affect the CPU so that they have a complete set of points". I did a simple test app that adds an array of two points of a chart on each key (for example
graph.Data.Add(new[] { new Point(x1, y1), new Point(x2, y2) });), but could not reproduce the problem you saw. Could you share the code, you use to draw the connection line? -
Third-party tool to draw the rectangle on the block diagram
I know he was once a third party tool that allowed me to draw a rectangle of Nice double border on the block diagram. Yes, it's the not the front panel block diagram. It was very useful to make annotations and designating functional groups. Does anyone know what this could be? I installed Package VI Manager and went through everything I can think of without finding her.
Unfortunately, the documentation for those modules potentially very useful is poor. The 'Get info' is terse point of unnecessary and by clicking on "Product Home Page" rarely gets you more than a logo, not informative. Surely there should be more details somewhere.
I don't know what you're referring to the tool. What is this logo? Maybe someone can recognize.
What is the problem with the flat frame?
-
Why drag the magnifying glass to draw a rectangle in Illustrator CC 2015 no longer works?
I'm used to be able to draw a rectangle using the class Magnifier to zoom in on a specific area. This doesn't seem to work more after I upgraded to Illustrator CC 2015. Does anyone have an answer as to why? Thank you.
You will need to disable the Zoom in the preferences of GPU.
-
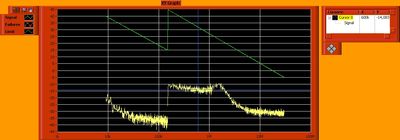
Get the picture (chart xy) cursor & draw palette/legend/graph label
Hi, I have a problem with the Image 'Get' invoke my xy graph node.
First, here is a screenshot of the result:
As you can see, is not only an image of the chart, but the chart & all of its items 'visible '. The only way I found to avoid is to disable all items by right-clicking on the chart before you click on the button "save the chart." Is there an another more convenient way to do so?
Thanks in advance
Hey,.
You can use the node property to pass the value false to the visible property of the legend under the click event to "save the graph...
And activate again the process to record is made...
Hope that should be
Concerning
HS
-
DateTime on x-axis of the graph of the intensity
How can the x-axis of a graph of intensity be configured to the DateTime data type, similar to the graphic waveform XAxis? You can set the FormatString DateTime MajorDivisions, but has no way of installing the x-axis values. Waveform curve has a foot (double [], DateTime, TimeSpan) function that will implement the XScale with the correct DateTime values, but the graphic intensity doesn't seem to have a similar capability. I tried to configure the graphic intensity YAxis MajorDivisions DateTime Format string and pass then the plot function Tick values for the yScaleStart and YScaleIncrement, but it does not work probperly. MS2012 release notes say that the curve of intensity has now an automatic formatting for displaying DateTime on axes X and Y. I tried to use this feature to test the DateTime X and the ability to axis Y; However, the function of automatic formatting is not available for the chart of the intensity. Any help is appreciated.
Thank you!
Jon
Hello
Try the following code piece.
            // Set the label format correctly            intensityYAxis1.MajorDivisions.LabelFormat = new NationalInstruments.UI.FormatString(NationalInstruments.UI.FormatStringMode.DateTime, "g");
            intensityYAxis1.Mode = NationalInstruments.UI.IntensityAxisMode.AutoScaleExact;

            double[,] data = new double[100, 100];

            for (int i = 0; i < 100; i++ )
            {
                for (int j = 0; j < 100; j++ )
                {
                    data[i, j] = (i + j) / (colorScale1.Range.Interval * 2);
                }
            }
            // IntensityGraph only understands double values. But graph can interchange the data value from different types using the DataConverter provided by NI.
            intensityPlot1.Plot(data,
                0,
                1,
                (double)DataConverter.Convert(DateTime.Now, typeof(double)),
                (double)DataConverter.Convert(TimeSpan.FromDays(1), typeof(double)));
It will be useful.
Habim stone
National Instruments
-
How to draw the lines automatically
In LabVIEW I must draw a line automatically (both vertically and horizontally) the user will define the vertical and horizontal number lines.
Is this possible with LabVIEW
 Thanks in advance
You move to the point of departure of the line using "move the pen", and then draw the line using "draw the line".
Repeat for each line. (using for example a for loop and autoindexing on positions).
-
How two graphic signals, taken at different times on the same chart?
Hello
I am trying to graph 2 files different tdm on a chart. The files are the same
Time Sensor 1 Sensor 2 Difference Sensor 3 03/07/2013 08:26:30.214 AM -0.001 0 0.001 3.2109957 03/07/2013 08:26:31.489 AM -0.001 -0.226 0.225 3.251679525 03/07/2013 08:26:32.249 AM -0.149 -0.198 0.049 3.1567506 03/07/2013 08:26:33.192 AM -0.135 -0.248 0.113 3.315462225 03/07/2013 08:26:34.336 AM -0.135 0.17 0.305 3.2682213 I need graphic of the two signals (time vs 3 sensor data from two different files). The registration of signal rate changes by file and within each file, so I need to keep the time interval between each reading, but a necessity, the two waveforms to chart on each other, no matter what day/time, each file was saved to. Please see attachment for an example.
I can read data from the file and graph several waveforms (generic of generated sine waves) on the same graph, is the part that I'm stuck how to get x/time-axis to work properly.
Thank you
Two options:
(i) use relative time instead of absolute time. If dt is not constant, you cannot use waveforms. Use an XY graph and subtract the time stamp first of each timestamp in the data/file set. Either your departure time will be zero (or 1904 if you want).
(II) draw the two sets of data in a XY Chart, using two x scales. With the right button of the x-scale and select "Duplicate scale" (or something close to it), then go to 'Settings'-> 'Ladders' and change the new scale. Now go to the tab 'Traces' (always in 'settings') and configure your two plots using separate x-scales.
-
With the help of the graph of the intensity
Hello
Currently, I have a problem with the graphics of the intensity. I use the Toolbox of the time frequency in Labview. Currently, I am having a problem where I had to plot the spectrogram of the signal. I tried to maintain a plot of the spectrogram to 0 for 4S and another 4 s to 8 s. I'm trying hard to draw the graph of the two together, to form a parcel from 0 to 8 seconds, in the spectrogram. In addition, the time axis will continue to increases in 4S interval with a spectrogram updated. I wonder how can I realized by having two spectrogram with two different time interval to display a common conspiracy? Thanks much for the advice.
RDG
kengkc
Hi kengkc,
Correct me if I'm wrong, but you say that you have the data for the first 4 seconds of your acquisition (t = 0 to 4) and 4 seconds following your acquisition (t = 4 to 8) and you want to combine them into a plot? I guess that since you were able to draw in a graph of intensity to begin with, they are already in the tables.
If that's what you want to do, you can easily concatenate your arrays using the Array function build (which means to add a table at the end of another person). Add your function Array of build of the subpalette of the table and make sure that you right-click and choose concatenate arrays so that you get more dimensions in your resulting table. Then expand the function Array build so that you can wire your matrices inside.
Please refer to the attached screenshot to get an idea of what I mean.
I hope this helps.
-
How to draw the graph of output?
Hello
How to draw the graph of an exit? is there any api for it?
The short answer is that there is no API, but you can create your own field if you want to, and here are some samples:
http://supportforums.BlackBerry.com/T5/Java-development/create-graph-fields/Ta-p/444968
I recommend the search before you ask questions to see if other people have asked similar questions. If you type chart in the search box you will find other similar topics.
Maybe you are looking for
-
I want to take a measure of resistance with an NI USB-6251 box. It seems possible, but I'm stuck on the excitation source. I use the simple example of resistance - Input.vi VI continued. Unable to set the current excitation source other than from t
-
600-1120: touchscreen: mouse image appears on the screen?
Hello During each action in touchscreen mode, an image of big mouse appears on the screen and then disappears after a few seconds. Is this normal? Is it possible to remove the image of the mouse? Thanks for your help!
-
is there a way to get the scanner output to PDF K60?
most of the other HP all in one printers in PDF output and this K60 printer/scanner work fines except that I need to exit the scan to PDF - help.
-
6500 a apple iphone 5 s eprint
I have an officejet 6500 a and an iphone5s - what can I do to be able to print from pc that I have now to do it via usb, and print from iphone can I buy an adapter-firmware - software update - or eprint ePrint says im not connected to a network - how
-
Hello Does anyone know, when will be available 4xFE cards for IPS-4240 (for total 8 interfaces)? Kind regards Krzysztof