excerpt + "enable debugging".
Hello
LV2013
"" When I use ' create from selection ", why this excerpt does not keep the original value of" properties of vi / allow debugging?
If the original VI was 'allow debbuging'... the code snippet changes the value of "allow debbugging" on IT. Why?
What is a small bug?
(Sorry for my bad English, I do my best.)
What is the property of the VI you are down in the code snippet before filing the extract in there?
A code snippet is a piece of code, it is not a VI se, so I expect not to carry along the VI properties.
Tags: NI Software
Similar Questions
-
How to enable debugging in Eclipse?
Hello
I'm currently developing the eclipse + component 4.5 BB, you have the problem when going through the debug mode.
When I run 'debug', I saw a lot of message in the window of the console and BB Simulator also lights up, but I can not use those debug command, such as intervention,... etc, they are disabled.
My helloworld can run on this Simulator.
In my view, is not a turn on the debug feature, but have no idea to get it resolved.
Appreciate any advice.
wtoon
Thanks, I got it resolved by reinstalling everything.
wtoon.
-
Remove app installed with App Manager remove debugging
I enabled debugging remote on Firefox for Android, connected to App Manager desktop Firefox and press "Refresh".
Now app is listed in 'Apps' in my Firefox for Android, but not in the app drawer, so now I can't lunch the app or uninstall it.
Even debugging does not now.
Is it possible to remmove it even manually? (I have root access on my 4.4.4 Android device)"Now the app is listed in 'Apps' in my Firefox for Android" - Yes, I was talking about: apps page, there is no possibility to remove applications from there.
I have deleted the folder /data/data/org.mozilla.firefox/files/mozilla/webapps and finally apps, but that maybe works only in my case, because I do not have the applications installed on the market, otherwise it could be more difficult because of the need to change webapps.json it.
-
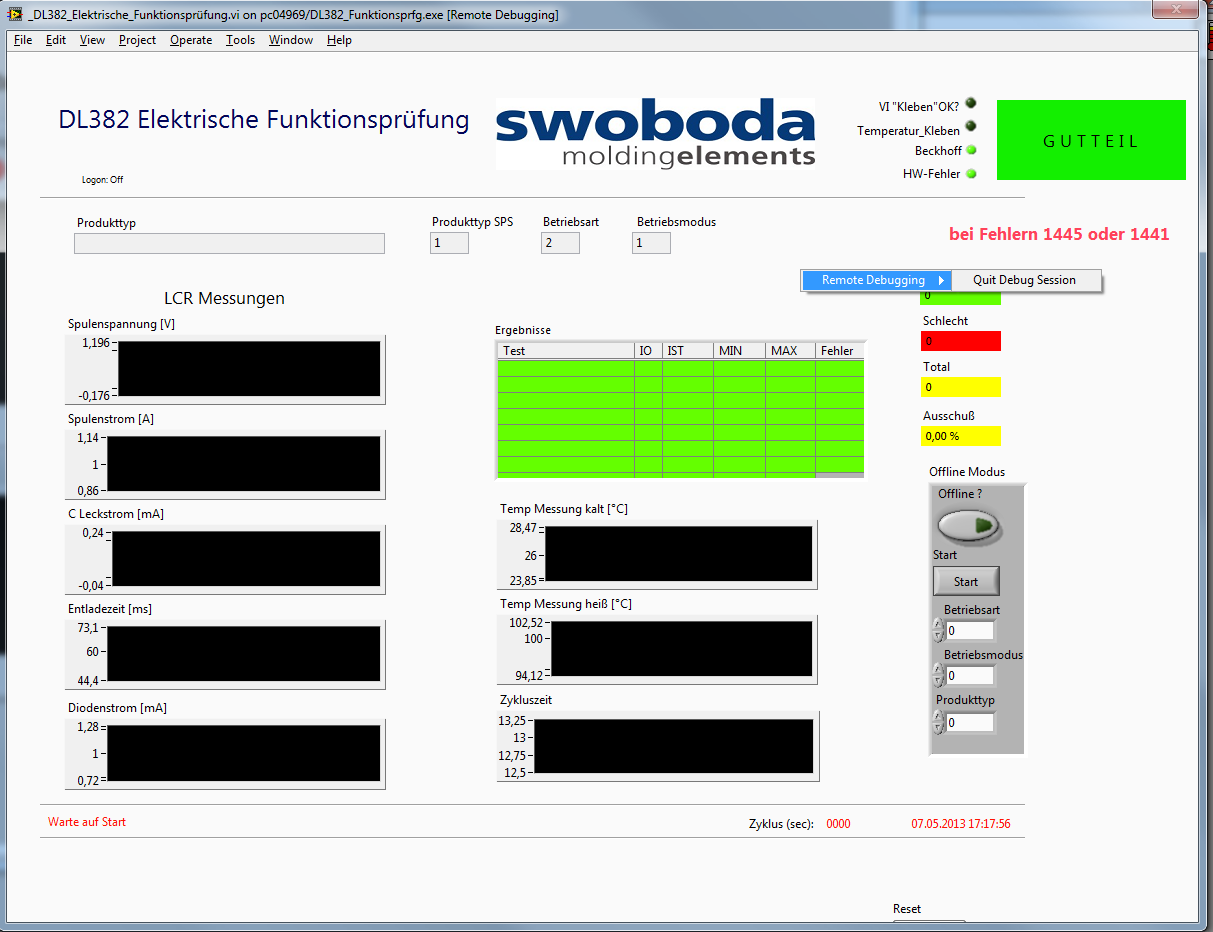
Remote debugging active but no access to the block diagram
I have an executable running on a target that I want to debug. I enabled debugging in the build properties, I enabled debugging in vi properties. I can connect from the development computer to the exe.
But the option to switch to the block diagram is simply not there (see photo). I know I am a first not who has this problem but I couldn't find an answer.
Without being able to see the block diagram, a 'debug function' is totally useless!
If anyone has an idea it would be greatly appreciated. Thank you
Hi peter,.
It is a known problem and a request for Corrective Action (130070 CARS) was created and reported to the Department R & D. looking at through the notes in the CAR, he must fix it in LabVIEW 2012.
Workaround solution: Debugging applications with menus on bar
-
Application crashes when connecting remotely for debugging
Hello again all you lovers forum useful!
I'm debugging a strange behaviour in my application that does occur on a specific computer in special circumstances. To do this, I have enabled debugging in my application and finally was able to see it as an option in the menu "Debug Application or Shared Library" on my local computer (I had to first find out the hard way that you cannot change the name of the application and have always run in debug mode, even if you change the name of the associated also .aliases and .ini files).
When I try to connect to my request, the "connection status" displays lists of downloading my subVIs much and then finally downloading my main VI. At this point, my main VI façade appears on my local computer. However, everything freezes then, while on the remote computer, my application (waiting for correctly so that the debugger start) crashes with a generic Windows "...". has encountered a problem and needs to close"message. If I click to more information, I see that the name is lvrt.dll (my application is usually not real-time, but it uses a timed loop or two).
I would like suggestions as to what may cause this error and how to fix it. Unfortunately, because it's a working application I can't post my code. I'm using LabVIEW 2010 SP1, and two computers running Windows XP.
Thanks in advance for your time!
-Joe
Well, I accidentally worked around the problem, although I never found the root cause.

My applications MS Office had put by my it Department yesterday, and now when I compile my app, it tells me that a VI integrated Excel is broken, somewhere in the NIReport.llb folder, I added to the section 'always include' my construction specification application source file properties. I removed NIReport.llb temporarily since I do not have the part of my application which is used to make this debugging and debugging now my application works. Weird! I was able to successfully debug my original problem that started this whole mess, though, so I'm happy with the final result.
Now, I just get NIReport.llb working again. I'm guessing there are probably an updated version to match MS Office 2010, which is my new version. I had added NIReport.llb to support using "Easy text Report.vi" for printing. Given that my app size dropped 50% when I got him out earlier, I can get another printing option, however. I can solicit the opinions about it, but if so I'll so, in another thread to keep this one to.
To anyone who has been reading this thread and thinking about how to solve my problem, thank you for your time!
Until next time,.
-Joe
-
do remote debugging - switch works / of via ini?
Hi, I have read and understood how to debug remotely a VI - it works pretty well.
My question is - can I set flags "Wait for debugger on launch" and "Enable debugging" in the specification to build for the stand-alone application in real time for all my applications and THEN turn to whom we or off via something like the .ini file?This would be great as then we could just put the flags on all our versions of debugging and then be able to allow debugging when neeeded.
Jay
You can set flags DebugServerEnabled and DebugServerWaitOnLaunch in the INI file of the application to determine whether or not the remote debugging is enabled. However, your application will be more important and may run more slowly when built with debugging enabled, even if the debugging server is disabled in the INI file, because a large number of additional information (facades and diagrams) is included in the compilation to allow debugging, and a few compiler optimizations can be disabled.
-
BB10 WebWorks Debug Error - Please enter a valid application id
Need help to solve a WebWorks BB10 issue when debugging.
Packaging error question
The command line, I ran the command standard packing
bbwp [location of project].zip -d -o [locationofoutput]
Resulting in:
[INFO]       Populating application source
[INFO]       Parsing config.xml
[INFO]       Error: Please enter a valid application id
Here is my file config.xml, I'm actually building the sample bbUI.js
http://www.w3.org/ns/widgets" xmlns:rim="http://www.blackberry.com/ns/widgets" version="1.0.2">
  App name
  A sample description
  My Name


  http://chart.apis.google.com" subdomains="true" />
issue of token bbwp. Properties & debug
Also... I know in the previous SDK WebWorks, you edit bbwp.properties and add a line pointing to the location of your debugging token.
Question:
- Where is the bbwp.properties file in the new SDK? Where can I specify my symbolic debug location?
Thank you!
Hello
The id is an alphanumeric property of the principal element of the
. It cannot contain spaces or http://www.w3.org/ns/widgets" xmlns:rim="http://www.blackberry.com/ns/widgets" version="1.0.2" id="yourIDhere"> You don't need to edit the bbwp.properties file. The Debug documentation token specifies where to put the debugging token file. To enable debugging symbolic support, simply build your application with the d flag.
Hope that helps!
-
debugging access server problem
I'm unable to connect ISDN users via access servers there is some problem among raduis, the access server and billing machine then I felt I need to debug on the access server, but when I go to run the debug command first, and then I m get no output, below is the reviews. What is good order? I enabled debugging, but I cannot see the logs (outputs) so missing here. Please answer me as soon as possible.
AS5300a aaa #debug?
Accountant accounting
Administrative administrative
attr AAA Attr Manager
authentication
authorization authorization
AAA DB DB Manager
ID Id Unique to the AAA
IPC IPC AAA
attributes of each user by user
treatment of POD Pod AAA
treatment of the AAA Protocol
SubSys AAA subsystem
AS5300a #debug aaa VAC
Aaa AS5300a #debug accounting
AAA accounting debug is on
AS5300a #sh deb
AS5300a #sh debugging
General operating system:
AAA accounting debug is on
AS5300a #.
Hello
You can use terminal no monitor to turn off the same and also check this link for setting up an external syslog server to collect system logs.
you use syslog software installed in the external system to collect the newspapers.
the best bet would be kiwisyslog s/w, which is very easy and roubst.
You must configure your router and point the same to send messages to the external system.
regds
-
hang on reboot after using bcdedit/debug on
Windows 7 Edition Home Premium. Tried to set up the computer for debugging using bcdedit/debug on. The system crossed the restart process after the Windows login screen, but hung on the screen 'welcome. ' Could not recover by using bcdedit/debug off; you had to use bcdedit /import to load a previously saved version of the bcd. System rebooted and then until the end. How can I find what is causing the blow and how can we get the computer to successfully start and enable debugging?
Hi Carl,
The issue of Windows is more complex than what is generally answered in the Microsoft Community Forums. Appropriate in the MSDN Forums. Please post your question in the MSDN Forums.
You can check the link to post your question:
http://social.msdn.Microsoft.com/forums/en-us/WinDbg/threads
I hope that helps!
-
Apex 5 URL debug mode works in one environment, but not in another
Hi all
I use the Application Express 5.0.2.00.07 and in the development environment, I can afford to debug using the URL option, for example:
http://LocalServer/Apex/f?p=1:1:1234567:Yes
When I do this I see messages being logged in APEX_DEBUG_MESSAGES and javascript and CSS files used in the pages aren't the minimized version.
However, I can't do the same thing in our test environment. URL to using this option makes no difference (i.e. no newspaper generated message and reduce to a minimum the versions of files are used).
I even tried to call apex_debug.enable explicitly to a front page request process but no luck.
The test environment is the same version as the development environment, but an executable file only instance.
The application has been exported with active debugging.
Must be explicitly enabled in the instance level or the workspace to enable debugging in the Apex? I couldn't find any hint in the documentation or this forum.
Thank you
Luis
Hi Luis,.
the problem is obvisly single "run" mode Maybe try Run and build to check if it works. Another way: set no., implemented only debugging debugging Yes and export (ist maybe there a default invisible when it is running only).
Concerning
Sebastian
-
Debugging in Oracle Access Manager policy
So, I've got OAM 11 GR 2 installed and I have configured an authorization policy that doesn't seem to work. I'm trying to understand how to enable debugging for the policy logs so that when I try to access the resource, I can troubleshoot using logs.
So far, I have done this:
CD $MW_HOME/Oracle_IDM1/common/bin
./WLST.sh
Connect ("weblogic', ' password ',' t3: / / localhost:7001'");
listLoggers(pattern='oracle.oam.*',target='oam_server1');
setLogLevel(logger='oracle.oam',level='TRACE:32',persist='0',target='oam_server1');
I know that the log is enabled because of the following:
------------------------------------------+-----------------
Logger | Level
------------------------------------------+-----------------
Oracle.OAM | TRACK: 32
Oracle.OAM.admin.Foundation.Configuration | < inherited >
I restarted the oam_sever1 of my Weblogic console. I'm settling the journal of oam_server1.out, but when I try to access the protected resource, nothing appears in the journal of oam_server1.out. Issues related to the:
Have I set up the connection properly?
I'm looking at the correct journal?
How to debug policy?
Thank you
--
Mohammed
Found!
oam_server1 - diagnostic.log will display all debug information.
So, to answer my own questions:
Have I set up the connection properly?
Yes, and to turn off logging, run the following command:
listLoggers(pattern='oracle.oam.*',target='oam_server1');
You can verify that the logging level is back to normal with this command:
listLoggers(pattern='oracle.oam.*',target='oam_server1');
------------------------------------------+-----------------
Logger | Level
------------------------------------------+-----------------
Oracle.OAM | NOTIFICATION: 1
Oracle.OAM.admin.Foundation.Configuration |
Oracle.OAM.admin.service.config |
I'm looking at the correct journal?
Yes, oam_server1 - diagnostic.log display of debugging information
How to debug policy?
Set the debug level to an appropriate value, the newspaper of the tail and perform an action such access a web resource. The newspaper will then display debug information that should allow you to see how OAM is implement your strategy.
--
Mohammed
-
How can I enable debugging for all components in the atg
Can score you as correct?
-
Hello
We use identifiers to access a archive of Documaker and generate PDF files. For the purposes of debugging, I need to have a look at the NAFILE and the POLFILE created by IDS with access to archive. I found this option works:
[Attachments]
Debug = Yes
I have 2 problems:
1. the NAFILE and the POLFILE are left on the hard drive until it as deleted manually. Y at - it a timer option, I could set up so that files are automatically deleted after X minutes?
2. the files are created under the DOCSERV folder. Y at - it an option that I could use to specify a different path for files?
3. is there a cheat sheet for the INI options available for the ID? I found a manual that says I should use thsis format:
[Debug]
Attachments = Yes
which is the exact opposite of what I have in my PAD. INI file.
Thank you
GaëtanSorry for the late reply... working holiday and pointing at all... :)
Usually with versions more recent ID, you can specify paths in INI options, but the names of files, especially for temporary files, will almost always GUID generated by IDS. The parts of the bridge Documaker copy data of NA / POL must adhere to the < data=""> INI options well, so by using these settings is indeed correct. Your options for self-suppression of these files must either have an external process (e.g. cron, scheduled, or similar task) that deletes old files on a regular basis, or if you want to be stylish, you could write a custom rule of Identifications that adds the debug files to files temp to the purge list.
The reason why ID does do this automatically is just as you would expect - it's a debug file and probably if you have enabled debugging, you want the file to stay around :) in the opposite case, debugging should be disabled because it is detrimental to performance.
-Andy
-
Hello
I have a problem when you debug applications apex 4, whenever I press the Debug button that I get the dialog box saying "Debug is not enabled for this application.
I've been able to debug applications apex 4 created previously in point 3.2.
A that someone has encountered this message?
Kind regards
AllenAllen,
You can enable debugging for the application.
On the application home page, click on the button "Modify Application Properties.
In the Properties section the value debug to 'yes '. -
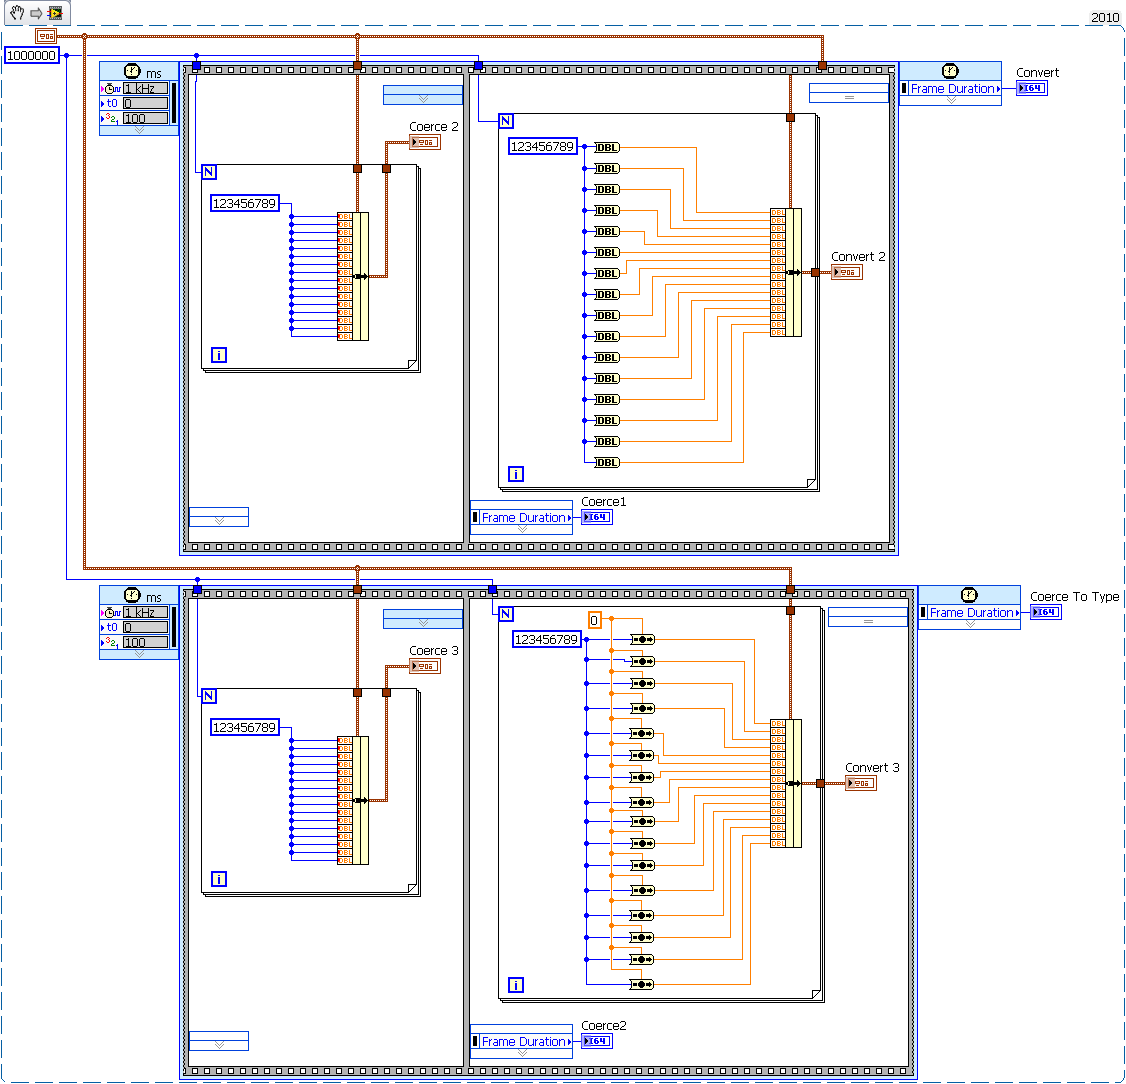
Coerce (red dot) is faster to convert and the force of new Type
The following excerpt shows that a red wired dot force is several times faster than the conversion of the data type. This is not too surprising, just because I heard that this is the case, but I would like to know what the red - dot under the hood that makes it much faster, still 'wrong' (sort of).
Going further, I wanted to see if compel him to new Type would be as fast as a red dot coerce. Turns, it's about as slow as Convert.
Can you explain or join a discussion about this? Am I wasting time and conversion nodes?
It is not the case. Since you have enabled debugging, additional code is probably generated to prrobe loops during execution.
If you disable debugging, all times are 0 or 1 ms.

Maybe you are looking for
-
TOSHIBA AC100 - browser opens all the 'https' pages
How I can resovle this problem?http://youtu.be/-zGS-J4oxBMhttp://youtu.be/vQJyzbAmr3g Browser opens all the 'https' pages and I can't add my Google account. Time is correct.
-
HP Pavilion 11 X 2-device unknown after Windows 8.1 upgrade
Hello I did the Windows Update 8.1 on my new Pavilion X 2 11 (sg000). Also, I ran the HP installation Assistant additional drivers (Intel) support and Bios. But I still find a unknown device in the windows hardware Manager. According to the details,
-
modification or addition of default e-mail program so I can send a scan
I know it's obvious, so I guess that I havnt a brain today, but I'm trying to scan a doc to the email it says I have no configured email account which I do every time I tried to go in my control panel default but noot can find the place where to conf
-
Vista home prem (KB967723) sp2 security update does not install and get the error code 80073712
I tried to fire disableing walls, with work, I get all the way to installation and the i get the error code 80073712
-
Oulook Express 6 it has an error and will not let me delete the email
Original title: OUTLOOK EXPRESS 6 WINDOWS XP There out wrong and won't let me delete the email. He still receives new e-mail. no problem viewing or respond. Anyone know an easy solution?