Group waveform normalize?
Can we apply this tool on the instruments? For example, if we want to give us some (or all) instruments in order to be 'strong '. We take, for example, guitar, bass, drums and vocals, and pass them through the "normalize group vaveform" and the program automatically equal to the volume of the instruments (of course, only if it is our goal)? Of course, this is just to take the initial stage and later in the mixture can be adjusted, no? ... Or nonsense?
You can do all this if you want, but you'll have to excuse me hear the results!
No, mix you emphatically do not like - just use your ears and the mixer, even for preliminary results. That's what both of them are there for...
Tags: Audition
Similar Questions
-
CS5.5 looking for the Group waveform normalize?
Hi, I know that in Audition 3, on the Edit menu, there was the option of group waveform normalize. I'm looking for this in CS5.5 and can't seem to find it.
Is this feature still in CS5.5?
Thank you
See page 138 of the help file - it's there.
-
Normalize the lots' group Waveform
With the help of hearing 2 Build 5306.2
I load a file. Select the file... Scripts.
Open/new Collection - create a batch called normalize.
Click Save.
Select change... Group waveform normalize.
Click execution Normailse.
I see the file being analysis and amplitude adjusted. Output of the process.
Select the file... Scripts.
Click on stop Cuirrent Script, give it a name and then click Add to the Collection.
If I may use the batch, select my newly created script and run the batch files are opened and saved. No normalization is done.
Script looks like this:
Collection: Batch normalize
Title: Norm to-14
Description:
Mode: 2
Cancel: 1Selected: none 0 at bracts SR 44100 9441514
FREQ: Off
cmd: channelsSelected: none 0 at bracts SR 44100 9441514
FREQ: Off
At the end:It doesn't seem to be a command to normalize it in the script. What I am doing wrong?
The only commands that are saved in a Script are those in the menu effects not in the Edit menu. Normalize group must have several audio to work with which must be open in the menu group normalize itself.
-
Why the outputs that are grouped in a waveform chart in a loop of Simulation show distortion?
Is anyone know why the outputs that are grouped in a graphic waveform distortion to see the Simulation loop unlike these forms of output wave that are placed individually in each waveform graph Microsoft Graph?
-
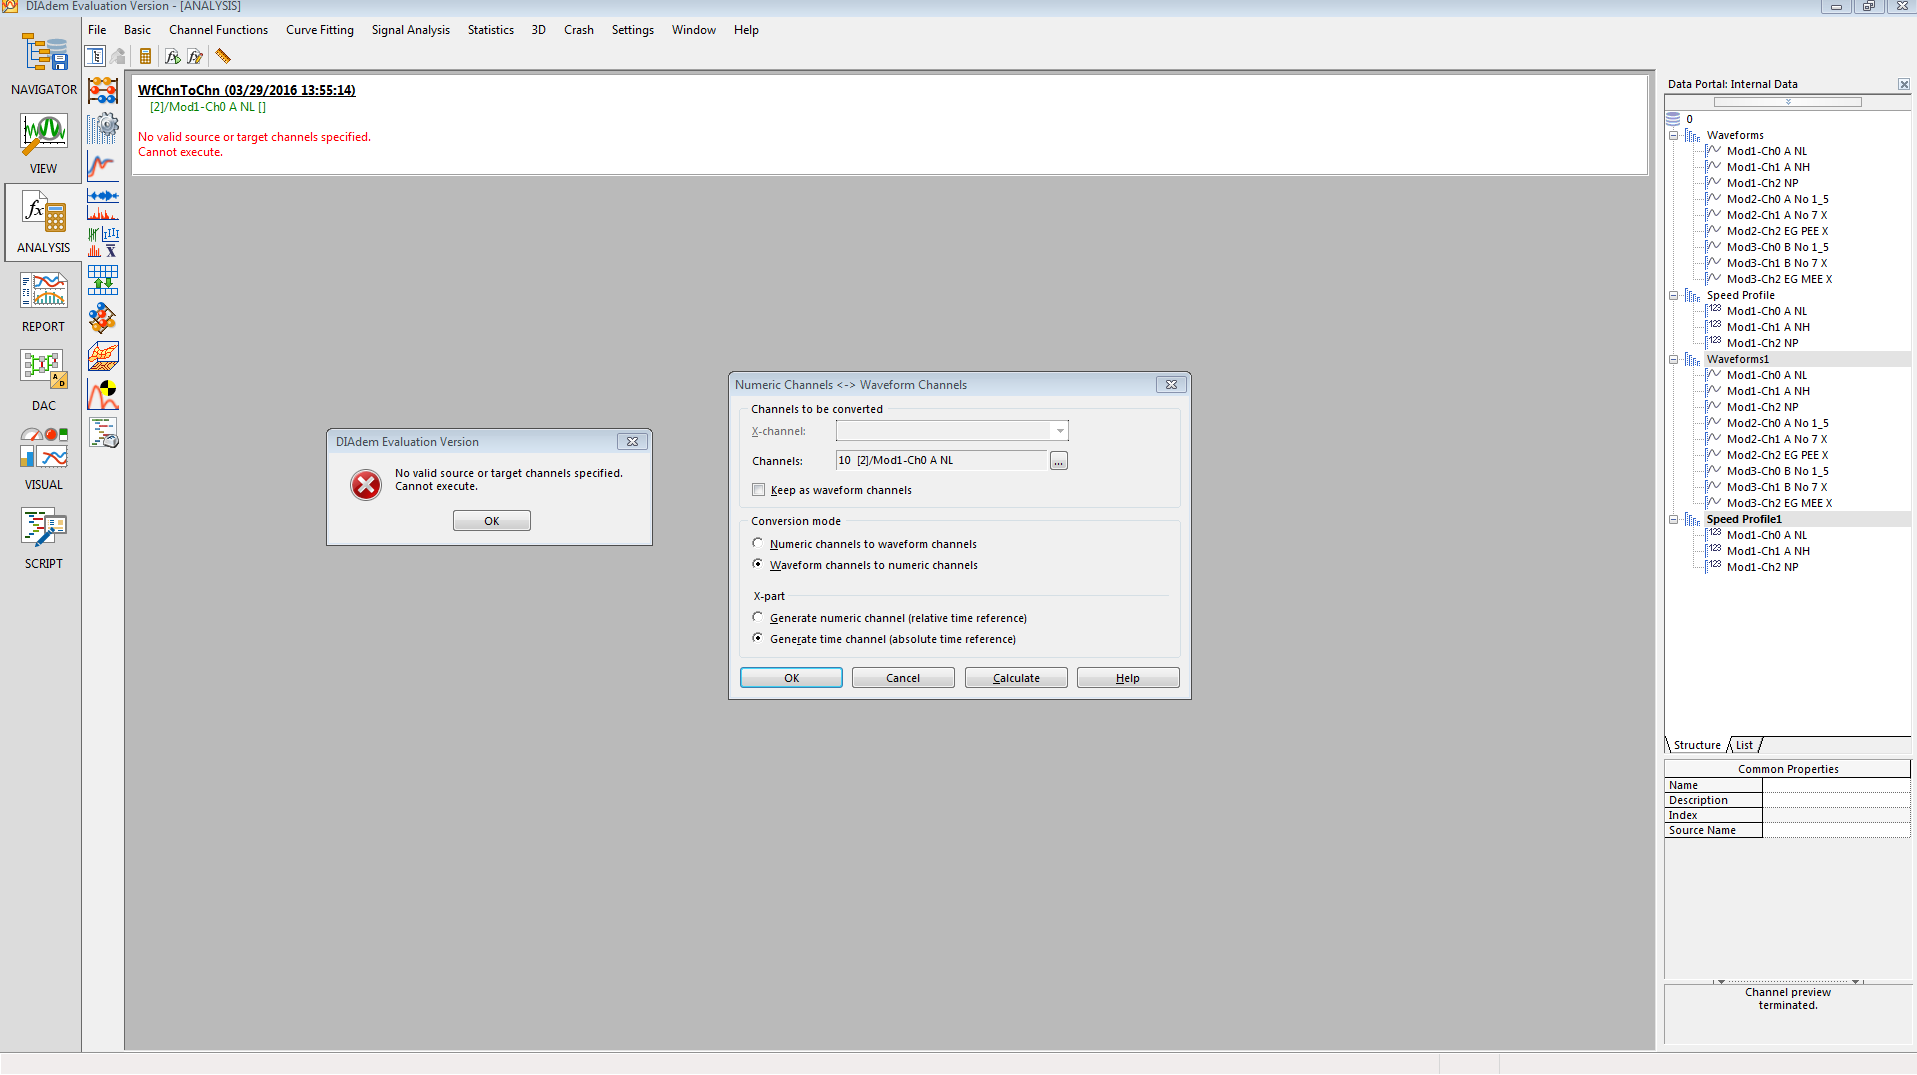
I'm trying to convert a waveform channel in one digital channel and a channel of absolute time, but I get the "no valid source or target channels specified. Error cannot run. ».
I'm trying to concatenate several files TDMS InsightCM so I can display the data in a continuous flow over time. If the first file loaded (one of the channels in the group "Signals") convert the same channel, it works fine, but when I try to do the same thing with any of the channels from the second file (one of the channels in the group "Waveforms1"), I get the error.
Hi JEBalles,
I was able to reproduce this behavior when I chose a digital channel as my channels to convert. In this case, it looks like you run the operation on the speed profile > Mod1-Ch0 A NL, which is a digital channel.
Could you try to select a waveform another channel? It looks like [3] Mod1-Ch0 A NL is a waveform channel.
Kind regards
-
Digital waveform graph refuses to change the names of Bus
I try to display digital signals on the graph whose lines are grouped. It looks like the functionality exist to group the lines of 'Bus '. There seems to be a way to rename each Bus of its default value 'Bus 0, Bus 1, etc.' as an Express VI called 'group digital signals' that does it. Looks like the express VI edition of the attributes on the waveforms in order to rename the bus. Attributes are NI_ChannelName for the Bus and NI_LineNames for the lines that make up the bus.
When I code, line names are renamed according to what I want, but the Bus names remain by default 0, Bus 1 Bus, etc.. Is there something I need to do to rename the bus?
(see annex VI)
Thank you
Dan
So, he works with the good old property node. Simply set the Active Bus and then write Bus.Name.
I've been led to believe that attributes work based on the example here.
-Dan
-
Hi all
I am a fairly new user to Labview and am trying to create a program that: watching the entries in different modules (9213, 9217) CompactDAQ sensors check errors and then uses data from some final calculations like averaging etc. I've set up a small piece of code that includes the main functions that I am trying to accomplish. Now I'm rather uncomfortable with getting set up and assigned channels, then pass these data in a while loop that continuously pulls the data from these sensors.
I have the vi calculations complete and complement the inputs of channel UI, now, I'm working on the side of data manipulation and reading things. The waveform D 1 who comes to read function is currently divided into components I want (given String Name and Y). He then transmit this information out of the loop via a queue which transmits to the parallel loop below that will perform the verification errors and calculations of average. There are some things that make it difficult. I showed the 2 sensors in my example, but in the actual program, there may be up to 400 entries. The problem is that not all of these sensors will be used on all the tests that the software is used for. To use the entries in the VI test for example: if I'm trying to the average of these 2 entries to create a common value, but then on a test, sensor 2 is not there, it must be recognized that fact and not use it in the service average.
So to get down to it, I want to create something that can look through the D 1 waveform data groups, determine what these values are, then perform the functions necessary for these numbers once they are identified, then pass on the calculations of VI where it displays then usable for user information. I think I'm having a problem with the finding in sorting than what I thought at makes me think that there must be an easier way.
If someone has encountered this? What is my explanation of what I'm trying to make sense? Let me know and I can clarify.
In terms of features, I don't see anything wrong. with respect to the effectiveness we must remember some general indications. These issues that I bring to the top will not affect your code now since your stack sizes are very small but can start to create the fragmentation of memory and slow down the software if your stack sizes are much larger and the software runs for a long period of time.
1. try not to use the table to build. Whenever you use a table built labview creates a copy in memory. Try to initilized your berries and replace subsets.
2. as much as you can try not index tables or unbundle cluster several times. try to perform as many tasks as possbile in one shot. (what was obvious in your second loop)
In addition, he's looking good.
I made a few changes to your code and attached to it. I wanted to give you a different on her opinion as it relates to being able to control entry and exit of programitically, if you had a look up table. I do not have the same changes to your second loop but I can guide you through what to do if you do not want to go in that direction. Yet once your original code is well done for someone who is new to labview, so don't feel you need to follow the new design of VI. Just try to remove the table construction and multiple indexing as a good habbit programming.
-
Add the waveform does not reset
Here is the explanation of high level. I want that samples of 100 Hz, groups of 10. I like to check to the discontinuities and then take the last data point in each group of ten. Then take this last datapoint so I 1sample/s if all goes well. Add to the top of my 1 s/s at a "rate of scanning in seconds" (generally 15 sec) and if there is no anomaly data, take the last data point and write it to the file. If there is an anomaly, I want the typical scans over an additional column of the event recorded in the 100 s/s complete.
Specifically, I use the subset of waveform get successfully, I think, but when I Append Waveform, the timestamp is stripped. I was about to try to get XY waveform, but I thought this announcement on the forums might make me come more quickly than the obstinate by it. So how can I easily draw the last data point in these subgroups with success?
I'll take other ideas, too. I seem to get popped up on little things like that. Also, you'll forgive the mess. It's a work in progress. Thermal cycling rig 02/08/13 v2.vi is the code base and TDMStoExcel and RunMacro live can be deleted if you try to run it. they work
Thanks in advance
the loop is just to remove the ten sets of ten, resulting in a bit rate a second base. This way I can run a 'scan in seconds rate' for the while loop with the ability to capture events at 100 Hz. I solved the problem of the table do not reset using the auto index function. I had Dale this initially because, when I develop the process of data for all channels, I didn't know how it would affect waveform bays. I didn't manipulate 3d tables if I could help him. not my forte. Then, I'll try the subarray of waveform get nine full channels and see if it works. After that, the receipt of the data. I need to write to the file for nine channels and hopefully not wait to write until the dump event data. I want to tick away at the speed of scanning and then create an additional column only if there is an event. I'm trying to capture functions to void / screws. the first Subvi process data will do much limits responsible Boolean logic check of the control of movement.
The example you gave is a great idea for the logic, I would like to implement. Thanks for the suggestion!
Tom
-
How is - I size the Group zone oin the graph of mixed signals to meet my signal names?
I have a graph simple signal mixed and I programmed my signal names and they are longer than the width of the component group existing on the subject, and I want them to be visible. How can I resize the graphic components because I wrote the names to the object? I know that I can personalize the thing, but y at - it a method or a property that I'm missing here?
It seems that it is a known problem. You can change the size of the legend by using a property node for waveform graphs, but not for a graph of mixed signals. A good work-around would be to right-click the gray bar between the legend and the plot area until your pointer changes to the resize tool. You can then size it is large enough to show the whole legend. It is a question that is configured to be resolved in future versions of LabVIEW.
-
Hello
I'm working on a group project where my team member gives me a graph of waveform as output of their under vi. I need to use the amplitude (values of y) on the graph of waveform for my part. I think I'm supposed to use "array index" to do this, but I'm not sure how. Could someone maybe give an example? Thank you
Hi Sara,.
This is because the data type of your waveform graph is in fact a cluster, if you turn on context help (ctrl + H) and move your mouse over the wire, you will see the components of the cluster (two doubles and an array of doubles).
You can use Ungroup to extract various components (the table is what you want). If you move your mouse over the graph of a waveform with context-sensitive help you activated, you can see what each part of it.
The first double is x 0 (the starting x position), second double delta x, and the last part is the table of amplitudes (values of y). At the bottom of the context-sensitive Help window is a detailed help link that will lead you in aid where you can get more information on the waveforms.
-
How to display more than two waveforms on a waveform graph?
Well, I have a question in the basics of waveform graphs. I have to post four waveforms simultaneously in my program. I can see two graphs on it, but when I try to display four waveforms, I get an error:
You have two or more data types of cluster wired together, but clusters have different types or numbers of items.
Cluster (unnamed), a group of 3 elements.
conflicts with graphic waveform cluster, a cluster of 2 elements.Is there anyway that I can change a graphic in waveform to a cluster of 4 elements? Because I borrowed this waveform of a VI example on waveform cards "Charts.vi", so I guess it must have been programmed to be a cluster of 2 elements.
I hope that I have my question clearly.
Thanks in advance
One of the problems that you have is that data from the DAQ assistant has a time stamp from now which is about 3 billion seconds
Data from the simulated signals has a time stamp based on the beginning of the acquisition which is about 0 seconds.
So, the table needs to be stretched early in LabVIEW time now to show all the data.
Change signals simulated so that the timestamp is the result of an absolute time, then you should be able to see all the signals.
-
I normalizes some physiological signals on the y-axis (easy), but how I standardize on the y-axis?
I normalizes some physiological signals on the y-axis (easy), but how I standardize on the y-axis? The waveforms range from a length of 200 to 500 datapoints.
-
Pull graphics individual of a multiple waveform graph?
Hi all, is there a way to the analysis of individual graphics of a waveform based on a description given? I know that the wave doesn't than the Y, t0 and attributes t, but there must be a way to do this.
The user enters a group of data by channel. I want to be able to do is isolate one graph of the waveform based on the tag name of the channel and show this on a separate chart.
I've attached screenshots taken from view of the code where the plots are generated and the center of user input.
I would appreciate help. Thank you!
LabVIEW 2012
Windows 7 64 bit
Hello
You can do it. When you get the name of the attribute (as in my first attachment), you can compare it with the name of the desired tag, using the functions in the range of comparison.
If your match is found, then a case structure and write the waveform in a chart.
Otherwise, proceed to the waveform through a shift register and write in the graph.
I have attached a VI in LV 2010.
-
Hello
I want to trace the temperature change indicated by two thermocouples (that are connected to the analog input Module NI DAQmx) with repsect in time (two curves for thermocouple 1 and 2) on a graph unique waveform. Two thermocouples are connected to two channels separated in the module. Waveform graph must be shown in the before, but also exported to a worksheet.
I have grouped the entry of time and separately two thermocouples temperature readings. and then tried to build a cluster. However, I get an error message. Please see the attached VI helpme to achieve the desired results.
Thank you
Josée Vilas V
-
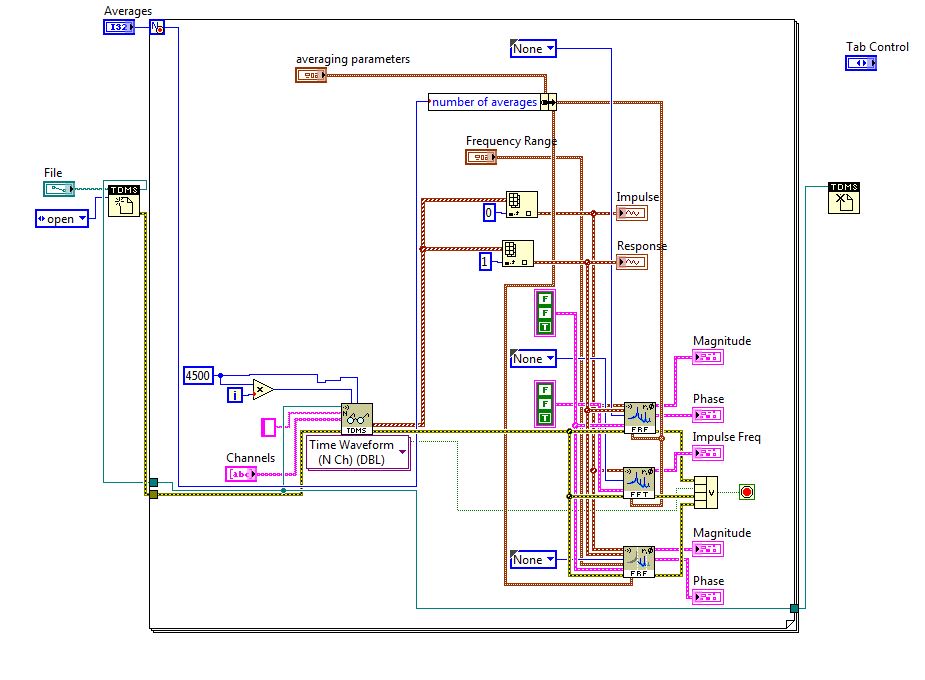
Hi all
I have a problem with SV TDMS waveform VI read. I have several files from a (channel 0 hammer, N response chains) impact test where I gained 15 hits (4500 samples piecemeal, 67500 samples in each channel).
My idea is to read in blocks of 4500 samples. I placed the PDM read waveform looping and fixed the number of samples to 4500 and move the offset to move down the line.
He traces the first iteration, but in the second iteration, it displays an error message saying that it reached the end of the file (?)
If someone can take a look...
Thank you!!
Hi all
I found the problem, you must specify the name of the group as an input in the contrary case, it will produce this error. Now, everything's fine.
It will be useful for all those who
Maybe you are looking for
-
Deselection of voice on improvement in Inspector restores the default settings.
Voice more improvement is a combo of compressor, deEsser, and EQ sound effect. I changed the settings, but when I deselected the effect in Inspector (clicked on the little blue box) to ignore the settings then changed the effect... all the settings c
-
Get the M300 to use an external front LCD monitor internal
Hello I have a M300 which is connected to a port replicator, which has an attached external monitor. If you delete the M300 Replicator before you stop, the next time that you put the M300 in the Replicator and start the image is only on the internal
-
Portege R700 - @ button and "are interchangeable.
Hello the @ button and the "buttons are exchanged for example when I press on I get" "" "quote markes and vice versa."Does anyone else have this glitch, or / and know how to solve? see you soon
-
Is - this "slippage" has multiplier
Thank you.
-
SSC and authorization - question
I AROUND 1250 and I want to install my own Sertificate tour because I want to have a secure communication between LAP 1252 and WLC 4400 LWAPP. How to install can have the certificate from CA MS kneeling? I have already installed my MS WLC CA certific