Play Waveform
Dear all,
I'm trying to generate a number of different signals through playwaveform Subvi. He works with me, but the problem is in the sound I hear is not continuous. Attached to the VI (LabVIEW 2011, Windows 7).
I appreciate your help
You can read/study the palette 'Sound' (with examples and help files) in order to better employment.
PFA.
Kind regards
Yogesh Redemptor
Tags: NI Software
Similar Questions
-
Hello
I want to play a .wav file, play and then stop when I press a button.
The problem is that when I press the button stop that noise does not immediately stop, but only when it reaches the end of the file. How can I solve this problem?
(The FALSE case in my VI structure is empty)
Thank you!
Do not use the express vi, use the sound output facing the square. Here's a quick way to do it.
Ben64
-
I have a VI in labview that accepts an array of a .NET and reading it with DAQmx, a value of every millisecond.
I do the same thing with Veristand 2011, programmatically.
As far as I understand it, looks like I can do this in 2 different ways:
(1) write some files that the stimulus profile editor can read and open it with the stimulus API profile editor
(2) a custom device and use an entry for the table
Am I missing something? I'm a noob with Vstand.
THX,
Matteo
There is an example of the expedition which does almost exactly what you want, and could be a good starting point of reference. It does not even require any written stimulus profiles or sequences in real time, because a real-time sequence comes with VeriStand designed for purposes of reading, and this example uses this one directly.
See:
\examples\NI VeriStand\API\Execution API\Sequences\Play Waveforms\Waveform player Example.vi. The only difference is that this example is based on the type of waveform data, that has a setting dt and t0 in addition to the values there. But it's a trivial change to make.
-
Difficulties to get its entry set up and its entry to read more than 2 channels
I need a multichannel audio for my project. I can't read more than 2 channels of my audio interface.
The interface Im using is a mixer Alesis Multimix8 USB 2 and audio interface. It supports 10 channels and 2 outputs. With other software, I can read that all the channels simultaneously, without any difficulty of entry. When I specify the audio set up and read of input sound, to read more than 2 channels of any extra channel is a white signal. I'm using Labview 8.5 here.
Have a look here
http://forums.NI.com/T5/LabVIEW/play-waveform-express-VI-list-devices-on-front-panel/TD-p/1559336
-
sound and Vibration Assistant. Speaker output
I am new to the sound and Vibration Assistant and he had to get monitored sound of a surfboard 4722 the speaker to computers. I can capture data and display it, but I want, but can't seem to find a way to get the sound to the speakers. Thanks for any help
Hi Mike.
Unfortunately, the Sound and Vibration Assistant doesn't have a built-in way to route your signal input to your speakers.
However, if you have LabVIEW, you can add a step to run a LabVIEW VI that generates output a file from your computer speakers (or external speakers). You must write a LabVIEW program that either acquires a signal or load a file of recorded signal, then this signal to your speakers. "You will most likely use the Play Waveform Express VI of the Express" exit pallet on the block diagram. "After you wrote this program, you need to add a step in the sound and Vibration Assistant using the Add a step" run a LabVIEW VI.
I hope this helps. Good luck with your application!
-
Can Unflatten string could be used to play the waveform given .dat file
Hi, refer to these two threads
http://forums.NI.com/T5/LabVIEW/can-LabVIEW-read-dat-file/TD-p/2243080
http://forums.NI.com/T5/LabVIEW/2-complement-hex-convert/TD-p/2245980
I tried to read the file Dat using string Unflatten and Got this error.
Can someone tell me how to do?
-
MainStage "lag" when you use the SPACEBAR as 'play '.
Hi all, I'm relatively new to Mainstage (V3), and I'm hoping to use it for the first time this weekend to play the extra backing with a band tracks
The issue I'm having, is that with the SPACEBAR of laptops on 'PLAY '. It is often "lag". or simply does not start the song. I have to wait a second, then hit again, it will work. It is almost as if in Performance mode, when you use the down arrow key to select the next song, the 'focus' is on the list of patch, and if I click in the background where are playback buttons and stop, THEN that will work. I have not, however, been able to reproduce this particular behavior on a consistent basis.
Everyone knows the same thing? Or why it is so 'all or nothing '?
And a question important much donor... I gave all my reading titles to the waveform appropriate the other night (so I could visually see the waveforms above the attenuator as offers of backing track model), however, once I was moving songs in a different order, which stopped working. No idea why?
Thnaks in advance
About the offset by hitting the space bar, a thought occurred to me.
How Mainstage allocates 44.1/16 bit wave files used in the reading plug-in? Which means, when a song is selected, which uses, for example, to separate the 5 cases of reading, one can assume that these audio files used in that song would need to "load" first.
Anyone know if this is how Mainstage works?
-
How to open file audio waveform
We have a file on a USB audio waveform. iTunes will not play it... any suggestions or recommendations on another application to use or download? Thank you!
VLC download it here: VLC for Mac OS X
-
Indicator of waveform data dashboard with multiple locations
I have a chart in waveform with multiple locations on my main VI running.
I use the Application Dashboard data 2.2.1 on my Ipad to monitor table of wave shape of my running app. I placed a marker on my Ipad and also related waveform with my waveform array variable. I can't play my data dashboard application because it shows unable to connect to the server. I noticed that it is because of multiple plots being plotted on my table of waveform.
I could only play the App data dashboard when it is just a single parcel related to an indicator on the App.
My question is if it's possible to have a graphical indicator of waveform on a data dashboard that has several plots being plotted and not only a single square, and how to configure it?
Thank you.
Click on Bravo and select as an accepted answer. You are welcome.
-
Redeclenchables/continuous to a custom waveform analog output?
Hello
I try regular output an analog signal using the box USB-6211 and Labview2009. I looked at various examples of waveform, including the retriggerableAO.vi example, but I can't seem to understand how to send a 'waveform' custom stamp (terminology is perhaps the question). In all the examples (including waveformbuffer), I ran across the single waveform, the options are sine, square, etc. Previously, I posted on this forum looking for hardware suggestions (link here) and explained what I try to do and got the big help. To sum up, I would like to read a 'waveform' from a text file, send it to the usb-6211 buffer and then continue to an analog channel. At the same time, I'll use the beginning of the analog task to trigger a digital signal once per cycle as well.
I got in what concerns the establishment of the waveform, but am stuck to figure out how to get into the buffer and setting the frequency, etc.
Thank you
Gabe
Hi Gabe,
Dennis is correct that it will take some room to modify the existing screws to fit your need. As he says, the Con Gen tension Wfm - Int Regeneration.vi Clk - no example provided with LabVIEW. In the example, it can be shown that there is a custom VI used to explain the problems that arise when a waveform of a given frequency to a frequency of sampling and outputs analog specified.
With all that said, it seems you want to read from an existing waveform file that you created and this waveform to an AO output channel. There are a few things that will be needed to know before proceeding:
-What is the waveform as you try to output (5000 samples, 10 k, 100 k, etc.)?
-What pieces of the size of the wave you want output (100 samples at a time, etc.)?
-you want to again and again, or simply run through once the waveform looping?
Assuming that you already have the waveform and will only step by step, here's what I would like:
-break the large waveform into smaller pieces of waveform of standard size
-import the waveforms in LabVIEW and create an array of waveforms
-bring the waveform in the example Dennis mentioned previously with automatic indexing enabled on the tunnel
-Remove the generator of wave functions existing the while loop
-wire your indexed table of waveform for the data of the VI DAQmx of analog output terminal
It is possible that you will have to play with the settings of your waveform and timing of your VI, but this should be a good starting point. Please let me know if something is not clear or if I have misunderstood your original message. Have a beautiful reast of the day.
Best,
-
Multiple waveform graphs do not simultaneously view data
Hello
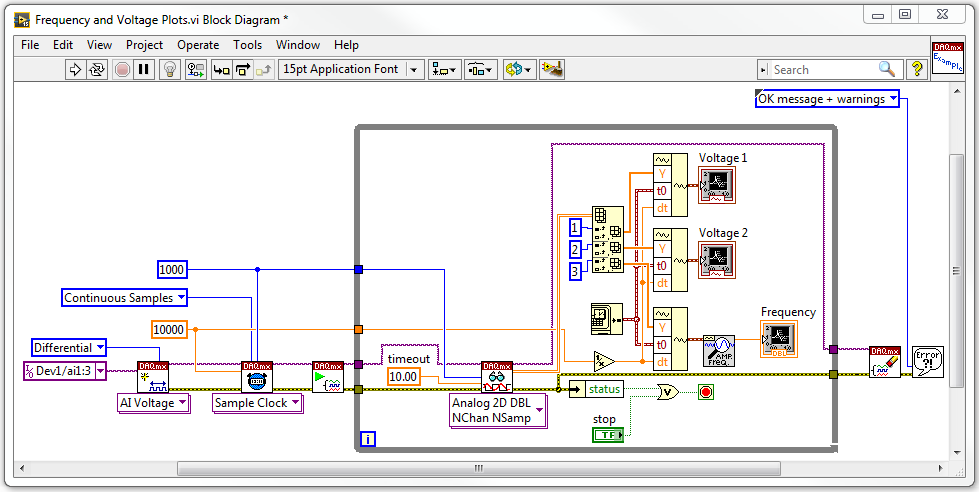
I use a box USB-6009 to acquire three analog input voltage signals simultaneously. I want two plot the voltage wrt time signals, while the third signal, I want to extract the frequency and then draw the wrt time frequency. I want the three of us graphic waveform having a category axis in units of seconds from zero seconds. My diagram of block VI is below:
When I run the VI, I get some problems. First, the frequency table is not plotted all the data, and although I am happy, time begins and reset it's count in tenths of seconds rather than in seconds.
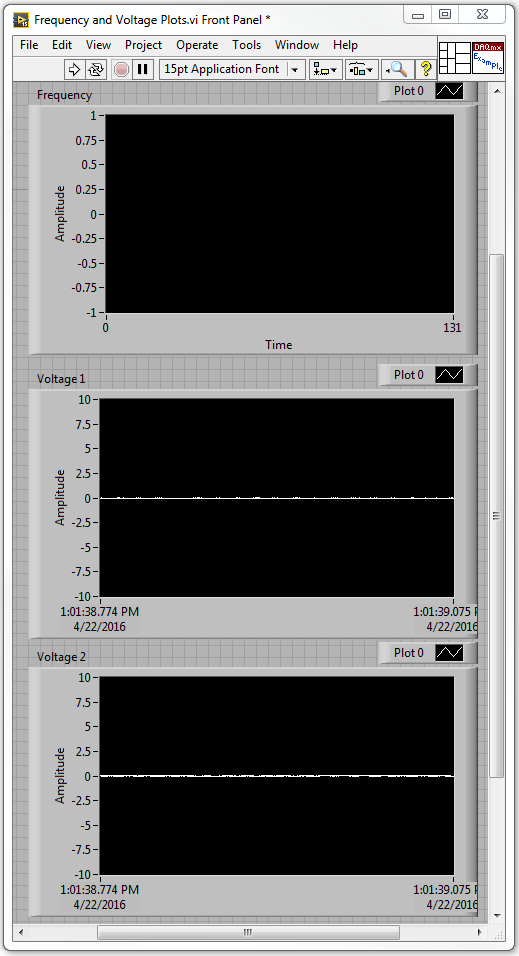
With the voltage 1 and 2 maps, the voltage is read correctly, but the x axis are in terms of date and instead of seconds. The front of the VI is below:
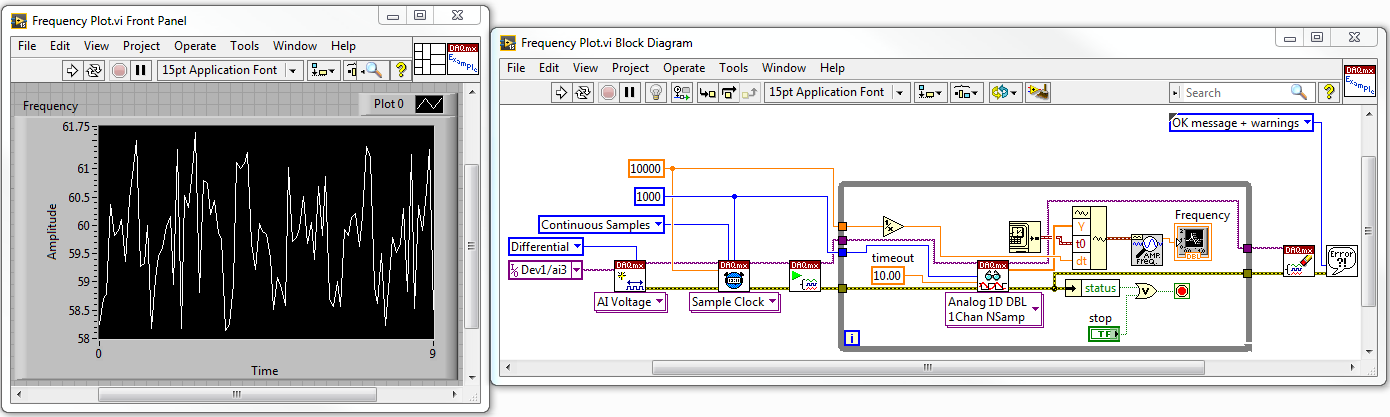
I tried to run the VI with only the third signal voltage being played and the table of wave shape of the plots the frequency perfectly. The Panel diagram and the block before lower is to:
Could someone tell what I'm doing wrong in the first VI?
1. you must use the version of waveform table Mutiple multi-channel DAQmx Read Points. Then, you don't have to accumulate the waveforms yourself.
2 tables index is 0-based. Thus, the filrst of the table element is actually 0, not 1.
-
Hello
I have a request I'm two signals to measure voltage in and feeding these signals to the mask and limit test VI to check if the signals are at your fingertips.
I want to have 1000 samples7sec (1 kHz sampling frequency). The software works well but the only problem is with graphical waveform updated. If I run the loop of producer with 1 ms, in the log file, I have 1000 samples/s, BUT I see nothing on the waveform table (the second graph on GUI). I mean, I do not see the tolerances and my i / p signal.
When I run the loop of producer with 2 ms, I can see signals on form of wave, but in the log file table, I have 500 or lower than that of the samples/s. I tried to change the rate of smapling but without success.
Any help would be appreciated.
see the attached example VI
1. with a continuous sampling, you do not want to set the size of buffer. Just let him be the default (which is quite large).
2. you really do not want a waiting in your loop of producer. Instead, you must inform the DAQmx Read to read something like 100 samples. Waiting for the upcoming data will limit your loop rates.
3. your second table is actually a chart. A graph has the whole story and shows exactly what you gave him changed. So, if you were trying to get all of the samples every 1ms when you are sampling at 1 kHz, you get 1 sample buffer playing and only 1 sample will be on the chart, making it appear as there is nothing in the graph. When you go to 2ms, you get 2 samples to appear on the chart. So I think you want to replace it with a chart.
-
Table to convert 1 d of waveform (DBL); Convert the table to a 1 d of waveform (LDM)
Hola a todos soy nuevo in LabVIEW asi os ruego patience, mi duda're basica y annoyingly, como hago para convert a table 1 d in una Forma Onda 'Waveform (DBL)', os editor una imagen y mi VI, Gracias.
Hi all, I am new to using LabVIEW, so I beg you patience, my question is basic and simple, how to convert an array of 1 d in a waveform (DBL), thank you
In my view, that the sound VI gives you a waveform for the right channel and one for the left. For example, you may have to play with the index to determine which channel you want.
-
determination of the sampling rate and the frequency waveform data record
Hello
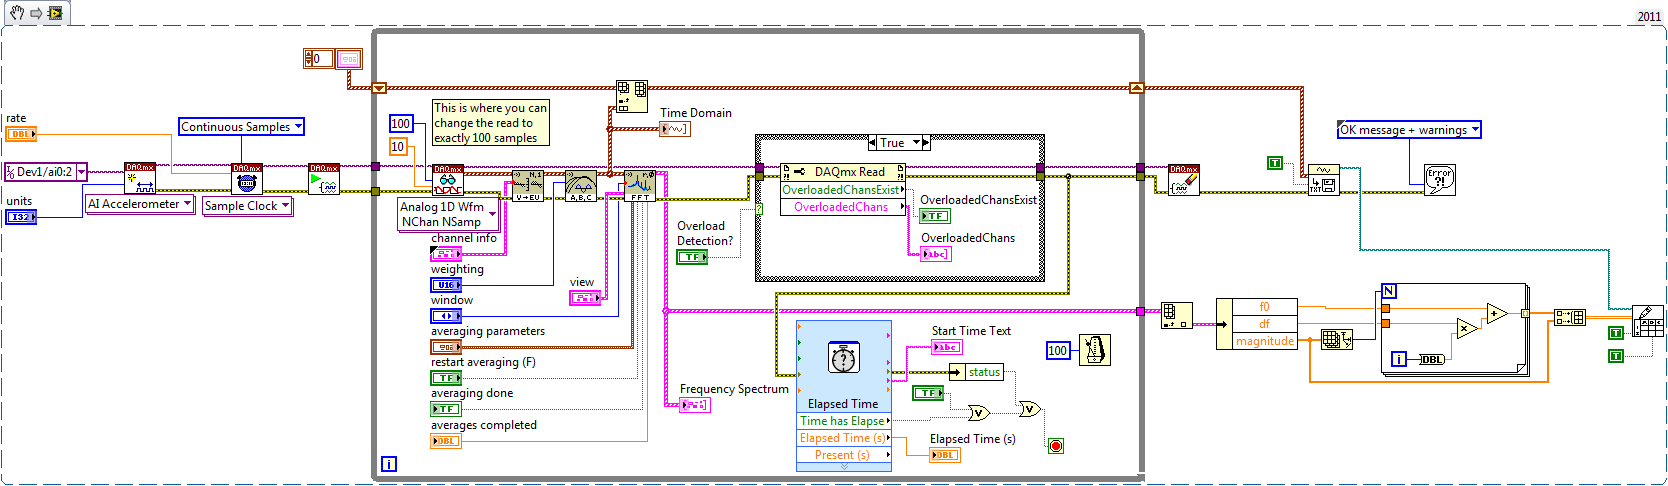
I write a simple program that collect data from a triaxial accelerometer input, convert it to a frequency spectrum, and then save the time domain and the frequency of the waveforms in an external file separated. I don't understand how to set the sampling frequency, however. On the DAQ Assistant, I updated the acquisition mode "Samples continues" and read samples is 2 k, which corresponds to the total number of data points that are collected. How can I program sampling for awhile, it 30 seconds, for example? Wouldn't be better to set up a trigger, as it will continue to collect data up to what I told it to stop?
I also want to save waveform data in a separate file that can be easily seen by other computers that have not installed Labview. I have currently the program put in place to convert a text string of the waveform of the time domain and then save it in a text file or a spreadsheet. It works fine, but I would also like to record the frequency wave, which is a different type of data. How can I do this or is there a better way?
My program is attached. Thanks for your help!
Here's how you can use the shift register to build the table, and also where you can choose to play exactly 100 samples per while the loop iteration.
Brian
-
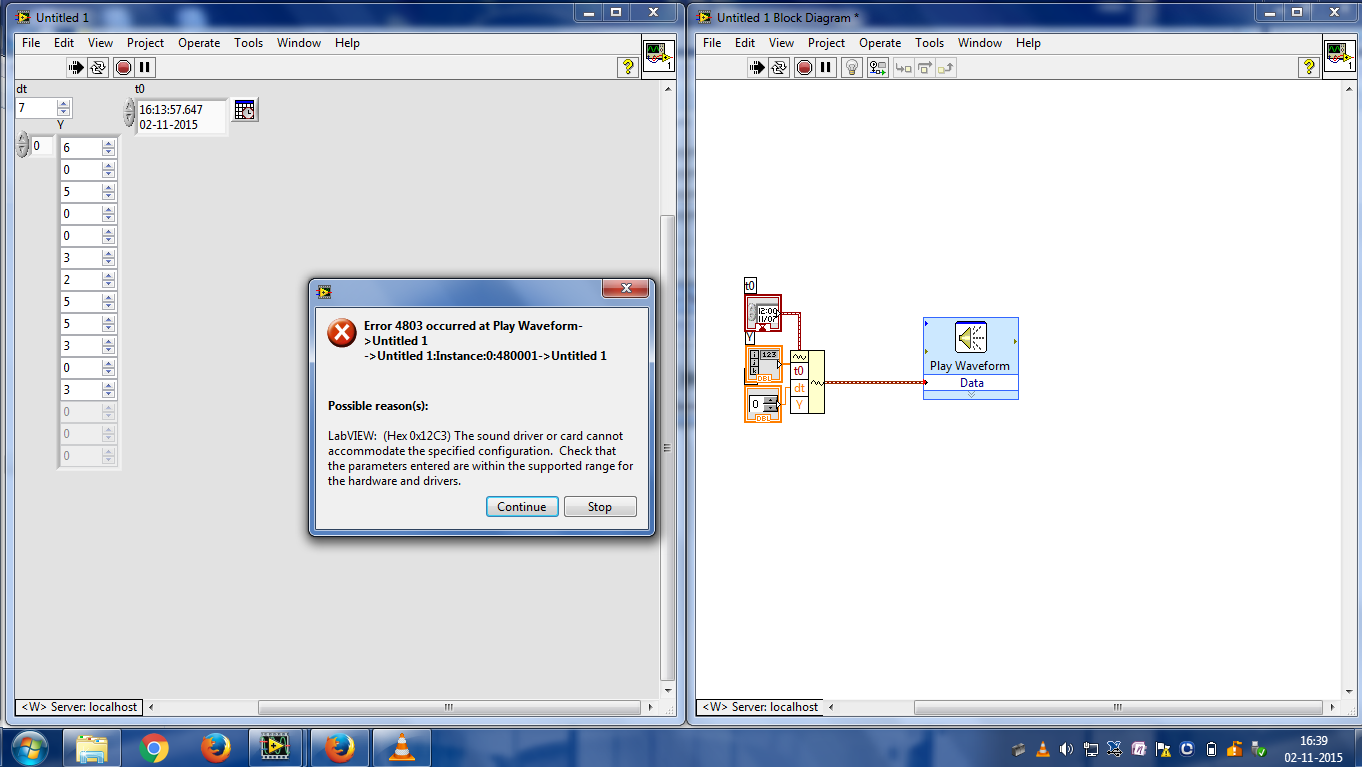
When I play the audio file using the speakerphone built into the laptop, it shows the error code 4803 and displays the message "the audio driver or the card cannot accommodate the specified configuration". Anyone know the reason?
Probably because you're trying to produce a sound with a sample of 1 time / 7Hz, sound is normally sampled at frequencies as 44 kHz. Dt needs being something that is valid for the audio device, would be my guess.
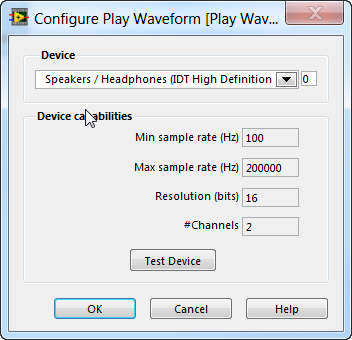
If you double-click the express VI, it should show you the capabilities of 'device' which will tell you the minimum and maximum sample rate (in Hz, use the reverse to get the dt) of the wave.
Try to use the file of the 'sound' load or generate VI of waveform to create a waveform sound valid.
For my audio device, the minimum frequency is 100 Hz (dt = 0.01 s):
Maybe you are looking for
-
Hello again once, someone can tell me how I can open and manipulate (convert to Excel?) a database file created on a PC with 9 of paradox to Corel on my iMac? The answer would be as simple as buying the paradox for Mac? I don't even know if Paradox
-
Time Machine does not recognize the backups when you configure the external drive as a network drive
I have a MyBook 5 to disk with a 1 TB partition that I used as a destination for Time Machine > 1 year now. I recently gathered the energy to connect the my book on my Airport Extreme Base Station (model 2014? the second model) to implement wireless
-
iCloud Photo Library used Incorrect storage
Hi all I have the following problem with iCloud storage of photo library: So before you save a 10 Min video I used 1.5 GB on iCloud storage. I recorded the video and takes 3 pictures, I uploaded the video to Youtube and deleted photos and recently de
-
BBM HELP! BBM STUCK ON SETTING UP SCREEN BLUE FOR DAYS!
My bbm display picture did not change for a few days that neither were some of the messages delivered, so I deleted and reinstalled. Since then, all I could do was agree to the terms and conditions and then a blue screen comes up with either "bbm imp
-
Hello.. BBM is sure to send photos. ?IM using bbm on my samsung Galaxy phone... I'm living out of my house... me and my wife used to send our personal photos with this... is - it safe. ?Please clear me my doubts...Thank you..