Queue time Total STATSPACK
HI -.with the keys v 9.2
I wonder about the queue time Total (s) waiting for the Top 5 list of events.
I took a snapshot of 10.55 (min) but time to other (s) exceeds this, so I'm clearly interpreted something wrong:
Top 5 Timed Events
~~~~~~~~~~~~~~~~~~                                                     % Total
Event                                               Waits    Time (s) Ela Time
-------------------------------------------- ------------ ----------- --------
db file scattered read                            587,895       1,464    37.24
CPU time                                                        1,205    30.66
SQL*Net message from dblink                        22,597         609    15.49
db file sequential read                           478,006         554    14.11
log file parallel write                             6,335          28      .72
-------------------------------------------------------------How to establish a correlation between this time in the clock?
My hypothesis is that several sessions are added, and this number may exceed the time of the snapshot?
Published by: stg on October 17, 2008 09:50
rocr wrote:
the time is per processor, so if you have 8 processors and the clock of the report time is 6 minutes but 5 CPU use 3 minutes of treatment each then the total time is 15 minutes.
rocr,
You consider the "CPU time" component only.
The timeout can be much more than "snapshot interval * CPU_count". "" It can be bigger than "snapshot interval * number of sessions'." "
For example:
I lock a table in exclusive mode for 15 minutes.
100 other users try to update this table and must wait to release my lock.
Elapsed time = 15 minutes
Wait time = 100 * 15 minutes = 1 500 minutes.
Concerning
Jonathan Lewis
http://jonathanlewis.WordPress.com
http://www.jlcomp.demon.co.UK
"The greatest enemy of knowledge is not ignorance, it is the illusion of knowledge." Stephen Hawking.
Tags: Database
Similar Questions
-
Database queue time calculation.
Hi, I use 10.2.0.4.0 oracle version.
I need to find the queue time total for each day for each WAIT_CLASS and need to trace trends in the last days. I use the application below to get the details, but my results do not match with the ones I get in the AWR report. In my daily report AWR, "USER i/o" is coming in higher class waiting times, where as in my query, I get 'Application' on the highest expectation section. Total wait time is also different. Can you please help me to understand, what don't understand me in the query?
SELECT  wait_class,
     TO_CHAR (MIN (s.end_interval_time), 'DD-MON-YYYY DY HH24:MI')
         sample_end,
        SUM (WAIT_TIME + time_waited)  waittime
 FROM dba_hist_active_sess_history q, dba_hist_snapshot s
WHERE   s.snap_id = q.snap_id
      AND s.dbid = q.dbid
      AND s.instance_number = q.instance_number
      AND s.end_interval_time >=
             TO_DATE (TRIM ('16-Oct-2012 '), 'dd-mon-yyyy hh24:mi:ss')
      AND s.begin_interval_time <=
             TO_DATE (TRIM ('18-nov-2012 '), 'dd-mon-yyyy hh24:mi:ss')
     AND wait_class in ('User I/O','System I/O','Concurrency','Commit','Other','Configuration','Network','Application','Administrative')
 GROUP BY trunc(s.end_interval_time),wait_class
ORDER BY trunc(s.end_interval_time),waittime desc
SELECT Trunc(end_interval_time), wait_class, SUM(time_waited) FROM dba_hist_service_wait_class join dba_hist_snapshot USING(snap_id) GROUP BY Trunc(end_interval_time), wait_class ORDER BY Trunc(end_interval_time), wait_class;Published by: JohnWatson on 7 November 2012 16:34
Formatting. -
(Reference #7231113) Loop to control phase a queue time
(Reference #7231113) Loop to control phase a queue time
-
Is there a way to UCCX to allow callers know that if the estimated wait time is more than 5 minutes or less than 5 minutes to invite? I wonder that the appellant only tell if their place in the queue is less than 5 or more than 5 minutes; not accurate time. I know that this could be frustrating to hear an appeal if you have been on hold for 35 minutes hear, 'your estimated wait time is more than 5 minutes." But that's what I wonder...
Thanks in advance!
Yes you can, first of all, only to play the guest once when the appellant gets first in the queue. Then don't play the estimated time thereafter.
Had the Statisic get reporting and put on in an INT.
Then, use an IF statement for more or less than 5 minutes.
I would like to know if you need help, I am out of the Office right now, but can you send a sample of the latter.
-
AWR: Time CPU = 0, % of time Total DB > 0
Hello!
I use * 10.2.0.5 *, AWR I see next statistical operation in one of my report:
Please explain, how is it possibleSQL ordered by Elapsed Time CPU Time ... % Total DB Time 0 12.21
DB-time does not time CPU here?
Thank you and best regards,
Pavel
Published by: Pavel on April 18, 2012 04:17Hello
for explanation of time CPU and DB, please visit http://savvinov.com/2012/04/06/awr-reports-interpreting-cpu-usage/.
In your case, I think that the numbers is not reliable due to errors of instrumentation (for example, I saw 0 time processor in an extremely overloaded system).
Best regards
Nikolai -
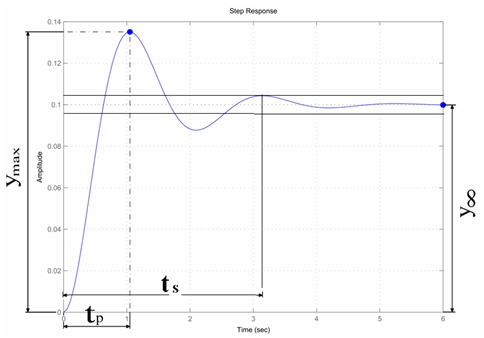
Hello, I have a code in labview that generates a signal like this:
and I would like to stop the execution of the code when the execution time is equal to the duration of settling of the signal, is there a way to do this?
I need a command that calculates this running-in of the signal that I'm generating
Thank you
-
Movie offer, before their download queue time
The waiting time for movies free offer to download
Contact your local Sony
-
The task manager time total CPU ReSet
.
I need - want - see time CUMULATIVE CPU used
Since any arbitrary time, I select - by-
Reset the time used to ZERO Task Manager.
.
How can I do this?
.
Reason:
I want to know which processes are using just a lot of time CPU
While the system is supposed to be "ASLEEP".
I look at the graph of 'performance' TM
IMMEDIATELY after the awakening of the system - and -.
See the different degrees of time CPU has been used
just before I woke up to the system.
.
What activity - what Applications/tasks/processes
are so VERY active when the system is supposed to be "asleep"?
.
I use Win 7 Pro 64 bit.
.
Hello
Thank you for visiting the Microsoft Community Forum.
The question you asked is more applicable to be posted on the Microsoft TechNet Forums. We have a support forum dedicated to complex issues. I suggest you to post your query on Microsoft TechNet help on this forum. You can get more effective suggestions and adapted by experts familiar with this topic. Your understanding is appreciated.
Here is the link:
http://social.technet.Microsoft.com/forums/Windows/en-us/home?category=w7itpro
Hope this information is useful. Feel free to write us again to the case where you are facing in the future any other problem with Windows.
-
How can I control whether or not an audio queues times at the start of a slide?
I am putting together a course and I have an audio welcome that plays automatically when the user starts the course. Since this slide contains a list of the modules that will be ongoing, I would also like to the use it as a navigation option - click on the link 'Menu' on any slide and return to this page.
The problem: whenever the page is hit the audio playback.
The question: How can I set the audio to only run the first time the page is entered but not yet?
I created a variable called "PlayWelcomeAudio" and set it on 'Y' at the beginning, can have an advanced action script that modifies the variable "N" when selected (progress throughout are linear, so there is only one option available to the user at this point.) By clicking on this link opens the next page and sets the "PlayWelcomeAudio" "N".
I see that the variable has been set correctly (when I start it up is "O" and when I come back, it's "N"), but I don't see any place where I can put the audio file so it does not play.
I tried setting on '1' cpCmndMute but that has not worked because it apparently is a global setting and I don't no audio playing anywhere after that.
I don't have to pause the timeline or something like that. I just want the audio to play first, but not the second and the following page is hit.
Thoughts? Suggestions?
Thank you.
Michael
Set your audio welcome to an object that is not seen (e.g. a highlight area set to 0%) and use your stocks advanced and variable to HIDE this object ON SLIDE ENTER if the user comes back in the same Menu slide at a later stage in the course module.
This should mean that the first time that the user gets to this slide, the audio will play. But every subsequent hour, they come back on this slide, the object will be hidden immediately on entering the slide, which means that the audion does not play and sees all users are the menu options.
Your alternative strategy would be to have two slides that look almost the same. The first has the audio, and the other does not. Your TOC for Menu item and all other links in the project that point to the Menu, go to the second slide without audio. The user no longer wise will also be long as you train to navigation.
-
How do you find the total duration of a project in Captivate 5? I've seen answers for previous versions; However, the menus are not exactly the same in Captivate 5.
Thank you!
Hello
There is no easy way more like in the table of Storyboard. Take a look at the table of contents: you will find in the Project menu or use SHIFT + F10. Select the table of contents, having an overview and by default, the total duration of the project is visible in the lower part of the table of contents:

Lilybiri
-
Queue time Long in Windows Explorer
I did an upgrade from Vista to Win 7 Home Premium 32 bit.
Everytime I open windows Explorer and go to any folder that has a large number of files it contains, the address bar of windows explore turns into a bar green thermometer that takes forever to fill. Then, if you want to sort the results of this long waiting to something as updated or something, it does all of the process even more.
Is there a way to disable this painful process or speed it up significantly?
Thanks for your help.
Hi dblbogey1,
Thank you for visiting Microsoft Answers.
I have a few steps that might help you solve the problem.
1 put the computer to boot and check if the problem persists.
2. scan your computer of viruses or malware.
Run Analyzer online to check any malware or virus activity. Link below will help you launch the free scan on the computer.
http://OneCare.live.com/site/en-us/default.htm
To perform a clean boot on a computer that is running Windows Vista, follow these steps.
1. click on Start, type msconfig in the Search box and press ENTER. If you are prompted for an administrator password or a confirmation, type the password, or click continue.
2. in the general tab, click Selective startup.
3. under Selective startup, clear the Load Startup items check box.
4. click on the Services tab, select the hide all Microsoft Services check box, and then click disable all.
5. click on OK.
6. When you are prompted, click restart.
7. after the computer starts, check if the problem persists.
If not, then follow the steps mentioned in the article: http://support.microsoft.com/kb/331796
To restore your computer to a Normal startup mode, follow these steps.
In the box to start the search , click Start .
1. type msconfigand press ENTER. If you are prompted for an administrator password or a confirmation, type the password, or click continue.
2. click on the general tab.
3. click on Normal Startup - load all drivers of devices and services, and then click OK.
4. When you are prompted, click restart to restart the computer.
Swati K - Microsoft support technician
Visit our Microsoft answers feedback Forum and let us know what you think.
-
Queue time absolutely absurd to activate Acrobat
It's the third phone call, all 3 more 45 minutes (why 3? The first 2 I logged out), to activate this product. Unacceptable for a product $400 +. Adobe: If you use the guilty until proven innocent of the licenses, I suggest that you pick up the phone faster.
It is very rare when a current employee of Adobe posts in these forums. More with this new layout of the forum.
While you're waiting (and waiting), here's a letter from the VP of Technical Services on their / customer service.
http://www.Adobe.com/support/open_letter_to_adobe_customers/
-
What is the measure of the value "Waiting" in AWR report?
Event Expected % Time - out Wait total (s) times AVG wait (ms) Waiting for /txn SQL * Net more data from dblink 406 747 466 1 184.13 reading of scattered files DB 28 659 330 12 12.97 SQL * Net message from dblink the 30 115 254 8 13.63 log file parallel write 21 021 177 8 9.52 Hi all
As the example below, I question what is the measure of the value "Waiting" in the section "event wait" AWR report?
Because "Expected" the value is high, but "Queue time Total (s)" is low. example "SQL * Net message from dblink the" a 30 115 "expected' but 'Queue time Total (s)' lower 'DB file scattered read' w 28 659 'wait '.
Could you please explain more about the value "waiting"?
Thank you
Hiko
taohiko wrote:
Event Waits %Time -outs Wait total (s) times Avg wait (ms) Waits /txn SQL * Net more data from dblink 406 747 466 1 184.13 reading of scattered files DB 28 659 330 12 12.97 SQL * Net message from dblink the 30 115 254 8 13.63 log file parallel write 21 021 177 8 9.52 Hi all
As the example below, I question what is the measure of the value "Waiting" in the section "event wait" AWR report?
It is simply a... count the number of times where the system had to "WAIT" on the specified event.
Because "Expected" the value is high, but "Queue time Total (s)" is low. example "SQL * Net message from dblink the" a 30 115 "expected' but 'Queue time Total (s)' lower 'DB file scattered read' w 28 659 'wait '.
Watch "AVG time-out. In one case, there are fewer occurrences of the event, but the average wait by event time was higher.
If I buy 3 burgers and pay $1000 each
or I buy 500 burgers and pay $1.00 each.
Why 3 hamburgers cost more than 500 burgers?
Could you please explain more about the value "waiting"?
"Waiting" is the number of times that the system had to wait for the named event, during the sampling period.
"Total wait time" is the total time (measured in seconds) spent waiting on all occurrences of the specified event, during the sampling period.
"Avg" wait"is the time (expressed in milliseconds) means spent on each occurrence of the specified event, during the sampling period.
It seems pretty obvious. You count how many times it happens something (wait), you measure it, time spent doing this something fracture (total wait time) and tells you the total time spent (total wait time) by the number of times it happened (waits) to find out the average time spent on each occurrence of that something.
Thank you
Hiko
-
Insertion of the Oracle is slow
Hello
On my production server with the problem of the insert. Regular load of Leon SQL file, it takes longer to insert data into the database.
First 2 and 3 a single file hours take 8-10 seconds after he took 5 minutes.
According to my understanding, OS e/s is very slow, the first 3 hours DB buffer is free and insert data in a normal buffer.
But when the buffer is filling then goes buffer waits and then insert is slow on. If this rite it please tell me how to increase I/O.
Somewhere here from my server analysis...
[root@myserver ~] # iostat
Linux 2.6.18 - 194.el5 (myserver) 01/06/2012
AVG - cpu: nice % user % iowait idle steal %System% %
3.34 0.00 6.66 0.83 89.17 0.00
Feature: GST Blk_read/s Blk_wrtn/s Blk_read Blk_wrtn
SDA 107,56 2544.64 3140,34 8084953177 9977627424
sda1 0.00 0.00 0.65 2074066 16
sda2 21.57 220.59 1833,98 700856482 5827014296
sda3 0.00 0.00 0.00 12787 5960
sda4 0.00 0.00 0.00 8-0
sda5 2.75 0.69 15,07 8739194 47874000
sda6 0.05 0.00 0.55 5322 1736264
sda7 0.00 0.00 0.00 2915 16
sda8 0.50 9.03 5.24 28695700 16642584
sda9 0.51 0.36 24.81 1128290 78829224
sda10 0.52 5.98 0.00 9965 19004088
sda11 83,71 2311.26 1254,71 7343426336 3986520976
[root@myserver ~] # hdparm - tT/dev/sda11
/ dev/sda11:
Timing cached reads: 10708 MB in 2.00 seconds = 5359,23 MB / s
Calendar of the reading disc in the buffer: 540MO to 3.00 seconds = 179,89 MB / s
[root@myserver ~] # r-s u o 1 6 datafile
Linux 2.6.18 - 194.el5 (mca-webreporting2) 01/06/2012
09:57:19 CPU user nice % % iowait idle steal %System% %
09:57:20 6.97 0.00 all 1.87 16.31 74.84 0.00
09:57:21 6.74 0.00 all 1.25 17,48 74,53 0.00
09:57:22 7.01 0.00 all 1.75 16.27 74.97 0.00
09:57:23 6.75 0.00 all 1.12 13.88 78.25 0.00
09:57:24 6.98 0.00 all 1.37 16.83 74.81 0.00
09:57:25 6.49 0.00 all the 1.25 14.61 77.65 0.00
Average: all 6.82 0.00 1.44 15.90 75.84 0.00
[root@myserver ~] # r-s u o 1 6 datafile
Linux 2.6.18 - 194.el5 (mca-webreporting2) 01/06/2012
09:57:19 CPU user nice % % iowait idle steal %System% %
MCA-webreporting2; 601; 2012-05-27 16:30:01 UTC 2.54; 1510.94; 3581.85; 0.00
MCA-webreporting2; 600; 2012-05-27 16:40:01 UTC 2.45; 1442.78; 3883.47; 0.04
MCA-webreporting2; 599; 2012-05-27 16:50:01 UTC 2.44; 1466.72; 3893.10; 0.04
MCA-webreporting2; 600; 2012-05-27 17:00:01 UTC; 1394.43; 3546.26; 2.30 0.00
MCA-webreporting2; 600; 2012-05-27 17:10:01 UTC; 1529.72; 3978.27; 3.15 0.04
MCA-webreporting2; 601; 2012-05-27 17:20:01 UTC 9,83; 1268.76; 3823.63; 0.04
MCA-webreporting2; 600; 2012-05-27 17:30:01 UTC; 1277.93; 3495.32; 32,71 0.00
MCA-webreporting2; 600; 2012-05-27 17:40:01 UTC, 1.96; 1213.10; 3845.75; 0.04
MCA-webreporting2; 600; 2012-05-27 17:50:01 UTC; 1247.98; 3834.94; 1.89 0.04
MCA-webreporting2; 600; 2012-05-27 18:00:01 UTC; 1184.72; 3486.10; 2.24 0.00
MCA-webreporting2; 600; 2012-05-27 18:10:01 UTC; 1320.73; 4088.14; 18.68 0.18
MCA-webreporting2; 600; 2012-05-27 18:20:01 UTC; 1137.28; 3784.99; 1.82 0.04
[root@myserver ~] # vmstat
System procs - memory - swap - io - cpu -.
If free buff cache TR bi of the swpd b r bo in cs us sy id wa st
0 0 1 182356 499444 135348 13801492 0 0 3488 247 0 0 5 2 89 4
[root@myserver ~] # dstat sda d
-total-cpu-usage - dsk/sda -net/total - pagination - system.
usr sys idl wai hiq siq | read short | recv send | out | CSW int
3 1 89 7 0 0 | 1240 1544 kaka | 0 0 | 1.9 B 1 B | 2905 6646
8 1 77 14 0 1 | 4096 b 3616 k | 433 k 2828B | 0 0 | 3347 16 k
10 2 77 12 0 0 | 0 k 1520 | 466 k 1332B | 0 0 | 3064 15 k
8 2 77 12 0 0 | 0 2060 k | 395 k 1458B | 0 0 | 3093 14 k
8 1 78 12 0 0 | 0 1688 k | 428 k 1460B | 0 0 | 3260 15 k
8 1 78 12 0 0 | 1712 0 k | 461 k 1822B | 0 0 | 3390 15 k
7 1 78 13 0 0 | 4096 b 6372 k | 449 k 1950 | 0 0 | 3322 15 k
Leaves AWR
Wait events
waiting time-controlled desc, waits desc (idle last events)
------------------------------------------------------------------------
Event wait % Time - out of the queue time Total (s) Avg wait /txn (ms) waiting
buffer without waiting for 1 591 125 99.95 19 814 12 129.53
log file parallel write 31 668 0.00 1 413 45 2.58
buffer busy waits 846 77,07 653 772 0.07
control file parallel write 10 166 0.00 63 636 0.83
Synchronize file journal 0.00 11 301 565 50 0.92
write complete waits 218 94.95 208 955 0.02
SQL > select 'free in a buffer (NOT_DIRTY)', round (((select count (DIRTY) N_D v$ bh where DIRTY = 'n') * 100) / (select count (*) from v$ bh), 2) | ' %' DIRTY_PERCENT of the double
Union
2 3 select "keep in the buffer (YES_DIRTY)', round (((select count (DIRTY) N_D v$ bh where DIRTY = 'Y') * 100) / (select count (*) from v$ bh), 2) | ' %' Double DIRTY_PERCENT;
"FREEINBUFFER (NOT_DIRTY)" DIRTY_PERCENT
--------------------------- -----------------------------------------
free in the buffer (NOT_DIRTY) 10.71%
Keep buffer (YES_DIRTY) 89,29%
Cloth...
Published by: 928992 on 1 June 2012 10:35You can do direct path inserts to improve the management of the buffer with sqldr.
Please find in the documentation and you will see that you can do this with your current file of the sqldr control.
You may need to ALTER TABLE... NOLOGGING before running sqldr and then ALTER TABLE... RECORDING subsequently
Simon -
Total connection time how to account with GANYMEDE.
Hi, we have the following scenario, this company uses two methods for remote access (for employees only): through RAS connections, or by using VPN clients to connect to a 535 PIX over the Internet. We need to do accounting for the total connection time, in the case of RAS connections is easy, we run AAA GANYMEDE + between the RA and the ACS (ver 2.1) and check the start/end time. But with the Internet connection start/stop time reflects the total time for each connection by user i.e. telnet, snmp, ftp, etc. but what connections can be simultaneous (or not), so we can not just add every time total of connections to a single user, it could be greater than the actual time that this user has been really connected. So how could account us for in this case total connection time?
Thanks in advance for your recommendations
Unfortunately you don't have. Accounting for users in the PIX VPN is on the Board to design for some time now, but so far has not been implemented. You can check the status on bug ID CSCdu01327 for other updates.

Maybe you are looking for
-
I have a hp pavilion a6863w running Win7. I'm not all the sounds of my rear surounds and I can not find speaker adjustments. With Vista, you can set for the configuration of the room and everything. Is that in Win7 hidden somewhere? I looked everywhe
-
Cannot remove additional e-mail addresses of Apple ID
Hi all I have two old email addresses I want to remove from my Apple ID: none of them is my main email address. In tha Apple support page on your Apple ID - Apple supported email addresses , section "additional e-mail addresses", I see: If you want t
-
you tube streaming, i-tunes etc for tv
My brother has an iMac of mid-2010. He would like to be able to stream i-tunes, tube you, etc to his TV. I thought him a roku2 or a smart blu - ray player for Christmas. One of these would work, or is there a better option. Thank you
-
HP PROBOOK 450 - MEMORY TYPE DDR3 UNSUPPORTED
Hi all Is that the case on the HP ProBook 450 G3 as well? that is taking the G3 DDR3L (Note L) - 1.35v too? Thank you
-
Hello I use the COM adapter to call the TestComplete application. There are several steps in the sequence file, which is to run a script given in TestComplete. However TestStand doen't expect the TestComplete finish executing the script, beforeproc