Several "columns" in the charts in SVG/FLASH?
I need to create a pie with three elements... both are derived from a column in the database, while the latter is derived from another column. I've been playing with this for the last couple days.Because I know so little about this stuff, my last resort was to create hidden objects, with a SQL process to update the time "before the header" this work... but I can't understand how to obtain these three elements in my pie!
Here are my three sql statements, that I need to enter a pie chart:
Point 1: "Total needed.
SELECT COUNT (PRODUCT)
OF PRODUCT_DATA
WHERE PRODUCT = 'NO '.
AND PRODUCT_TYPE = 'HOME'
Point 2: "update more than 10 years'
SELECT COUNT (PRODUCT_DATE)
OF PRODUCT_DATA
WHERE PRODUCT_DATE < = TO_DATE (March 30, 1999 "," DD-MON-YYYY "")
AND PRODUCT_TYPE = 'HOME'
Point 3: "update < 10 years."
SELECT COUNT (PRODUCT_DATE)
OF PRODUCT_DATA
WHERE PRODUCT_DATE > = TO_DATE (March 30, 1999 "," DD-MON-YYYY "")
AND PRODUCT_TYPE = 'HOME'
(Ideally I would replace the 30 March 1999 ' with TO_DATE (TRUNC (SYSDATE)-10 years, 'DD-MON-YYYY'), but have not thought too much about it yet!)
Related to this... the above information has been imported from and Excel spreadsheet. The imported fine paintings... but there is a page with several graphics/tables which were all different formulas
I have created a calculation to update three points... but could not figure out how to put them in the pie chart:
P5_TOTAL_REQUIRED
P5_TOTAL_OVER_10YRS
P5_TOTAL_UNDER_10YRS
Appreciate any help!
KSL.
Hello
You can use UNION ALL to gather statements:
SELECT NULL LINK, LABEL, VALUE FROM (
SELECT 'Total Required' LABEL,
COUNT(PRODUCT) VALUE
FROM PRODUCT_DATA
WHERE PRODUCT='NO' AND PRODUCT_TYPE = 'HOME'
UNION ALL
SELECT 'Update Over 10YRS' LABEL,
COUNT(PRODUCT_DATE) VALUE
FROM PRODUCT_DATA
WHERE PRODUCT_DATE <= TO_DATE('30-MAR-1999', 'DD-MON-YYYY') AND PRODUCT_TYPE='HOME'
UNION ALL
SELECT 'Update < 10Yrs' LABEL,
COUNT(PRODUCT_DATE) VALUE
FROM PRODUCT_DATA
WHERE PRODUCT_DATE >= TO_DATE('30-MAR-1999', 'DD-MON-YYYY') AND PRODUCT_TYPE='HOME'
)
To the date of issue, you can use:
ADD_MONTHS(SYSDATE, -120)
Who will deduct 10 years (120 months) from now
Andy
Tags: Database
Similar Questions
-
What's the point of having several columns in the ORDER BY clause?
DB version: 10 gr 2
When you use the ORDER BY clause, the lines are always sorted by the first column in the ORDER BY clause. So, what's the point of having several columns in the ORDER BY clause (I always see this in production codes)?
For the below SQLs' schema SCOTT, result sets are always classified according to the first column ename. When I added use asc and desc of employment, does not change the result set.
SQL> select * from emp order by ename;

     EMPNO ENAME      JOB              MGR HIREDATE         SAL       COMM     DEPTNO
---------- ---------- --------- ---------- --------- ---------- ---------- ----------
      7876 ADAMS      CLERK           7788 23-MAY-87       1100                    20
      7499 ALLEN      SALESMAN        7698 20-FEB-81       1600        300         30
      7698 BLAKE      MANAGER         7839 01-MAY-81       2850                    30
      7782 CLARK      MANAGER         7839 09-JUN-81       2450                    20
      7902 FORD       ANALYST         7566 03-DEC-81       3000                    20
      7900 JAMES      CLERK           7698 03-DEC-81        950                    30
      7566 JONES      MANAGER         7839 02-APR-81       2975                    20
      7839 KING       PRESIDENT            17-NOV-81       5000                    20
      7654 MARTIN     SALESMAN        7698 28-SEP-81       1250       1400         30
      7934 MILLER     CLERK           7782 23-JAN-82       1300                    20
      7788 SCOTT      ANALYST         7566 19-APR-87       3000                    20
      7369 SMITH      CLERK           7902 17-DEC-80        800                    20
      7844 TURNER     SALESMAN        7698 08-SEP-81       1500          0         30
      7521 WARD       SALESMAN        7698 22-FEB-81       1250        500         30

14 rows selected.

SQL> select * from emp order by ename, job;

     EMPNO ENAME      JOB              MGR HIREDATE         SAL       COMM     DEPTNO
---------- ---------- --------- ---------- --------- ---------- ---------- ----------
      7876 ADAMS      CLERK           7788 23-MAY-87       1100                    20
      7499 ALLEN      SALESMAN        7698 20-FEB-81       1600        300         30
      7698 BLAKE      MANAGER         7839 01-MAY-81       2850                    30
      7782 CLARK      MANAGER         7839 09-JUN-81       2450                    20
      7902 FORD       ANALYST         7566 03-DEC-81       3000                    20
      7900 JAMES      CLERK           7698 03-DEC-81        950                    30
      7566 JONES      MANAGER         7839 02-APR-81       2975                    20
      7839 KING       PRESIDENT            17-NOV-81       5000                    20
      7654 MARTIN     SALESMAN        7698 28-SEP-81       1250       1400         30
      7934 MILLER     CLERK           7782 23-JAN-82       1300                    20
      7788 SCOTT      ANALYST         7566 19-APR-87       3000                    20
      7369 SMITH      CLERK           7902 17-DEC-80        800                    20
      7844 TURNER     SALESMAN        7698 08-SEP-81       1500          0         30
      7521 WARD       SALESMAN        7698 22-FEB-81       1250        500         30

14 rows selected.

SQL>  select * from emp order by ename, job desc;

     EMPNO ENAME      JOB              MGR HIREDATE         SAL       COMM     DEPTNO
---------- ---------- --------- ---------- --------- ---------- ---------- ----------
      7876 ADAMS      CLERK           7788 23-MAY-87       1100                    20
      7499 ALLEN      SALESMAN        7698 20-FEB-81       1600        300         30
      7698 BLAKE      MANAGER         7839 01-MAY-81       2850                    30
      7782 CLARK      MANAGER         7839 09-JUN-81       2450                    20
      7902 FORD       ANALYST         7566 03-DEC-81       3000                    20
      7900 JAMES      CLERK           7698 03-DEC-81        950                    30
      7566 JONES      MANAGER         7839 02-APR-81       2975                    20
      7839 KING       PRESIDENT            17-NOV-81       5000                    20
      7654 MARTIN     SALESMAN        7698 28-SEP-81       1250       1400         30
      7934 MILLER     CLERK           7782 23-JAN-82       1300                    20
      7788 SCOTT      ANALYST         7566 19-APR-87       3000                    20
      7369 SMITH      CLERK           7902 17-DEC-80        800                    20
      7844 TURNER     SALESMAN        7698 08-SEP-81       1500          0         30
      7521 WARD       SALESMAN        7698 22-FEB-81       1250        500         30

14 rows selected.
Search in this example, you will see the difference
SQL> create table test_order (name varchar2(10), surname varchar2(10), age number);

Table created.

SQL> insert into test_order values('Kamran','Agayev',26);

1 row created.

SQL> insert into test_order values('Kamran','Taghiyev',26);

1 row created.

SQL> insert into test_order values('John','Kevin',23);

1 row created.

SQL> select * from test_order;

NAME       SURNAME           AGE
---------- ---------- ----------
Kamran     Agayev             26
Kamran     Taghiyev           26
John       Kevin              23

SQL> select * from test_order
  2  order by age;

NAME       SURNAME           AGE
---------- ---------- ----------
John       Kevin              23
Kamran     Agayev             26
Kamran     Taghiyev           26

SQL> select * from test_order
  2  order by age asc, surname desc;

NAME       SURNAME           AGE
---------- ---------- ----------
John       Kevin              23
Kamran     Taghiyev           26
Kamran     Agayev             26

SQL>
When in the second query, I sorted out only for age, you saw it there two 26 years old Keita, there was first Agayev, then Taghiyev. But if I want to get the family names in descending order when there are two very old person, then I will add the second column in the order by clause
- - - - - - - - - - - - - - - - - - - - -
Kamran Agayev a. (10g OCP)
http://kamranagayev.WordPress.com -
How to reorder the columns in the chart according to the heighs values
Hello
I have an apex graphic screen 3D columns, I want to arrange the column according to the tops of values, so if I 7,3,4,9. Then I would have my willing columns 9.7, 4, 3 from right to left.
I hope I made my point clear.
Thank you in advance,
Published by: Najla on February 20, 2013 06:33You can adjust the order of your query for this clause...
  select x,y,z order by z

where z is the column with the numeric value displayed in your chart
Thank you
Tony Miller
Ruckersville, WILL -
Mapping of several columns in the source in 1 target with the source Excel file
Hello
I use to load Excel files in HFM FDM 11.1.2.1.
In Excel, I had 3 columns that need to be mapped in 1 column target using a few rules and mappings. Forest to source file should work in all cases.
For example,.
Source:
A, B AND C
1 company 1 xxx
2 yyy Company2
1 Company3 zzz
mapping for B:
Company 1 C1
C3 Company3
mapping for C:
C2 Company2
target after confirming:
C1
C2
C3
I take data from B or C according to data in A (1 or 2).
I found several ways to do so, but they are not perfect:
1 map columns B and C to the correct value (#C1, C2) and use scripting conditional on a column (for value correctly mapped either column B or C).
The problem here is that I can not break through the low PIF when B and C are mapped to values other than [none]. Can this been bypassed?
2 use DataPump import Scripts for concatenating the sources in one column only and use the tables mapping standart on 1 column.
The problem is that DataPump import Scripts do not work with the source files Excel. Is this correct? I could find a word in the documentation...
3. map columns B and C [None] script well but fat on the column, as:
If (varValues (13) = '1' and varValues (39) = "Company1")) then
Result = "C1".
ElseIf...
Which is horrible, and it would be very difficult to add new mappings in the script. But it works.
4. logical accounts. I can't use it I need to drill down.
Could you recommend me some better way to do this simple task to work?It's a bit that I coded something like that in VBA, so you will need to do a bit of cleanup; However, it should get you well in a way that might work...
Why not add a formula in the excel file, once it is downloaded? (I guess the excel file that is being loaded is not something that you could develop a formula to start?)
on error resume next 'make sure all commands are executed. If something happens in code and file is open, we don't want to leave it open... Set objExcel = CreateObject("Excel.Application") Set objWorkbook = objExcel.Workbooks.Open("") Set objworkSheet = objWorkbook.Sheets(" ") 'OR you could use ordinal objExcel.Application.DisplayAlerts = False objExcel.Application.Visible = false for x = 1 to 100 'I'm just doing a loop for the sake of doing a loop. You might want to loop through rows and for each row that has a 'value in col A, make the formula and then break out of loop so you don't add a metric ton of unnecessary formulas objworksheet.Cells(x, "C").Formula = "=A" & x & " + B" & x 'i.e. =A1+B1 next 'Save the changes objWorkbook.Save 'Close the workbook objWorkbook.Close 'Quit application (important) objworksheet = nothing objworkbook = nothing objExcel.Application.Quit objexcel = nothing NOTE: Microsoft DOES NOT officially support office (i.e. what we do above and what of FDM backstage I guess) seems to work very well, but in most cases, etc.. Be careful about cleaning to ensure that all memory is released and that the instance of excel stops.
-
11g - change number of columns in the chart legend
In 10g, we could define the number of columns in a chart on additional graphical Options legend... Tab legend. 11 g, I can not simply find this option anywhere in the graph properties. Has it been removed in 11g, or am I just blind?Yes this option is over now. Only option is to add the legend display and place accordingly. Hope replied.
-
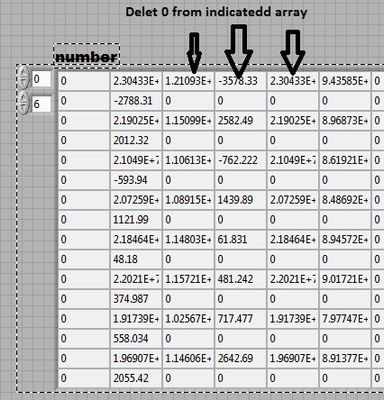
How do delet several columns in the 2D table 0
Dear Sir.
Please tell me how delet 0 multiple column besuace zero of one by a column of delet take too much time. Here, I have attached the program with this message and the main file.
Julian_prince wrote:
Please tell me how delet 0 multiple column besuace zero of one by a column of delet take too much time. Here, I have attached the program with this message and the main file.
How big are your real matrices? How do you measure the speed? How fast is now and how fast should it be?
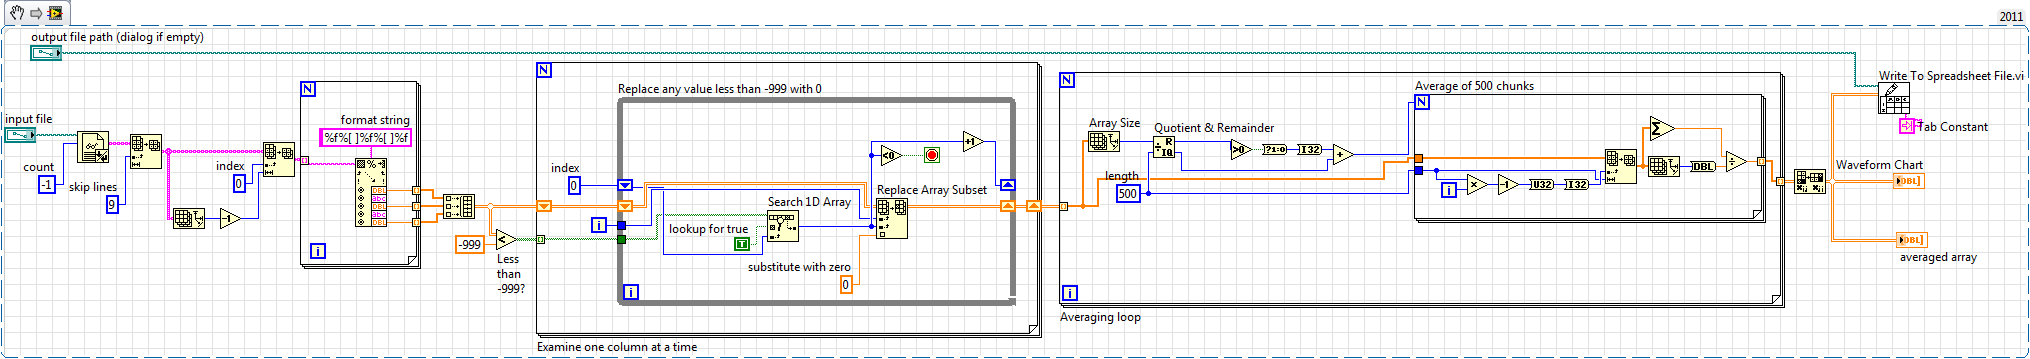
In all cases, you can do it with a single loop, for example as an attachment.
-
I have a text file with numeric data in three columns, (I need to spend the few lines of text in the file above the three columns of values of data first) then I need to convert numeric values above-"999" to zero, then take the average of each value of 500 in the first column (second and third colum requires the same operation separately) , so found average values should be stored in a text file and finally plotted in a graph separately. Help, please. Its part of my project work.
Another version, simply drag and drop:
-
Selection of several columns in the variable of a string
Hi all
Is there a trick how to select the values of all columns in a single variable of type varchar?
Consider that une_table has 5 columns of data type VARCHAR or NUMBER.
DECLARE
vvc_String VARCHAR2 (1000);
BEGIN
SELECT * INTO vvc_String une_table;
END;
/
Thanks for the tips.
Use dynamic SQL statements:
SQL > CREATE TABLE UNE_TABLE
2 AS
3. SELECT *.
4 OF DEPT
5 WHERE ROWNUM = 1
6.Table created.
SQL > DECLARE
2 vvc_String VARCHAR2 (1000);
3 v_stmt varchar2 (10000);
4 BEGIN
v_stmt 5: = Q'[select "]';
6 for v_i to (select column_name from user_tab_columns where table_name = 'Une_table"of order of column_id) loop
7 v_stmt: = v_stmt | ' || ' || V_I.column_name;
8 end of loop;
9 v_stmt: = v_stmt | "to une_table";
10 run immediately v_stmt
11 in vvc_String;
12 dbms_output.put_line (vvc_String);
13 END;
14.
10ACCOUNTINGNEW YORKPL/SQL procedure successfully completed.
SQL >
SY.
-
Any way to export several columns in the links Panel?
This was posted on the InDesign forum, suggested that there could be a script that could achieve this?
Work on a manual with hundreds of illustrations. Each chapter has up to 100. Need to get more than one column of data (file name and # it appears on the page) exported from the links Panel (in a sorted order) so they can be recessed into a spreadsheet. I use TextWrangler which will clear out all the names of files in a folder, but it sorts alphabetically and I really want them sort by Page numbers where they appear.
This script creates a CSV file on the desktop that you can import into Excel. The name of the file is the same as the name of the indesign document active.
Kasyan
var scriptName = "Generate list of links"; if (app.documents.length == 0) ErrorExit("No documents are open. Please open a document and try again."); var page, allGraphics, graphic; var text = "File name;Page\r"; var doc = app.activeDocument; for (var i = 0; i < doc.pages.length; i++) { page = doc.pages[i]; allGraphics = page.allGraphics; for (var k = 0; k < allGraphics.length; k++) { graphic = allGraphics[k]; if (graphic.itemLink != null) { text += graphic.itemLink.name + ";" + page.name +"\r"; } } } WriteToFile(text); //-------------------------------------- FUNCTIONS --------------------------------------------- function WriteToFile(text) { var theFile = new File("~/Desktop/" + GetFileNameOnly(doc.name) + ".csv"); theFile.open("w"); theFile.write(text); theFile.close(); } //-------------------------------------------------------------------------------------------------------------- function ErrorExit(error, icon) { alert(error, scriptName, icon); exit(); } //-------------------------------------------------------------------------------------------------------------- function GetFileNameOnly(myFileName) { var myString = ""; var myResult = myFileName.lastIndexOf("."); if (myResult == -1) { myString = myFileName; } else { myString = myFileName.substr(0, myResult); } return myString; } //-------------------------------------------------------------------------------------------------------------- -
Hi all
I make a program to display the number N of parameters on a single graph.
I managed to do it on my test vi, but when I code the same coding for my true vi, the arrangement of the legend is not expected.
She always jump to the second parameter instead of the first.
However, when I check only one parameter, it displays on the legend.
On my test vi and also my real vi, the coding looks like the file below 1 (.jpg) - exactly the same thing.
2.jpg--> watch my front vi test.
3.jpg--> watch my true vi whose legend is not by expected.
I'm really confuse different results, even if it comes from the same code.
Please notify.
your help is much appreciated.
Thank you.
Kind regards
Roziela
DaveRoziela wrote:
Looking at the program, I only managed run my real.vi if I check the box in order without skipping any checkbox.
If I missed a single checkbox, this error message came up:
Oh sorry, Yes, we have to make a small change like this, of course:

(increments only in the case of true value. The other case is wired through).
-
I can't hide legend column on a chart?
OBIEE 11 g, I would like to hide (not exclude) a legend (or column) in a chart. This is because the graph has a link to another report and I need information to pass on filters in the details of the page when the user clicks on the chart. However, I do not want to show the data on the chart. Is this possible? Thank you.
You can use the columns hidden in a graph. You can't have the hidden column in the chart itself, it must be defined as hidden in the criteria (the column-online hidden properties) tab.
-
massive many update column of the cursor?
I have the problem of finding how to make an update of several columns using the update statement block (if possible). I know how to do it using merge or correleated update, I just want to know how to write using features in bulk by pl/sql. Here's the code for the sample tables:
Now, I want to update original emp table with job, sal, comm emp_tmp table for some empnos. So I write:create table emp_tmp as select empno, job, sal, comm from emp where deptno = 30; update emp_tmp set sal=1000, comm=200, job='CLERK'; commit;
I can't understand the syntax above idea in bulk using statements. Could you give me some advice about this? How it should be written?declare cursor c is ( select e.empno, t.job, t.sal, t.comm from emp e, emp_tmp t where e.empno = t.empno and e.empno > 7700 ); begin -- ... here I would like to use bulk feature for update statement on emp end;
Thank youA sample:
declare cursor csr is ( select t.empno, t.job, t.sal, t.comm from emp_tmp t where t.empno > 7700 ); type t_emp is table of csr%rowtype; t_emp1 t_emp; begin open csr; loop fetch csr bulk collect into t_emp1 limit 100; forall i in 1..t_emp1.count update emp set sal = t_emp1(i).sal where empno = t_emp1(i).empno; exit when csr%notfound; end loop; close csr; end; -
Several guests of the year charts
Hi all
Please recommend the right way to create graphs multiple selection of guests of the year.
I have analysis on PivotTable with the years on columns indicating the amount of sales. He is quick for years so that the user can select several years to obtain the return of multiple columns.
Desired output:
1. graph graphic pie showing sales for many years.
2. If the user selects several years several pie charts should apear separately.
Currently whenever the selection is done over several years, pivot columns indicate separately year but graphics is cumulative and according to the desired result, graphic of each fiscal year must be separated.
How can I achieve this.
Any help will be appreciated with respect.
Kind regards
Waqas
HI - don't know exaxctly what is necessary, but you don't have try using multiple views in the composed layout?
You can remove the year column in the Section box in one of the Pivot. This will give you a different pie charts for different years.
-
Interactive report several series in the same chart?
Hello
I am about to develop a chart report showing multiple series in the same chart
ex
Series1: product A, amounts, dates
Series2: product B, amounts, dates
etc.
It would be good to use IntractiveReports in this case, but is - it possible?
Thanks for the tips & tricks
Cordially GASonHi Gunnar,
It is not actually possible create a multiple series chart using the Actions menu for an interactive report. Only the single series charts can be generated using this option. You need generate a separate table to manage your needs, which you obviously could position itself on the same page as your interactive report. The advantage to generate a separate table means that you can choose from a wide range of types of exposed by the wizards for creating Flash charts. We take to support the generation of 4 types of charts (horizontal bar, column, line, Pie) via the Action of graphics on interactive reports menu, but we support 26 types of graphs (ranging from the Gantt chart 2D column) via Wizards of creation. You may find it useful to take a look at my sample application (http://apex.oracle.com/pls/apex/f?p=36648) and also books AnyChart-online (http://anychart.com/products/anychart/overview/) and the graphics library, for more information on the cards.
I hope this helps.
Kind regards
Hilary -
Send the value of the element to IR flash chart
Hello developers,
I have a way to query.
On a page, I have 2 parts: a flash chart, a single interactive report and a hidden element attached to the chart area. When the user clicks on flash graphic, the IR must have a filter automatically set as IR_COLUMN = VALUE. So I put in action link to go to the same page and fixed in article IR_COLUMN and the value "& P_HIDDEN_ITEM.". Surprise, value is not passed, on the contrary if I use: APP_ID. or another string of standard substitution or #VALUE # #MAX_VALUE # the value or it passes. Note that I don't want to send all the values in the chart. I also try to put a substitution string to properties of the Application and try to pass the value but still does not work. I use APEX 4.0.2.
Thank you.Hi "user11978562"
You mention that you have attempted to reference your item hidden in the field 'Value' in the region of action link. The entry of the names of elements in this area is not supported, and the value of this element will not be retrieved or used in the URL. Depending on the type of graph, a set list of substitution strings are accepted for example #LABEL #, and also the references to the FLOW_ID APP_ID, SESSION, are managed. If you want to reference the element hidden, then you could update your graphic to include the link, similar to the following query:
SELECT 'f?p=&APP_ID.:2:&SESSION.:IR_REPORT_12345678:&DEBUG.:RIR,CIR:IR_JOB:&P2_HIDDEN_JOB_ITEM.' LINK,
       ENAME LABEL,
       SAL VALUE
FROM   EMP
ORDER  BY ENAME
.. where the link includes a reference to page 2, the same page as my graphic and interactive report; demand IR_REPORT_12345678 identify my interactive report; the interactive report for WORK column, IR_JOBfilter; and a reference to my article on hidden page P2_HIDDEN_JOB_ITEM. Just ensure that your hidden item has a value in session state, and then by clicking on an element of your theme astral should define the IR filter. If you do not want to go to the IR filter of the column, instead of referencing an element hidden, then you could do just a graphical query value replace the reference to the element hidden by a column reference, similar to the following:
SELECT 'f?p=&APP_ID.:2:&SESSION.:IR_REPORT_12345678:&DEBUG.:RIR,CIR:IR_JOB:'||JOB' LINK,
       ENAME LABEL,
       SAL VALUE
FROM   EMP
ORDER  BY ENAME
.. where I added a reference to the JOB column in the column of the query LINK.
In response to your comment that you tried to "+ set a string substitution to properties of the Application and try to change the value, but did not always work +", only a defined set of chains of substitution are accepted for graphics, and they are referenced using item-level associated with the 'value' point on the action link region.
I hope this helps.
Kind regards
Hilary
Maybe you are looking for
-
Air 2 can be set to 2 users and open it with the ID of touch by each person?
The Air 2 may be set up for 2 users and each person open the iPad with Touch ID?
-
Audio recording with Satellite L300
I have a USB audio interface I want to use for recording audio with the webcam and other software. I can control the sound via the USB interface, but can not save.In the AR for my key USB is not listed as a webcam feature, so I can't select it, only
-
HP2309m is not sometimes wake up
Hello I recently bought a new HP desktop computer and monitor, specs are- Model No.: HPE - 170 hasProduct #: VT563AA-ABGPCBRAND: Pavilion with a monitor of 2309 m HP. My problem is, sometimes when I swith PC on, the monitor, which is always left on s
-
I have several programs that are not compatible with my 64 bit Windows 7 operating system. I would like to run each different software under another virtual machine of VMWare (5 packs of different software programs and 5 different virtual machines o
-
When I create pools of wwn and Mac for a service profile template, is there a block of addresses that start with a YES that are specific to UCS? In this guide: http://www.ciscosystems.sc/en/US/products/ps10281/products_configuration_example09186a008