Statistics of solitire
On solitire, statistics (to keep track of wins & losses) no longer seems to work. I have Windows vista.
Hi captain47,
Statistics are deleted after each session or are they just incorrect? If they are deleted, try the following steps:
Solitaire to start, go to game > Options and make sure that "always" continue saved game and "Always save game on exit" is disabled.
If it does not help, and the problem you are experiencing started occurring recently, you can use the System Restore tool. Using this tool, you can restore the computer to an earlier point in time. The tool using System Restore may not necessarily help you determine the problem. When you use system restore to restore the computer to a previous state, the programs and updates that you have installed are removed.
To restore the operating system to an earlier point in time, follow these steps:
1. click on Start, type System Restore in the Search box, and then click System Restore in the programs list. If you are prompted for an administrator password or a confirmation, type your password or click continue.
2. in the System Restore dialog box, click choose a different restore point, and then click Next.
3. in the list of restore points, click a restore point created before you started having the problem, and then click Next.
4. click on Finish.
The computer restarts and system files and settings are back to the State they were in when the restore point was created.
Let us know if this solves your problem.
Dave D
Microsoft Answers Support Engineer
Visit our Microsoft answers feedback Forum and let us know what you think.
Tags: Windows
Similar Questions
-
All of a sudden, I can't print an information page - the statistics of my site.
I have a personal Web page hosted by IPage - lynnesgenealogy.com. I get monthly statistics of visitor on this page. For the last two months, I got a terribly large number of hits (over 20,000) on my site of Asia (more trace of China and the Japan IP addresses, but not all). During the outbreak of this issue with IPage I discovered I can print is more statistics page, as I have in the past. I deleted all cookies, cache, history, etc., etc. In Explorer, I can only print one page (the report is several pages long) at a time - but in Firefox I get a blank page. What's the story?
"This frame" doesn't appear in the menu when the page you are clicking on a framed page. So you won't see it most of the time.
There are two types of framed pages:
- Traditional: The server sends a frameset page instructing the browser to load individual pages in different parts of the frameset do to the top of the entire page. AWStatus uses a traditional set of frames.
- Online: the page contains a rectangular area which incorporates a completely different page. When you see a YouTube video embedded in a different site, it's usually by an inline frame or 'iframe '.
-
HP 10BII + statistics PN questions?
After getting weird with the HP 10BII PN + statistics (unexpected) results, I dug out some old books with sample data and checked I get different results on the 10BII + on other machines.
Examples of data of HP - 34 c Manual (p. 38):
x / y: 696/1945, 994/1950, 1330/1955, 1512, 1960, 1965-1750, 2162/1970, 2243/1971, 2382/1972, 2482/1973.
I enter all 9 data and even on the 10BII +, I check the linear regression and then use:
RS-5, RS - K (Swap) to get the slope, m - HP 10BII + returns 0.01612 [should be 61.1612]
RS-6, RS - K (Swap) to get the y originally b - HP 10BII + return 1934.1695 [should be-118, 290.6295]
Maybe I'm missing something basic, but the 10BII + gives the answers that appear all just bad. I checked the "should be" translated on a HP - 34 c, WP 34s and HP - 15 c and they agree.
I read (and reread) the 10BII User Guide + to ensure the correct keystrokes, and also made C.ALL to ensure no conflict of memory (e.g. too many CFlows, etc.). Curiously, linear estimates appear to be OK when I interpolate w/samples.
What happens to Tim?
but here's an interesting result...
If the order of the columns is changed (x and y values are reversed)...
X Y
[[1945 696.]
[1950 994.]
[1955 1330.]
[1960 1512.]
[1750 1965.]
[2162 1970.]
[1971 2243.]
[1972 2382.]
[1973 2482.]]Now run a linear regression model... and the result is...
'(-118242.173643) +(61.1364341085*X)'
the issue seems to be the way in which data is entered into the calculator...
-
HG 48GX Calculator: transfer of programs from a using Terminal Server hp48GX calculator statistics
I'm transferring programs from statistics to my Calculator an old computer with Windows Xp hp 48GX using Kermit emulation software. I see that the calculator seeks to receive, but I can't understand how you select the files that I want to transfer from the computer to the calculator. Anyone who is familiar with Kermit is and can scroll me through how to get transferred to the calculator software pro stats. Any help would be greatly appreciated.
Thank you
Math-A-Noid
Hi!, Math-a-noid:
Please indicate what is this, the library of statistics you need transfer to HP48GX, to indicate the step to download and stay permanently, in memory.
-
Tecra A5 supports the applications of GIS and mathematics/statistics?
one last thing, Tecra A5 can support GIS applications and mathematics/statistics?
Hello
I put t know why the GIS and statistical math should t working on Tecra unit.
The unit has a particular characteristic or a sets of equipment to run this application?
The Tecra A5 is a very nice laptop. You can upgrade the memory for max 2048 MB.
It was also delivered with different graphics cards and different processors. -
How to view the monthly/annual statistics in terms of time past/calories burned, broken down by each individual activity such as run elliptical/outside etc. Y at - it a third party application that can help me to collect and display these data?
Hello
It is not currently possible to review the data the application integrated in activity or training on this basis. If you want Apple to consider adding this feature, you can suggest here:
https://www.Apple.com/feedback/watch.html
However, health and fitness data from other sources, iPhone, and Apple Watch are registered and grouped within the health on iPhone app. These data can be exported, which you may find useful to track the cumulative progress and/or analyze your activity more in detail.
IPhone app activity also has a button for sharing (top right of the screen) that allows to share data - including social media, Messages, Mail, Notes, and a printer.
Include third-party applications that can be useful, for example:
Access to QS
-"Access your HealthKit data in a table so you can Explorer using numbers, Excel, R, or any other tool compatible CSV."
- https://itunes.apple.com/gb/app/qs-access/id920297614?mt=8
SpectaRun workouts
-"View from the workouts of your Apple Watch on your iPhone and to export these workouts so you can download them to your favorite online running community."
- https://itunes.apple.com/gb/app/spectarun-workouts/id991723862?mt=8
Data can also be exported directly from the application of the health (Health Data > All - Share at the top button on the right).
Check the descriptions and support resources for third party applications for supported details of import and data analysis features.
More information:
Use the activity on your Apple Watch - Apple Support
-
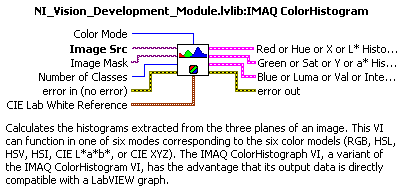
Statistics of the 32-bit image RGB
Hi friends, I am trying to get an image RGB information. I created a VI in labview to aid vision for this wizard.
But the problem is that, although it attracts the histogram for all three colors, it displays 'statistics '.
(i.e. max min value, standard deviation etc.) for the color red and blue, and green also.
What should I do in order to get statistics for all three colors.
Best wishes
Automator
Hello
You just drag an express VI, created from Wizard of vision or have you created the VI yourself in the range of vision?
I suggest to do the latter and use this function:
If you have problems, doing so after the VI is came with, it will be easier for people to help you

Hope this helps
-
min/max with outputs ttl statistics
This is a weird problem. I have attached the worksheet because it is difficult to explain the problem. First of all, let me explain what this thing is supposed to do. A generator of signals outputs sine 5Vp - p, in addition to four. After being added, I use a module of statistics to determine the Min/Max. All I need is the maximum, the minimum is ignored (I'm only looking to the + pics). The + peaks are evaluated to identify uniquely to the final output, which sinewave (s) have been entered in the worksheet. Since I finally need 16 - bit I had to add a scalar unit (scale module) to create the entry 16 (max 15 son allowed an output) by expanding the 15th input to two outputs. I see the expected level of TTL is issued by the module of statistics on three modules Y/t diagram. This tells me that things seem a little work at the exit of the module of SEO (the values of hysteresis in the stat module need to be tweaked to produce all the unique values (16), but it works at least. The problem is that the module of bitmask (set to combine tips - 16-bit conversion for a wide release) generates no output regardless of sinewave different combinations of entry. I thought that I have had set a good example of C.J. provided. I hooked of DMM to also monitor the inputs to the module of bitmask (called 16-bit encoder) - I can't get the digital multimeter to display the output of the module of the stat, but the modules Y/t show the output TTL values there. Both show the modules expected to show which is output, but don't--that intrigues me. The frequency of the sine wave is set to 1,2,4 & 8 Hz for debugging, so I know it is not too fast for the DMM display - I proved this by connecting the sum as an input for the senior DMM sinewave and it displays the voltage changes without problem.
Thus, the two questions are: 1) why the DMM is not working at the release of the Y/t modules or Module Min/Max of Stat? (2) why the bitmask Module cannot evaluate its entries? The added sine wave is continuous and constant phase.
Any help would be appreciated. This has really baffled me, trying to debug.
It dawned on me that the DMM is placed where they will not work because they are supposed to show a too short period of tension. They would appear between 5V and 25V depending on the number of 5V wfm summary, but each TTL output, they try to show are nothing more than the duration milliseconds--not a good application for a DMM. Now, it's just a question of what is the problem with the 16-bit conversion package around!
Any suggestions on the problem?
-
Statistics express vi with a table input
I try to get statistics for a table of elements, with statistics express vi. I used the waveform of the construction, in order to connect the table as input for the express vi, but this only uses the last value of the array instead of the sum of all the values in the table.
I use simple data to do the math, I know the before value of the hand.
I use the values 2 and 4 and I try to get the average, but I get a wrong value.
Can someone please?
Thanks in advance.
-
Analysis.Math.Statistics fails when NaN values are included in the entry tables
Hi all..
With the help of Measurement Studio to Version 8.9 of .net. We need calculate statistics on a table that contains a double. NaN values. When I do this I get NaN as the result of any of the statistical methods (average, STDS etc.) ... Interestingly, the Math.ArrayOperations methods look like they work. Any ideas?
Thank you
gdssoftware
Hi GDSSoftware,
You see this behavior because the statistical functions with Measurement Studio ignore not input values NaN - that is why, they will return results NaN. To work around this problem, you will need to filter these NaN values out of your input array before performing statistical analysis on this subject.
If you're working with .NET 3.5 and later versions, you can do this by using the following:
Double [] vals = new double [] {0d, 6 d, 10 d, 4 d, double. NaN};
Double [] nanless_vals = vals. Where (d =>! double.) IsNaN (d)). ToArray();If you use an earlier version of the .NET framework, you will need to perform a loop on the table with the following (or something similar):
Double [] vals = new double [] {0d, 6 d, 10 d, 4 d, double. NaN};
Listnanless_list As new List ();
for (int i = 0; i)< vals.length;="">
If (! double.) IsNaN (vals [i]))
nanless_list. Add (Vals [i]);
Double [] nanless_vals is nanless_list. ToArray();I hope this helps!
Kind regards
Stephanie R.
National Instruments
-
Hi all
I have a problem with statistics and, respectively, histogram generation of a data set
Below you can see how looks like my data channels.
DIAdem notice I have->
Name | CH1 Dev1. CH2 Dev1. Ch3 Dev1. CH1 Dev2. CH2 Dev2. Ch3 Dev2. CH1 Dev3 | CH2 Dev3 | Dev3 CH3 |
Number | 1. 2 |3 |4 |5 |6 |7 |8 |9 |
Length | 3. 3 |3 |3 |3 |3 |3 |3 |3 |
Unit | V | V | V | V | V | V | V | V | V |
Content channels
1 | 1.52 | 1.51 | 1.53 | 1.52 | 1.55 | 1.51 | 1.50 | 1.53 | 1.55 |
2 | 1.62 | 1.61 | 1.63 | 1.62 | 1.65 | 1.60 | 1.62 | 1.67. 1.65 |
3 | 1.52 | 1.51 | 1.53 | 1.52 | 1.55 | 1.51 | 1.50 | 1.53 | 1.55 |
What I need is to create a histogram for a given line-> in this case number 2
It is this right before or should I make a few adjustments before that?
I hope my question is clear and easy to follow.
Thanks in advance to anyone who can offer you a working solution.
Hello
You can do this in a scipt.
Erase the dataportal, load the file attached .tdm and run the following script:
I have Sun
Dial the ChnAlloc ("Result", 3, 1, DataTypeFloat64, "Numeric")
for i = 1 to 3
CHD (i, "result") = CHD(1,i)
NextThen all the unique values of the 3 channels will be copied to the result string.
-
Where are the statistics of Solitaire?
I want to restore the backup game statistics in my regular Solitaire game in Windows Vista. What files are they in and where is the file? Thank you
Celestial,.
The files that contain the statistics are:
C:\Users\(User Name) \AppData\Local\Microsoft Games\Solitaire(or spider, chess, etc..)
You can copy the files from this location in the same place on the newly installed machine. All your stats will be with you. Mike - Engineer Support Microsoft Answers
Visit our Microsoft answers feedback Forum and let us know what you think. -
I have 200 + channels to settle permanently, at a rate of 10 Hz.
The client requires an AVERAGE value of each channel, between a START time and a STOP time, perhaps several minutes apart.
What I do is put a COUNT to 0 and clear a buffer [] SUM of 200-chan at the START time.
For each sample, if the average is now underway, I add the [current] sample to buffer [] SUM and increment the counter.
Some time after the STOP time, the average is required.
If I take the MONEY [] divide by N, and it is the average of 200 channels.
The only memory required is 200 channels, regardless of duration. I have to keep the sample of breads.
Which works very well.
The customer now wants to add MIN, MAX, StdDev, and Variance to the list of the necessary statistics.
MIN and MAX are easy: I just compared each [example] MAX [] matrices and an existing MIN [] and keep the young and old.
But the definition of the variance is SUM (Xi - mean) ^ 2 / N. (StdDev is the square root of that).
That does not mean that I have all only one sample in hand when it's time to calculate it?
I can't treat starters - medium until I know what the AVERAGE, but I don't know that until the end...
A way to avoid storing each unique sample?
Here is another algorithm for the mean and the variance that does not retain the history of any sample. This is the algorithm of Knuth (from Welford) of https://en.wikipedia.org/wiki/Algorithms_for_calculating_variance.
-Jim
-
I need to know if I can do something to get properly applied statistics, including the free cells.
[Moved from the community centre of Participation]
Hello
Try this app troubleshooting
http://Windows.Microsoft.com/en-us/Windows-8/what-troubleshoot-problems-app
-
How to remove permanently print "summary statistics"?
Streets and trips 2013.
Whenever I want to print a new card, I need to go to "other options" and uncheck "include the summary statistics. How can I permanently remove this option. Summary statistics are not necessary.
Hello
It is not a community forum for streets & trips. Try...
Streets & Forum travel:
http://social.Microsoft.com/forums/en-us/home?Forum=streetsandtripsStreets & trips support & training:
http://www.Microsoft.com/streets/en-us/support-and-training.aspxSupport for MapPoint, streets & trips and Highway:
http://support.Microsoft.com/ph/851Don
Maybe you are looking for
-
My computer does not show the above, when I go to Internet Explorer browser
-
When I connect now on youtube thumbnails flash on then disappear leaving a white square with long and empty thin rectangle on the left hand of the square side. I can still access the videos. It is a recent and very irritating problem. Can anyone help
-
Hey everyone I need help. After starting my computer about a week ago, I noticed that the icon of the internet has shown that I was not logged. so I open internet explore and nothing happened. only a few applications are actually start and working as
-
Hello I'm porting an application that needs to use a build-in photo gallery application to allow the user to select an image. As I see there is currently no such application on device Dev Alpha. So my question would be, how can I implement this featu
-
Construction of a system of upgrade discs
The hard drive on my system is broken and I am trying to rebuild the system from scratch with a new hard drive. My original system was with Vista OEM (with no disk Vista) and then I bought a Windows 7 upgrade disk. I'm trying to put Windows 7 on the