[8i] how to calculate a moving average?
I am trying to calculate a moving average over a specific period of time, but I can't quite figure out how to do this. For this particular problem, I am also stuck on a 8i database.Some examples of data for the problem:
CREATE TABLE     my_data
(     order_no     CHAR(10)
,     seq_nbr          CHAR(4)
,     area_id          CHAR(4)
,     start_date     DATE
,     unit_time     NUMBER(7,2)
);

INSERT INTO my_data VALUES ('0000567890','0010','A001',TO_DATE('05/01/2000','mm/dd/yyyy'),0.34);
INSERT INTO my_data VALUES ('0000567890','0020','A001',TO_DATE('05/02/2000','mm/dd/yyyy'),0.78);
INSERT INTO my_data VALUES ('0000567890','0030','A002',TO_DATE('05/03/2000','mm/dd/yyyy'),0.91);
INSERT INTO my_data VALUES ('0000567890','0040','A003',TO_DATE('05/03/2000','mm/dd/yyyy'),0.27);
INSERT INTO my_data VALUES ('0000123456','0010','A001',TO_DATE('04/01/2001','mm/dd/yyyy'),0.39);
INSERT INTO my_data VALUES ('0000123456','0020','A001',TO_DATE('04/02/2001','mm/dd/yyyy'),0.98);
INSERT INTO my_data VALUES ('0000123456','0030','A002',TO_DATE('04/03/2001','mm/dd/yyyy'),0.77);
INSERT INTO my_data VALUES ('0000123456','0040','A003',TO_DATE('04/03/2001','mm/dd/yyyy'),0.28);
INSERT INTO my_data VALUES ('0000123123','0010','A001',TO_DATE('12/01/2001','mm/dd/yyyy'),0.31);
INSERT INTO my_data VALUES ('0000123123','0020','A001',TO_DATE('12/02/2001','mm/dd/yyyy'),0.86);
INSERT INTO my_data VALUES ('0000123123','0030','A002',TO_DATE('12/03/2001','mm/dd/yyyy'),0.82);
INSERT INTO my_data VALUES ('0000123123','0040','A003',TO_DATE('12/03/2001','mm/dd/yyyy'),0.23);
INSERT INTO my_data VALUES ('0000111111','0010','A001',TO_DATE('06/01/2002','mm/dd/yyyy'),0.29);
INSERT INTO my_data VALUES ('0000111111','0020','A001',TO_DATE('06/02/2002','mm/dd/yyyy'),0.84);
INSERT INTO my_data VALUES ('0000111111','0030','A002',TO_DATE('06/03/2002','mm/dd/yyyy'),0.78);
INSERT INTO my_data VALUES ('0000111111','0040','A003',TO_DATE('06/03/2002','mm/dd/yyyy'),0.26);
INSERT INTO my_data VALUES ('0000654321','0010','A001',TO_DATE('05/01/2003','mm/dd/yyyy'),0.28);
INSERT INTO my_data VALUES ('0000654321','0020','A001',TO_DATE('05/02/2003','mm/dd/yyyy'),0.88);
INSERT INTO my_data VALUES ('0000654321','0030','A002',TO_DATE('05/03/2003','mm/dd/yyyy'),0.75);
INSERT INTO my_data VALUES ('0000654321','0040','A003',TO_DATE('05/03/2003','mm/dd/yyyy'),0.25);Here is where I am now in the problem. For example, suppose I want to calculate a moving average over 2 years (average for the 2 years preceding the date of the current row). For my actual data, I probably want to be able to change the period of time (at different times in several queries) on which the moving average is calculated.
I thought that using the analytical function AVERAGE with a window clause might be the way to go, but I don't know exactly how to use the window clause. I can even be completely wrong interpret what is its use, but if all goes well, it should still show what I'm after.
SELECT     area_id
,     AVG(tot_area_unit_hrs)
     OVER     (
          PARTITION BY     area_id
          ORDER BY     min_start
          ROWS          BETWEEN     --2 years prior to min_start of current row
                    AND     CURRENT ROW
          )
,     --something to indicate the time period the average is over     AS time_period
FROM     (
     SELECT     order_no
     ,     area_id
     ,     MIN(start_date)     AS min_start
     ,     SUM(unit_time)     AS tot_area_unit_hrs
     FROM     my_data
     GROUP BY     order_no
     ,          area_id
     )
ORDER BY     area_id
, time_periodI want to see results like something along those lines... I really don't like how the time period is identified, as long as I can pay by him in chronological order, and he tells me what period of time it covers. The way I show with period_start and period_end in the results of the sample below is just a way that I thought to do this.
area_id   period_start period_end   avg_unit_time
----------------------------------------------------
A001      4/30/1998    5/1/2000     1.120
A001      3/31/1999    4/1/2001     1.245
A001      11/30/1999   12/1/2001    1.220
A001      5/31/2000    6/1/2002     1.223
A001      4/30/2001    5/1/2003     1.153
A002      5/2/1998     5/3/2000     0.910
A002      4/2/1999     4/3/2001     0.840
A002      12/2/1999    12/3/2001    0.833
A002      6/2/2000     6/3/2002     0.790
A002      5/2/2001     5/3/2003     0.783
A003      5/2/1998     5/3/2000     0.270
A003      4/2/1999     4/3/2001     0.275
A003      12/2/1999    12/3/2001    0.260
A003      6/2/2000     6/3/2002     0.257
A003 5/2/2001 5/3/2003 0.247 Hello
You're close enough. You want a window based on the BEACH, no LINES.
LINES BETWEEN... means that you know exactly how many lines will be in the window, and you don't care what range of values that represents.
RANGE BETWEEN... means that you know the exact scope of the ORDER BY value to include in the window, which could mean any number of lines.
When you say "RANGE BETWEEN x BEFORE...". "where the words ORDER BY id of a DATE, x is considered as the number of days. (Which is consistent with the arithmetic DATE Oracle).
Try this:
SELECT     area_id
,     min_start - 730          AS period_start
,     min_start             AS period_end
,     AVG(tot_area_unit_hrs)
     OVER     (
          PARTITION BY     area_id
          ORDER BY     min_start
          RANGE BETWEEN     365 * 2     PRECEDING
                AND     CURRENT ROW
          )               AS avg_unit_time
FROM     (
     SELECT     order_no
     ,     area_id
     ,     MIN(start_date)     AS min_start
     ,     SUM(unit_time)     AS tot_area_unit_hrs
     FROM     my_data
     GROUP BY     order_no
     ,          area_id
     )
ORDER BY     area_id
,          period_end
;
Output of your sample data:
AREA PERIOD_STA PERIOD_END AVG_UNIT_TIME
---- ---------- ---------- -------------
A001 5/2/1998   5/1/2000           1.120
A001 4/2/1999   4/1/2001           1.245
A001 12/2/1999  12/1/2001          1.220
A001 6/1/2000   6/1/2002           1.223
A001 5/1/2001   5/1/2003           1.153
A002 5/4/1998   5/3/2000            .910
A002 4/4/1999   4/3/2001            .840
A002 12/4/1999  12/3/2001           .833
A002 6/3/2000   6/3/2002            .790
A002 5/3/2001   5/3/2003            .783
A003 5/4/1998   5/3/2000            .270
A003 4/4/1999   4/3/2001            .275
A003 12/4/1999  12/3/2001           .260
A003 6/3/2000   6/3/2002            .257
A003 5/3/2001   5/3/2003            .247
The period_starts are not quite what you posted, but, if I understand you correctly, you don't mind that.
There should be no problem of partitioning an additional column.
Tags: Database
Similar Questions
-
How to calculate daily, hourly average for the very large data set?
Some_Timestamp
"Parameter1" Parameter2 1 JANUARY 2015 02:00. 00:000000 AM - 07:00 2341.4534 676341.4534 1 JANUARY 2015 02:00. 01:000000 AM - 07:00 2341.4533 676341.3 1 JANUARY 2015 03:04. 01:000000 PM - 07:00 5332.3533 676341.53 1 JANUARY 2015 03:00. 01:000046 PM - 07:00 23.34 36434.4345 JANUARY 2, 2015 05:06.01:000236 AM - 07:00 352.33 43543.4353 JANUARY 2, 2015 09:00. 01:000026 AM - 07:00 234.45 3453.54 3 FEBRUARY 2015 10:00. 01:000026 PM - 07:00 3423.353 4634.45 FEBRUARY 4, 2015 11:08. 01:000026 AM - 07:00 324.35325 34534.53 We have data as above a table and we want to calculate all the days, the hourly average for large data set (almost 100 million). Is it possible to use the sql functions of analysis for better performance instead of the ordinary average and group of? Or any other way better performance?
Don't know if that works better, but instead of using to_char, you could use trunc. Try something like this:
select
    trunc(some_timestamp,'DD'),
    avg(parameter1)
from
   bigtable
where
   some_timestamp between systimestamp-180 and systimestamp
group by
   trunc(some_timestamp,'DD');
Hope that helps,
dhalek
-
How to calculate the accuracy average?
I was just wondering how is calculated the mean accuracy? What is the difference between that and the overall accuracy? In the performance section
Published by: 939265 on June 7, 2012 07:51Hello
Here are a few definitions provided by the Data Miner online help for the Classification actions. It is has more details in the online help for the elevator, roc, predictive confidence etc.
By default, ODMr, will try to optimize the accuracy. This ensures that less frequent target class values are not ignored in favour of the value of class optimization more frΘquent. You can change this default behavior by adjusting the parameters on the performance of the model tab.
Thank you, MarkAverage precision
Accuracy is the percentage of correct predictions made by the model in comparison to the actual classifications in the test data
The accuracy of the average per class reaches a given threshold of probability is greater than the accuracy obtained in all other possible thresholds.Overall accuracy
Accuracy is the percentage of correct predictions made by the model in comparison to the actual classifications in the test data
The simple precision of the model. -
How to calculate an average mobile signals individual N?
Hello world
My problem is as follows:
With all the samples that I get a table of 64 signals and I would build the moving average of each of these 64 signals.
However, it is very poor to place 64 reentrant mobile medium screws in parallel to it (as shown in the attachment).
That's why I wonder if there isn't a better way to do it?
Each hint is appreciated
Benjamin
Hi Benjamin,
What is "Mobile means" VI: change to accept a table.
In VI it is probably a ringbuffer using a 1 d table to maintain data. Change this into a 2D array to contain values of 64 signals...
-
FPGA - windowed moving average, variance, standard deviation, kurtosis and asymmetry
Hello!
I'm processing in FPGA and I want to calculate the MOVING WINDOW average, variance, standard deviation, kurtosis, asymmetry online for the last N (N is the size of windows) elements. The frequency is about 100 kHz and N about 10000 (100 ms of signal).
I found something like EMA (moving average exponential)...
Have someone solved something like that? Any ideas how to fix?
That looks like a problem. What type of window you need? The moving average exponential isn't an option? There are online algorithms described in Wikipedia, but they can suffer from problems of numerical accuracy when it is implemented in a fixed point (depending on the nature of the data). They would be interesting watch in, however.
Other than that, here are some options that I can think of:
- More large FPGA
- Be part of the treatment on the RT controller - have - you looked into that?
- Return to your needs and push some of the numbers. Do you really need 100 ms in all cases, etc.?
- Depending on the nature of the data, simple compression techniques may be an option
- An precision analysis to determine the data type minimum, that you really need. For example, getting to 25 bits, would have a huge impact on your cost of multiplier.
- Consider the mathematics of floating (using Xilinx IP cores) point to online methods. Your flow is relatively low, so you could share it resources between all channels. Manage States of different channels is complicated but is doable.
The BRAM will be used for FIFO buffers, but is also available for general use to implement the fifo and memories. Some IP use BRAM under the hood, keep an eye on the compilation summaries to monitor how much still you have.
-
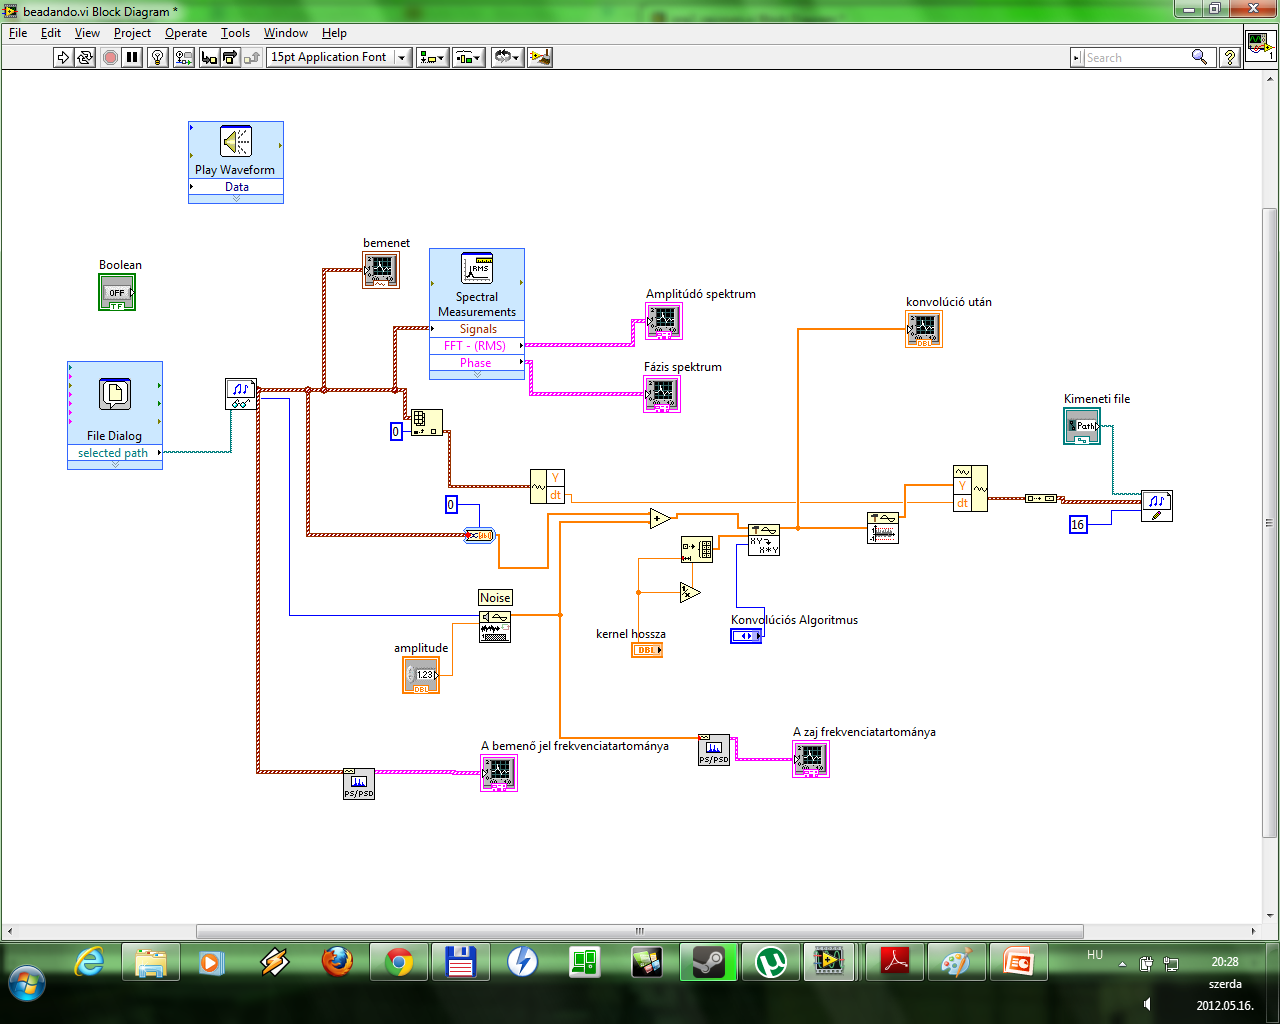
Hello. I want to do a mobile medium filter for my VI. I did a basic FIR filter... but I have not a clue how to make a filter means mobile.
+ I want a button to play the input wav file... How can I do this?This is the vi:
My tip for a moving average is to use the FIR filter with specific coefficients.
Regarding your wav file playback, discover the graphics and the sound palette. I have little experience with them, but I know that there is a screw there to read your wav file.
-
exponential response moving average stage fpga
Hey guys,.
I have a problem with my filter, the exponential weighted moving average filter (IIR 1 st order.). Excerpt from the book: understand the digital signal processing (Richard Lyons) I have the following formula, calculate the frequency of 3dB (CF) of alpha. Alpha is the parameter to control the filter.
Differential equation of the filter: y [n] = x [n] * alpha + (1 - alpha) * y [n-1]
Relationship between CF and alpha: alpha = cos(2fc/fs) - 1 + sqrt [cos²(2fc/fs) - 4 * cos(2fc/fs) + 3]
If I now choose a frequency of 3 dB from 0, 0794Hz (time constant (TC) = 2 s) alpha = 0,00169621. (fs = 94)
For a filter command 1st IIR, the rise time (your) of the stepresponse (from 10% to 90%) is: ta = 2, 2 * TC which translates your = 4, 4S.
But if I simulate the step response, my rise time is about 3 times this value at 14.
I can't explain why the response of my filter is so much different. For my Moving Average filter, the calculated and simulated rise time are equal.
I have the vi that is performed on the attached FPGA. Maybe someone can find a mistake...
Greetz
Slev1n
Hey ZX81.
Thank you very much for your detailed answer.
Regarding the issue with the rise time, I think I've found the error. You might be right, that the formula is not correct, or which is most probably misunderstood by me and put in the wrong context.
When I was cycling home from work I remembered a practical function of labview: 'coefficients.vi filter smoothing' here you only need to define tau/TC and fs and it calculates the numerator and the denominator for the moving average exponential and the moving average. Offering it is alpha I could compare the result of the formula I've used and there was a big difference. LabVIEW uses the following formula: alpha = 1 - exp (-1 /(fs*TC)). With this formula, TC = 2 s is equal to alpha = 0, 0053.
And with this alpha my simulation works! Risetime 4.4 s

Quote you: "in general, at this stage, I have maturities adjust alpha until my results matching what I wanted and move." I would like to do the same thing, but as it's my thesis I have to solve such things
Now, back to the rounded questions. I understand that the small values are a more serious problem. This filter is used in a Lock In, the values are going to be REALLY small. But I've already tested on our measuring device and it works, to that effect, I'll test your version as well, but if I get no problems, I guess I keep to the 40bits. Simulating the following configuration, caused an error of 2.3%. 57 bits using reduced the error less than 1%. I think that 40bits should be sufficient.
Alpha = 0, 000335693 entry = 1, 19209E-7 And regarding resources, I have no worries. Although using a myrio ultimately I still have a lot of DSP Slices for the multiplication and 10% in flip flops.
So I guess that this matter is resolved. Thanks for your great help and interesting reflections.
Kind regards
Slev1n
-
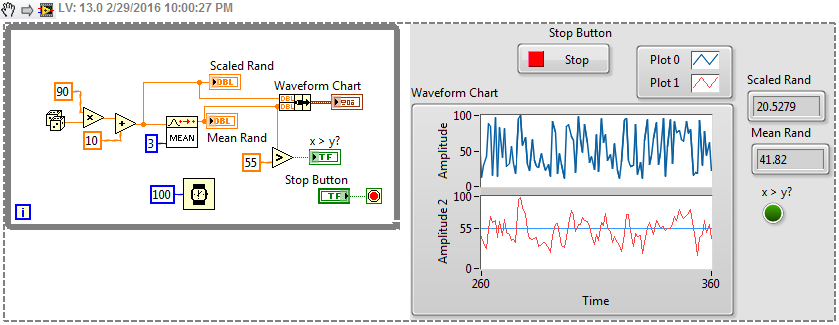
the moving average of 3 random numbers
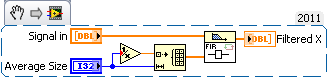
This is my first time using LabVIEW and I need help.
- I have to design VI which generates the random number from 10 to 100
- VI shows the last generated number and the moving average of the last 3 generated number on a waveform graph
- If the average of the last 3 numbers obtained is greater than 55, to turn on the LED.
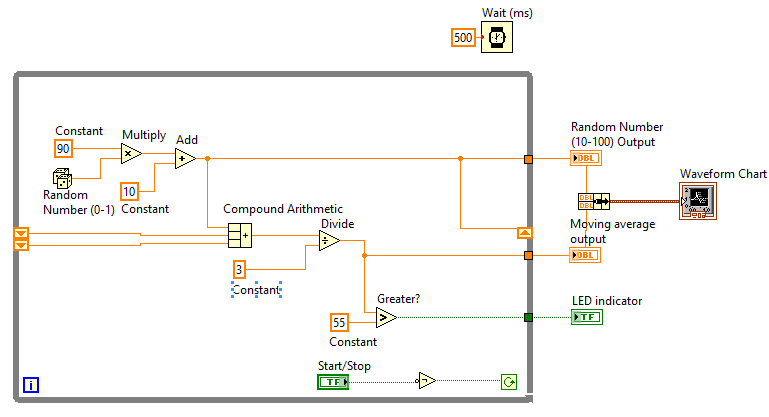
I did the whole VI but I have the problem with the first two loops. In the first loop, the moving average should show the random number itself (((random number) 1 + 0 + 0) / 1). In the second loop (((random number 1) + (random number) 2 + 0) / 2) and after that my VI works correctly. The moving average shows the other values in the first two loops (random number e.g. 17.54, average 29.28). Probably I have to change something in the shift registers, but I'm not sure how to do it. I need help to fix my VI for the first two loops. Thank you in advance.
easy
No explin he for grade
Of course there are other ways
-
How to calculate the CPU Ready on Cluster DRS via Powercli?
Hi all!
I have a DRS Vsphere cluster. I want to know what is the value of the loan of CPU I have in my group.
For example, I get 20% of powercli value, it is normal for the cluster, but if I have 100% or more, I have a problem.
How to achieve via Powercli? And how to calculate the percentage values correctly?
I know, I can get all values of CPU Ready of VMs cluster, but IT is not the same thing, I need overall value of CPU Ready.
Thanks in advance!
As far as I know you can get the cpu.ready.summation for ESXi nodes or VMs.
For a cluster, you will need to get the value of each node in the cluster ESXi and then take the average.
The metric cpu.radey.summation is expressed in milliseconds.
To get a percentage, you need to calculate the percentage of loan period during the interval during which it was measured.
Something like this (this will give the loan current %)
$clusterName = "mycluster.
$stat = "cpu.ready.summation".
$esx = get-Cluster-name $clusterName | Get-VMHost
$stats = get-Stat-entity $esx - Stat $stat - Realtime - MaxSamples 1 - forum «»
$readyAvg = $stats | Measure-object-property - average value. Select - ExpandProperty average
$readyPerc = $readyAvg / ($stats [0].) IntervalSecs * 1000)
Write-Output "Cluster $($clusterName) - CPU % loan $(' {0:p}'-f $readyPerc).
-
How to calculate the 99th percentile of a stream of number...
Environment:
Oracle 11.2.0.3 EE on Solaris 10.5
I have a stream of numbers (for example 1000), I need to calculate the 99th percentile of the distribution of this stream in such a way that when a new ' number is introduced, I can tell if the new number is above the 99th percentile of the distribution of my workflow.
I don't have a good idea of the nature of the distribution if it's important.
I am NOT, I repeat NOT a statistician! :-)
I read the docs on the different functions available, ntile, percent_rank, percentile_cont, percentile_disc, etc. I also read a lot of articles referenced via Google.
The examples are not exactly what I'm trying and I was unable to get the result I need by trial and error (mostly!).
All suggestions are welcome!
If you need additional information, I will try to provide what I know.
-garyHi, Gary.
garywicke wrote:
Hi FrankWell to try to facilitate the description of periods, I managed to confuse the issue a little more.
Sorry about that.
I need to use days not months. The script will be executed every day and watch period of ago 210 days to 31 days following there from 30 days at present.
With respect to the expected result, I need somehow calculate what turnover represents the 99th percentile (or 90th everything that works in the example) and store that in my table of this customer.
Then after a CREATE TABLE statement for this table and you want that it contains, given the data published in the sales table, after it is filled.
Another process on the whole will consider the last average of 30 days and determine if this average exceeds sales 99th percentile figure and initiate an action (alert email, etc.) if it is.
My problem is that I don't know how to calculate this 99th percentile number.
After the sample data, I'm guessing it should be close to the number of SD 3, but after reading your comments, maybe that's not correct.
That's my guess. Sometimes deviations corresponding to percentiles, sometimes they did not. People choose one or the other, depending on what amounts to their data, and what they want to show on these data. Your client has apparently chosen percentile. Unfortunately, we do not seem to know something about the problem.
Before you can solve this problem for your customer, you must understand what the problem is. Talk to your client and know exactly what is wanted here.Here is one possible approach.
WITH     got_month_avg     AS
(
     SELECT       custno
     ,       AVG (amount)     AS month_avg
     FROM       sales
     WHERE       tran_dt     >  SYSDATE - 30
     AND       tran_dt     <= SYSDATE
     GROUP BY  custno
)
,     got_threshold_amount     AS
(
     SELECT DISTINCT
          custno
     ,     PERCENTILE_CONT (.4)          -- or .99
              WITHIN GROUP (ORDER BY  amount)
                        OVER ( PARTITION BY  custno )          AS threshold_amount
     FROM    sales
     WHERE     tran_dt     >  SYSDATE - 210
     AND     tran_dt <= SYSDATE -  30
)
SELECT       a.custno
,       a.month_avg
,       t.threshold_amount
FROM       got_month_avg          a
JOIN       got_threshold_amount  t  ON  t.custno  = a.custno
--WHERE       a.month_avg     >= threshold_amount
ORDER BY  custno
;
Output:
`   CUSTNO  MONTH_AVG THRESHOLD_AMOUNT
---------- ---------- ----------------
         5      126.5           4812.6
        26 4602.44444           3102.2
I set the WHERE clause comment, just so that we could see the results of each custno. I also put the extremely low threshold (40th percentile) just for a custono would be selected if you are not using the WHERE clause.
Subqueries are average in the last 30 days and the 40th percentile for 180 days before that. Let's take a look at custno = 5. There were two rows in the last 30 days (225 and 28 amounts), then the average in the last month is (225 + 28) / 2 = 253 / 2 = 126,5.
Within 180 days prior to that, he had 7 amounts, in ascending order:
1st (0th percentile): 647
2nd (17th percentile): 1869
3rd (33rd percentile): 3065
4th (50th percentile): 7434
5th (67th percentile): 8435
6th (83rd percentile): 9393
7th (100th percentile): 9712
Since (for now), we are interested in the 40th percentile. It will be more than number 3065 (33rd percentile) and less than 7434 (50th percentile), 3065 to 7434, somewhat 40% being somewhat closer than 33% to 50%. This number turns out to be 4812.6. -
How to calculate the total memory used by oracle under Linux?
Hi all
In one of my server have 148 GB of total physical memory and 12 databases are running. For capacity planning, I need to know how the Oracle server use.
How to calculate the use oracle database? I was perplexed because Yop out his show off 148 gb 128 GB are used.
Below for your reference:
++++++++++++++++++++
== > back to top
top - 09:52:32 up to 151 days, 15:20, 3 users, load average: 6.11, 6.00 6.05
Tasks: 7 running, 1314, 1321 total sleep, stopped 0, 0 zombie
CPU: 37.8%us, 1.4%sy, 0.0%ni, 55.0%id, 5.6%wa, 0.1%hi, 0.2%si, 0.0%st
MEM: 148290444 k total, 129368792 k used, 18921652 k free, 1450292 k buffers
Swap: 50331632 k total, 1296188 k used, 49035444 k free, 114733336 k cached
The memory allocated to each instance is: sga total == > 34 pga = > 48 GB gb
+++++++++++++++++++++++++++++
SGA PGA
4 GB 4 gb
4 GB 4 gb
2 GB, 4 GB
2 GB, 4 GB
2 GB, 4 GB
2 GB, 4 GB
2 GB, 4 GB
3 gb 4 gb
3 gb 4 gb
4 GB 4 gb
3 gb 4 gb
3 gb 4 gb
Thank youTry this - http://www.pythian.com/news/29703/oracle-instance-memory-usage/ for each of your instances.
As far as I know, different instances may share only the binary code oracle and using libraries, so you should be able to easily understand the amount of memory of all instances of 12.
Lordane Iotzov
http://iiotzov.WordPress.com/ -
Hi all
I am trying to achieve a moving average Calc very simple. Even if my calc is valid, I get an error message after I run my script to calc:
' scalar double argument expected in function [@__SHIFT].
Here's my calc script:
"Measure_1" = (@SUMRANGE ("Measure_2", @CURRMBR ("Period")) +) ".
@SUMRANGE ("Measure_2", @NEXT (@LIST (@CURRMBR ("Period"), "Jan":"Nov"))) / 2;)))
Here is the obligation to calculate the Measure_2:
Jan Feb Mar Apr
Measure_1 10 20 40 100
Measure_2 15 30 70
Under calc worked, but then I really don't want to repeat the same logic 12 times:
Measure_2-> "Jan" = (Measure_1-> "Jan" + Measure_1-> "February") / 2;
Any ideas?
Thank you!
Mehmetyou would be better to use the currmbrrange function. Here is a generic example of the tech reference
@SUMRANGE ('Measure1', @CURRMBRRANGE(Year, LEV, 0,, 0))Note there is also an avgrange instead of the sumrange function in order to get the average over time. There is an additional setting in jump missing and zero members.
-
What is meant by moving average? and hoe do we calculate in essbase.
Read the technical link referance and get back if you had doubts below.
http://download.Oracle.com/docs/CD/E10530_01/doc/EPM.931/html_esb_techref/funcs/movavg.htm
-
HFR 9.3.1
I have a month (defined as the time) dimension and a years. Basically:
Measures
-Net margin
-Revenue
-Cost
Month
-Jan
-Etc.
-Dec
Years
-EF07
-AFA 08
-EXERCISE 09
I am trying to build a State that displays the selected month and moving average 12 months, but have a problem of displacement of the year at the correct place.
BASICE installation would be
A--FY08---FY08---FY08---FY08---FY09---FY09---FY09---FY09---FY09---FY09---currentYear(or user selection) column header
B---Sep---Oct---Nov---Dec---Jan---Feb---Mar---Apr---May---Jun---CurrentMonth(or user selction) column header
Tier 1-recipes
Cost of line 2
I can get 12 months of lag, np, but how to make the second dimension (year) to change when it is Dec?
Jcreate 2 columns (col A and column B)
Col A:
Year: POV sometime this year
Time: Jan of POV for timeCol B:
Year: Member Relative [POV current year - 1]
Time: Member [current time + 1 POV] Relative to decExample:
If you select 2009 and Mar
ColA: Year: 2009 / time: January to March
ColB: Year: 2008 / duration: April to DecemberI think that's what you want.
Kind regards
Rahul -
I'm doing something similar to an average commute, but I want it on average to each 10 data instead of keep moving points. I don't know exactly what it is, part of the reason why I'm a bit confused on what to do. I've seen several functions of moving averages, but still, this isn't what is needed. I have a very large data collection and wanted to get to a whole easier to manage data. The data comes in the form of one and zeroes. No indication in this regard would be appreciated.
Hello
You can see thispost on the forum that addresses similar requirement you have.
Concerning
Maybe you are looking for
-
Toolbar lost and can't find it
HelloI got my tool with a bunch of important sites registered. I cannot locate, but do not know that it is there when I went to bed a few hours ago. But wonder if it's because my foxfire continues to become a message indicating that it is unplugged.
-
For iMac, how to move iMovie and iPhoto files HD Ext, with main full HD?
iMac OS version 10.11.4
-
FN keys do not work on Portege R200
Hello no idea what to do when the * FN keys * do not work? I press FN and want to adjust the brightness or volume or toggle the touchpad, but it simply doesn't. Do I need to install a driver? If some parameters are simply off somewhere? Appreciate an
-
Question regarding upgrading my video card
I have a PC HP Media Center m7674n that I bought in 2006. At the time, I upgraded the system to run with an HD ATI X 1950 Pro Video card (I think that a bigger power supply has been added). I still love the computer; However, I want to upgrade the vi
-
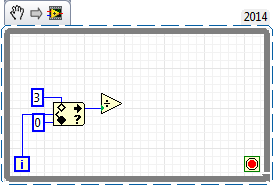
Hello guys,. I'm working on a project that I have to use a lot of While loops since I have a lot of things going on parallel. However, I think it's a little disorganized since my program am too big and it's a little difficult to find specific things.