Cumulative NUMBER
HelloAnyone know how I can reach a cumulative number?
For example, I have the select statement:
Select deptno from scott.emp
20
30
30
40
20
10
what I get is the following:
DEPTNO County
20 1
30 2
30 2
40 3
20 3
4 of 10
I'm playing my mind with analithycal functions, but without result so far.
Have a tip?
Thank you in advance!
Published by: user817006 on January 23, 2009 06:15
user817006 wrote:
No, he should count on all ranks, how many separate departments are to this day. Like this:
Well you shouldn't change your needs when someone is already working on it. ; P
SQL> ed
Wrote file afiedt.buf

  1  select deptno, sum(rn) over (partition by 1 order by empno) cnt
  2  from (
  3    select empno, deptno, decode(row_number() over (partition by deptno order by empno),1,1,0) rn
  4    from emp
  5    )
  6* order by empno
SQL> /

    DEPTNO        CNT
---------- ----------
        20          1
        30          2
        30          2
        20          2
        30          2
        30          2
        10          3
        20          3
        10          3
        30          3
        20          3
        30          3
        20          3
        10          3

14 rows selected.

SQL>
Tags: Database
Similar Questions
-
Hello
I have a question about the analytical functions. What I'm trying to achieve is: calculate the cumulative number of separate.
For example, to 20091001 I need to count the distinct subscribers on this date. I have need to also consider 20091001 to 20091002. 20091003 I must consider 20091001 to 20091002. You got the point.
Below, I have attached the input data and also my goal. I tried some of the windowing functions with no luck.
With 10 gr 2 Enterprise edition
Thank you
Onur
DATA:
daily_calendar_id subsriber_id
20091001 1
20091001 3
4 20091001
20091001 3
4 20091001
5 20091001
20091001 6
20091001 2
4 20091001
20091001 1
20091001 1
20091001 3
20091002 7
20091002 8
20091002 3
20091002 2
20091002-1
20091002 5
20091002 12
10 20091003
12 20091003
4 20091003
6 20091003
4 20091003
3 20091003
4 20091003
17 20091003
16 20091003
20091004 17
20091004 18
20091004 19
20091004 20
20091004-1
20091004 2
20091004 21
EXPECTED RESULT:
daily_calendar_id Cumulative_distinct_subscriber_count
20091001 6
20091002 9
12 20091003
20091004 16
Published by: user6299691 on December 10, 2009 05:04with t as ( select 20091001 dt, 1 val from dual union all select 20091001, 3 from dual union all select 20091001, 4 from dual union all select 20091001, 3 from dual union all select 20091001, 4 from dual union all select 20091001, 5 from dual union all select 20091001, 6 from dual union all select 20091001, 2 from dual union all select 20091001, 4 from dual union all select 20091001, 1 from dual union all select 20091001, 1 from dual union all select 20091001, 3 from dual union all select 20091002, 7 from dual union all select 20091002, 8 from dual union all select 20091002, 3 from dual union all select 20091002, 2 from dual union all select 20091002, 1 from dual union all select 20091002, 5 from dual union all select 20091002, 12 from dual union all select 20091003, 10 from dual union all select 20091003, 12 from dual union all select 20091003, 4 from dual union all select 20091003, 6 from dual union all select 20091003, 4 from dual union all select 20091003, 3 from dual union all select 20091003, 4 from dual union all select 20091003, 17 from dual union all select 20091003, 16 from dual union all select 20091004, 17 from dual union all select 20091004, 18 from dual union all select 20091004, 19 from dual union all select 20091004, 20 from dual union all select 20091004, 1 from dual union all select 20091004, 2 from dual union all select 20091004, 21 from dual ) select dt, sum(cnt) over(order by dt) cnt from ( select dt, count(*) cnt from (select min(dt) dt from t group by val) group by dt) -
Hello
I'm fighting to get a sort of running a table number, but I can't do it without a view... But maybe there is a better way to do it.
The table is:
ID     CAT_ID     NAME     FLAG
1     2     AAA          null
2     2     BBB          A
3     2     CCC          A
4     2     DDD          null
5     4     AAA          null
6     2     EEE          B
7     2     FFF          A
And I need to count the flag 'A' for CAT_ID = 2, the result should be like:
ID     CAT_ID     NAME     FLAG     COUNT
1     2     AAA          null          0
2     2     BBB          A          1
3     2     CCC          A          2
4     2     DDD          null          2
6     2     EEE          B          2
7     2     FFF          A          3
Please notify.
Thank you!
CASES plus number of race through Analytics, something like this:
SELECT location_id, country_id, COUNT(CASE WHEN country_id='US' THEN 1 END) OVER (ORDER BY location_id)
Sites
ORDER BY 1
-
How to get essbase excel add in the display of the total cumulative number?
Version 11.1.2.1
When I connect firstly in my ASO application via the excel add-in, the first thing I see is a null value. My first dimension/column is 'period '. Period is marked as a dynamic calc and label only.
When I drill down in the period I see obviously all rollup values. How can I get the excel to display the full cumulation (instead of having to drill down) when I connect firstly because I like to keep my options as ' delete missing values / zeros "checked.
I see in Sample.Basic is 105522. I want something like that. I tried reloading the numbers and changed the properties without result.
What is the logic behind this?If "Period" is marked as 'Label only' it will take the value of her first child, if the first child has a value of #Missing, then "Period" also will display a value of #Missing. If you want to 'Period' to show all the periods (as Sample.Basic does) then you need to take off the "Label" label only
-
Hi guys,.
I have the following sql query:
and I want to make a sum accumulated on the results returned byselect trim(to_char(to_date(substr(assn.creationdate, 0, instr(assn.creationdate, ':', 1, 3) - 1), 'YYYY/MM/DD-HH24:MI:SS') + 10 / 24, 'mm')) || ' - ' || to_char(to_date(substr(assn.creationdate, 0, instr(assn.creationdate, ':', 1, 3) - 1), 'YYYY/MM/DD-HH24:MI:SS') + 10 / 24, 'YYYY') as par_date, (case when prochis.stateoutreq = 't1Issued' then 'A-Submit' when prochis.stateoutreq = 'LcsRejected' then 'A-Return' when prochis.stateoutreq = 't3RevResp' then 'A-Return' when prochis.stateoutreq = 'CcfReview' then 'A-Return' when prochis.stateoutreq = 't3Validated' then 'A-Return' end) as par_stage, count(case when (prochis.processname = 't3_AWD_Awaiting_Cust_Response') then 1 when (prochis.processname = 't3_AWD_Send_PAR') then 1 when (prochis.processname = 't3_AWD_Send_PAR_PartB') then 1 when (prochis.processname = 't3_AWD_Await_PAR_B_Response') then 1 end) as par_stage_count from awdbt1m4.cmchrqit par left outer join ttcadminref@TCDWHS aref on par.lifecyclestate = aref.short inner join awdbt1m4.asgsig assn on assn.left = par.obid inner join awdbt1m4.prochist prochis on assn.right = prochis.obid where (case when prochis.stateoutreq = 't1Issued' then 'A-Submit' when prochis.stateoutreq = 'LcsRejected' then 'A-Return' when prochis.stateoutreq = 't3RevResp' then 'A-Return' when prochis.stateoutreq = 'CcfReview' then 'A-Return' when prochis.stateoutreq = 't3Validated' then 'A-Return' when prochis.statein = 't3IssPartB' then 'B-Submit' when prochis.stateoutreq = 't3RevPartB' then 'B-Return' when prochis.stateoutreq = 't1FinRev' then 'B-Return' end) is not null and prochis.stateoutreq in ('t1Issued', 'LcsRejected', 't3RevResp', 'CcfReview', 't3Validated') and prochis.lifecyclename = 'PAR Lifecycle' group by trim(to_char(to_date(substr(assn.creationdate, 0, instr(assn.creationdate, ':', 1, 3) - 1), 'YYYY/MM/DD-HH24:MI:SS') + 10 / 24, 'mm')) || ' - ' || to_char(to_date(substr(assn.creationdate, 0, instr(assn.creationdate, ':', 1, 3) - 1), 'YYYY/MM/DD-HH24:MI:SS') + 10 / 24, 'YYYY'), (case when prochis.stateoutreq = 't1Issued' then 'A-Submit' when prochis.stateoutreq = 'LcsRejected' then 'A-Return' when prochis.stateoutreq = 't3RevResp' then 'A-Return' when prochis.stateoutreq = 'CcfReview' then 'A-Return' when prochis.stateoutreq = 't3Validated' then 'A-Return' end) order by par_stage
contained in the sql query.count(case when (prochis.processname = 't3_AWD_Awaiting_Cust_Response') then 1 when (prochis.processname = 't3_AWD_Send_PAR') then 1 when (prochis.processname = 't3_AWD_Send_PAR_PartB') then 1 when (prochis.processname = 't3_AWD_Await_PAR_B_Response') then 1 end) as par_stage_count
I tried many ways to do it, but with the help of County and the amount in the same query with a group clause is causing many questions... Any help is greatly appreciated.
If I add the following section to the application after the statement of counting: over (partition by column) I - not a group expression error message.
Thank you
Rohan
Published by: rbha4 on 11/03/2010 15:45Could you place everything in a view online and apply the analytical function in the outer query?
-
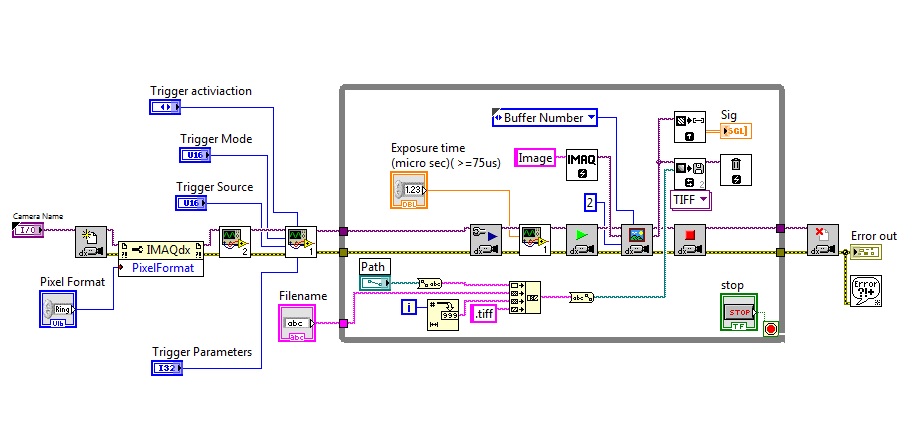
capture multiple and reading images
Hi all
I use a Guppy F031 Pro camera equipped with trigger mode in bulk. Now I can leave the exposure of the device twice in the series after an external trigger (my previous post). But I don't know where are the stored images and how to read the two outside pictures and store them in the hard disk.
When I use IMAQdx get image vi to capture image and set as number mode with 2 buffer pads.
Does this mean that I assigned two location in RAM for my image? If so, how can I find their location?
Best,
Wen
"When I use IMAQdx get image vi to capture image and set as number mode with 2 buffer pads.
Does this mean that I assigned two location in RAM for my image? If so, how can I find their location? »
-To my knowledge, it is false.
Buffer allocation:
-There are two types of internal buffers and buffer of the user you want to set up and use.
-internal buffer is that you can configure using IMAQdx configure acquisition and giving the required number of buffers you want to allocate.
-the user buffer is a condigure you or create using IMAdx create and giving them different middle names, creating several buffers. (You must remove the user buffers when finished processing using IMAQdx has, otherwise it will fill the RAM memory.
Number of buffer:
-A number of buffer is a zero-based index that represents the cumulative number transferred image. For example, during an acquisition continues with three internal buffers, the number of buffers is updated as follows: 0, 1, 2, 3, 4, 5 and so on. Buffer 0 and 3 numbers correspond to the same internal buffer in the ring of the buffer. (From NI IMAQdx manual)
-Which means you will need to give different buffers number each time adding 1 whenever you receive an image. and not a constant of 2.
For your question:
-Configure the acquisition with more than two buffers, start the acquisition.
-Give the number of buffers to 0 and increment after successful image and send it to IMAQdx get image.
-For each image, your user buffer is even currently, which means that it will overwrite the same. If you want them to be different, you can create several and use also.
-
Spectral histogram of adc output
G ' Day all the
I have a LabVIEW task that I'm confident should be dealt with before (several times). However, not for the life of find me a solution documented. It's displaying a range of possibilities of an ADC on a histogram channel (no, not the statistical flavor - the spectral version of science).
I have a 8 k ADC front-end DAQ loop which (for reasons of this example) gives me the amplitude of incoming impulse (value between 0 and 8191). In this loop, I would a 'live' spectrum in real-time of the cumulative number of hits by way of the ADC.
I can think of ways using an 8 k array and incrementing the bins manually but how to get the data in the table persistent in the loop... and actually display.
If I have to invent my own wheel to solve this problem while it is OK, but I'm sure that like most of my brothers of coding, I'd rather use someone else

See you soon
SteveLook at this example of a histogram. Which is similar to what you need?
-
Hello
I use the entrance of counter/timer on a map of 6040E for counting of events.
I use CTR0 and have specified the clock 20 MHz as my source and connected my event at the door (PFI9). I has a finite number of impulses and I am configuration of the buffer using the DAmx Timing (example of clock) vi.
My question concerns the entry of 'rate. ' Counter source is positioned at 20 MHz is not the rate? Can anyone advise as to how to choose a reasonable value and what effect it has.
I usually use the rate for analog I/o buffers in order to fix the rate of buffer - I can't quite see its use in this case.
Thank you
I forgot to go to the part of rates, for counting of events, the rate is how many times buffering you your edge counter value.
IE I count photons a PMT, I would like to see the cumulative number every 1ms so I plug the source on the PMT and run continious at 1 kHz, every second, I read 1000pts and plot. I think that this is how the rate. For measurements, the clock is implied, there is no price since the edges of ascnchronous determines the time to write to the buffer.
-
Help explain the flow meter VI
After a lot of tinkering, I seem to have developed an effective VI for use with a type/pelton turbine flowmeter. The flow meter outputs a stream of pulses which
can count on the counter of my 6501 line. Unfortunately this eureka moment happened somewhat by chance, and I'm hoping someone
could be kind enough to explain step by step or in terms very simple for beginners (me) works of VI, thank you.
Kind regards
GER
GER,
Welcome to the Forums and LabVIEW.
If you don't the have already made, please work through the tutorials online to get started with LabVIEW. The answers to some of the questions you may have are probably there.
A brief description of your VI:
1. the overall structure is a loop For. It works for the number of iterations that is connected to the Terminal in your case 5 N.
2. the calendar of the loop is determined by the longest time required for any part of the code inside the loop execution. On the first iteration, the DAQ Assistant configures the counter and starts measurement. On all subsequent iterations, he reads everything simply an indictment. On these iterations, the 25 les 25 ms ms expect will dominate. This VI runs approximately 40 iterations per second (for 5 iterations).
This means that the program will take place on 5 * 25 ms = 0.125 sec and then stops. If you run for more 1/8 of a second to help run it continuously button, STOP. Which is intended for certain types of troubleshooting only.
3. the table of waveform and the flow rate meter only shows the last value of the five iterations. (This suggests also that you use run continuously)
4. the registers at offset in this VI nothing do. The upper shift register calculates the cumulative number of the flow meter, but the result is never used. The underpass registry has nothing connected to the Terminal inside the loop on the left. It could be replaced by a terminal.
Suggestions:
1. in order to avoid using run continuously, replace the loop with a while for loop. Add a stop button on the front panel and connect it to the stop it real terminal in the loop. Move the graphic terminals of waveform and flow inside the loop.
2 check your pulse to the algorithm of flow rate. The time for the count interval must be considered. For example if the meter registers 25 pulse in 25 Member States, which represents 1 000 pulses per second. This isn't which will show your VI.
3. see examples of code that uses counters.
Lynn
-
Monitoring of VPN - running Total
Hello
I was wondering what is the meaning of the Total cumulative number means? I guess it's just the total amount of connection which took place up to this point and does not affect the total number of allowed simultaneous connections?
Thank you.
Hi Max,.
The cumulative is simply a number of Ipsec firewall connections recorded since is online. This has no effect on the number of counterparts Ipsec or VPN simultaneous connections the ASA can manage. Cumulative are just statistical database on all of your SSL/VPN, etc... saved connections.
These statistics can be eliminated by clear statistics of vpn-sessiondb in global configuration, or mode when the firewall is reloading.
Kind regards
Jorge
-
How to pass the value of an element in a function called by a procedure
Hello
I have a procedure named PROCEDURE AFFICHAGE_PLUVIO_VEILLE (sorry I don't know how to get in shape for the code):
{code: sql}create or replace PROCEDURE AFFICHAGE_PLUVIO_VEILLE AS
CURSOR curs1 is
Select the site, name, site_pluviometre clef_var
where EN_SERVICE = 'YES ';
number of stmt;
BEGIN
DELETE FROM PLUVIO_DATA;
for m loop curs1
stmt: = calc_pluvio (m.clef_var);
INSERT INTO pluvio_data values (m.clef_var, stmt);
end loop;
commit;
END AFFICHAGE_PLUVIO_VEILLE; {code}
This procedure calls a function:
{code: sql}create or replace function "CALC_PLUVIO" (station NUMBER)
return the number is the default number of 0 total.
BEGIN
WITH PRECIPITATION AS
(SELECT DATE1 RAINFALLDATE, VALUE
OF EVV_STPL
WHERE CLEF_VAR = station
AND TRUNC (DATE1) = TRUNC (sysdate-1))
SELECT SUM (TOTO) INTO CUMULATION
DE)
SELECT TRUNC (RAINFALLDATE) AS date,
VALUE,
(VALUE) AHEAD OF (TRUNC PARTITION (RAINFALLDATE)
ORDER BY RAINFALLDATE
) - VALUE AS TOTO
PRECIPITATION
)
WHERE TOTO > = 0
GROUP BY date;
DATE OF RETURN;
EXCEPTION
WHEN NO_DATA_FOUND THEN
TOTAL: = 0;
DATE OF RETURN;
END; {code}
You can see that the function uses 'sysdate-1' regarding the date. " In order to be more flexible with the date and to be able to use a date other than the date of the previous day, I would like to pass as a parameter to the function of the value of a page called P1_DATE.
But, how can I do? Function CALC_PLUVIO' is called by the stored procedure 'AFFICHAGE_PLUVIO_VEILLE of PROCEDURE' for which I can not transmit to any parameter as for example the P1_DATE element.
I use Application Express 5.0.1.00.06
Thank you for your help.
Chipniz wrote:
I have a procedure named AFFICHAGE_PLUVIO_VEILLE of PROCEDURE (sorry I don't know how to get in shape for the code):
Click on the link to the editor advanced usage in the top right of the edit box, select the code in the editor and choose the language desired from the syntax highlighting options in > toolbar button menu. (For SQL and PL/SQL code, use "SQL").
create or replace PROCEDURE AFFICHAGE_PLUVIO_VEILLE AS
  CURSOR curs1 is
    select site, nom, clef_var from site_pluviometre
              where EN_SERVICE = 'OUI';
  stmt number;
BEGIN
  DELETE FROM PLUVIO_DATA;
  for m in curs1 loop
    stmt := calc_pluvio (m.clef_var);
    INSERT INTO pluvio_data values (m.clef_var, stmt);
  end loop;
    commit;
END AFFICHAGE_PLUVIO_VEILLE;
This procedure calls a function:
create or replace function "CALC_PLUVIO" (station in NUMBER)
return number is cumul number default 0;
BEGIN
WITH RAINFALL AS
(SELECT DATE1 RAINFALLDATE, VALEUR VALUE
FROM    EVV_STPL
WHERE  CLEF_VAR = station
AND        TRUNC (DATE1) = TRUNC (sysdate-1))
SELECT SUM (TOTO) INTO CUMUL
FROM (
SELECT TRUNC (RAINFALLDATE) AS datte,
VALUE,
LEAD (VALUE) OVER ( PARTITION BY TRUNC (RAINFALLDATE)
ORDER BY RAINFALLDATE
) - VALUE AS TOTO
FROM RAINFALL
)
WHERE TOTO >= 0
GROUP BY datte;
RETURN CUMUL;
EXCEPTION
    WHEN NO_DATA_FOUND THEN
        CUMUL := 0;
    RETURN CUMUL;
END;
You can see that the function uses ' sysdate-1' regarding the date. " To be more flexible with the date and to be able to use a date other than the date of the previous day, I want to pass as a parameter to the function of the value of a page called P1_DATE.
But, how can I do? The CALC_PLUVIO function ' is called by the stored procedure 'AFFICHAGE_PLUVIO_VEILLE of PROCEDURE' for which I can not transmit to any parameter as for example the P1_DATE element.
What do you mean by "I can't pass any parameter"? That you cannot change the signatures of the procedure and function?
Passage of a parameter is the recommended approach. Including a default value will ensure that programs are backward compatible with existing code that does not it:
create or replace PROCEDURE AFFICHAGE_PLUVIO_VEILLE (p_rainfall_date in date default null) AS
  CURSOR curs1 is
    select site, nom, clef_var from site_pluviometre
              where EN_SERVICE = 'OUI';
  stmt number;
BEGIN
  DELETE FROM PLUVIO_DATA;
  for m in curs1 loop
    stmt := calc_pluvio (m.clef_var, p_rainfall_date);
    INSERT INTO pluvio_data values (m.clef_var, stmt);
  end loop;
    commit;
END AFFICHAGE_PLUVIO_VEILLE;
create or replace function "CALC_PLUVIO" (station in NUMBER, p_rainfall_date in date default null) return number is cumul number default 0; rainfall_date date; BEGIN rainfall_date := trunc(coalesce(p_rainfall_date, sysdate-1)); WITH RAINFALL AS (SELECT DATE1 RAINFALLDATE, VALEUR VALUE FROM EVV_STPL WHERE CLEF_VAR = station AND TRUNC (DATE1) = calc_pluvio.rainfall_date) SELECT SUM (TOTO) INTO CUMUL FROM ( SELECT TRUNC (RAINFALLDATE) AS datte, VALUE, LEAD (VALUE) OVER ( PARTITION BY TRUNC (RAINFALLDATE) ORDER BY RAINFALLDATE ) - VALUE AS TOTO FROM RAINFALL ) WHERE TOTO >= 0 GROUP BY datte; RETURN CUMUL; EXCEPTION WHEN NO_DATA_FOUND THEN CUMUL := 0; RETURN CUMUL; END;This code can be called APEX by:
AFFICHAGE_PLUVIO_VEILLE(p_rainfall_date => to_date(:p1_date, 'DD-MON-YYYY')); -- change format mask to that used in the P1_DATE item
Moreover, if the P1_DATE element is the only possible source of another value on the date of the rain, then the value can be referenced directly in the function:
create or replace function "CALC_PLUVIO" (station in NUMBER) return number is cumul number default 0; rainfall_date date; BEGIN rainfall_date := trunc(coalesce(v('P1_DATE'), sysdate-1)); WITH RAINFALL AS (SELECT DATE1 RAINFALLDATE, VALEUR VALUE FROM EVV_STPL WHERE CLEF_VAR = station AND TRUNC (DATE1) = calc_pluvio.rainfall_date) SELECT SUM (TOTO) INTO CUMUL FROM ( SELECT TRUNC (RAINFALLDATE) AS datte, VALUE, LEAD (VALUE) OVER ( PARTITION BY TRUNC (RAINFALLDATE) ORDER BY RAINFALLDATE ) - VALUE AS TOTO FROM RAINFALL ) WHERE TOTO >= 0 GROUP BY datte; RETURN CUMUL; EXCEPTION WHEN NO_DATA_FOUND THEN CUMUL := 0; RETURN CUMUL; END; -
How oracle decide whetehr to use the index or full analysis (statistics)
Hi guys,.
Let's say I have an index on a column.
Tables and index statistics were collected. (without the histograms).
Let's say I have run a select * from table where a = 5;
Oracle will perform a complete analysis.
But what statistics, it will be able to know indeed the greater part of the column = 5? (histograms do not used)
After analysis, we get the following:
Statistical table:
(NUM_ROWS)
(BLOCKS)
(EMPTY_BLOCKS)
(AVG_SPACE)
(CHAIN_COUNT)
(AVG_ROW_LEN)
Index statistics:
(BLEVEL)
(LEAF_BLOCKS)
(DISTINCT_KEYS)
(AVG_LEAF_BLOCKS_PER_KEY)
(AVG_DATA_BLOCKS_PER_KEY)
(CLUSTERING_FACTOR)
Thank you
Index of column (A)
======
1
1
2
2
5
5
5
5
5
5I have prepared a few explanations and did not notice that the topic has been marked as answer.
My sentence is not quite true.
A column "without histograms' means that the column has only a bucket.
More correct: even without the histogram there are data in dba_tab_histograms which can be considered a bucket for the whole column. In fact, these data are extracted from hist_head$, not from $ histgrm as usual buckets.
Technically there are no buckets without combined histograms.Let's create a table with the asymmetric data distribution.
SQL> create table t as
  2  select least(rownum,3) as val, '*' as pad
  3    from dual
  4  connect by level <= 1000000;

Table created

SQL> create index idx on t(val);

Index created

SQL> select val, count(*)
  2    from t
  3   group by val;

       VAL   COUNT(*)
---------- ----------
         1          1
         2          1
         3     999998
So, we have table with the very uneven distribution of the data.
We collect statistics without histograms.SQL> exec dbms_stats.gather_table_stats( user, 'T', estimate_percent => 100, method_opt => 'for all columns size 1', cascade => true); PL/SQL procedure successfully completed SQL> select blocks, num_rows from dba_tab_statistics 2 where table_name = 'T'; BLOCKS NUM_ROWS ---------- ---------- 3106 1000000 SQL> select blevel, leaf_blocks, clustering_factor 2 from dba_ind_statistics t 3 where table_name = 'T' 4 and index_name = 'IDX'; BLEVEL LEAF_BLOCKS CLUSTERING_FACTOR ---------- ----------- ----------------- 2 4017 3107 SQL> select column_name, 2 num_distinct, 3 density, 4 num_nulls, 5 low_value, 6 high_value 7 from dba_tab_col_statistics 8 where table_name = 'T' 9 and column_name = 'VAL'; COLUMN_NAME NUM_DISTINCT DENSITY NUM_NULLS LOW_VALUE HIGH_VALUE ------------ ------------ ---------- ---------- -------------- --------------- VAL 3 0,33333333 0 C102 C104Therefore, Oracle suggests that the values between 1 and 3 (raw C102 C104) are distributed uniform and the density of the distribution is 0.33.
We will try to explain the planSQL> explain plan for 2 select --+ no_cpu_costing 3 * 4 from t 5 where val = 1 6 ; Explained SQL> @plan -------------------------------------------------- | Id | Operation | Name | Rows | Cost | -------------------------------------------------- | 0 | SELECT STATEMENT | | 333K| 300 | |* 1 | TABLE ACCESS FULL| T | 333K| 300 | -------------------------------------------------- Predicate Information (identified by operation id): --------------------------------------------------- 1 - filter("VAL"=1) Note ----- - cpu costing is off (consider enabling it)An excerpt from trace 10053
BASE STATISTICAL INFORMATION
***********************
Table Stats::
  Table:  T  Alias:  T
    #Rows: 1000000  #Blks:  3106  AvgRowLen:  5.00
Index Stats::
  Index: IDX  Col#: 1
    LVLS: 2  #LB: 4017  #DK: 3  LB/K: 1339.00  DB/K: 1035.00  CLUF: 3107.00
***************************************
SINGLE TABLE ACCESS PATH
  -----------------------------------------
  BEGIN Single Table Cardinality Estimation
  -----------------------------------------
  Column (#1): VAL(NUMBER)
    AvgLen: 3.00 NDV: 3 Nulls: 0 Density: 0.33333 Min: 1 Max: 3
  Table:  T  Alias: T
    Card: Original: 1000000  Rounded: 333333  Computed: 333333.33  Non Adjusted: 333333.33
  -----------------------------------------
  END   Single Table Cardinality Estimation
  -----------------------------------------
  Access Path: TableScan
    Cost:  300.00  Resp: 300.00  Degree: 0
      Cost_io: 300.00  Cost_cpu: 0
      Resp_io: 300.00  Resp_cpu: 0
  Access Path: index (AllEqRange)
    Index: IDX
    resc_io: 2377.00  resc_cpu: 0
    ix_sel: 0.33333  ix_sel_with_filters: 0.33333
    Cost: 2377.00  Resp: 2377.00  Degree: 1
  Best:: AccessPath: TableScan
         Cost: 300.00  Degree: 1  Resp: 300.00  Card: 333333.33  Bytes: 0
FTS here costs 300 and Index Range Scan here costs 2377.
I disabled cpu cost, so the selectivity does not affect the cost of FTS.
cost of the Index Range Scan is calculated as
blevel + (leaf_blocks * selectivity + clustering_factor * selecivity) = 2 + (4017 * 0.33333 + 3107 * 0.33333) = 2377.
Oracle believes that he must read 2 blocks root/branch index, 1339 the index leaf blocks and 1036 blocks in the table.
Pay attention that the selectivity is the main component of the cost of the Index Range Scan.We will try to collect histograms:
SQL> exec dbms_stats.gather_table_stats( user, 'T', estimate_percent => 100, method_opt => 'for columns val size 3', cascade => true);

PL/SQL procedure successfully completed
If you look at dba_tab_histograms you can see more
SQL> select endpoint_value,
  2         endpoint_number
  3    from dba_tab_histograms
  4   where table_name = 'T'
  5     and column_name = 'VAL'
  6  ;

ENDPOINT_VALUE ENDPOINT_NUMBER
-------------- ---------------
             1               1
             2               2
             3         1000000
ENDPOINT_VALUE is the value of the column (in number for any type of data) and ENDPOINT_NUMBER is the cumulative number of lines.
Number of lines for any ENDPOINT_VALUE = ENDPOINT_NUMBER for this ENDPOINT_VALUE - ENDPOINT_NUMBER to the previous ENDPOINT_VALUE.explain the plan and track 10053 the same query:
------------------------------------------------------------
| Id  | Operation                   | Name | Rows  | Cost  |
------------------------------------------------------------
|   0 | SELECT STATEMENT            |      |     1 |     4 |
|   1 |  TABLE ACCESS BY INDEX ROWID| T    |     1 |     4 |
|*  2 |   INDEX RANGE SCAN          | IDX  |     1 |     3 |
------------------------------------------------------------
Predicate Information (identified by operation id):
---------------------------------------------------
   2 - access("VAL"=1)
Note
-----
   - cpu costing is off (consider enabling it)
*************************************** BASE STATISTICAL INFORMATION *********************** Table Stats:: Table: T Alias: T #Rows: 1000000 #Blks: 3106 AvgRowLen: 5.00 Index Stats:: Index: IDX Col#: 1 LVLS: 2 #LB: 4017 #DK: 3 LB/K: 1339.00 DB/K: 1035.00 CLUF: 3107.00 *************************************** SINGLE TABLE ACCESS PATH ----------------------------------------- BEGIN Single Table Cardinality Estimation ----------------------------------------- Column (#1): VAL(NUMBER) AvgLen: 3.00 NDV: 3 Nulls: 0 Density: 5.0000e-07 Min: 1 Max: 3 Histogram: Freq #Bkts: 3 UncompBkts: 1000000 EndPtVals: 3 Table: T Alias: T Card: Original: 1000000 Rounded: 1 Computed: 1.00 Non Adjusted: 1.00 ----------------------------------------- END Single Table Cardinality Estimation ----------------------------------------- Access Path: TableScan Cost: 300.00 Resp: 300.00 Degree: 0 Cost_io: 300.00 Cost_cpu: 0 Resp_io: 300.00 Resp_cpu: 0 Access Path: index (AllEqRange) Index: IDX resc_io: 4.00 resc_cpu: 0 ix_sel: 1.0000e-06 ix_sel_with_filters: 1.0000e-06 Cost: 4.00 Resp: 4.00 Degree: 1 Best:: AccessPath: IndexRange Index: IDX Cost: 4.00 Degree: 1 Resp: 4.00 Card: 1.00 Bytes: 0Be careful on selectivity, ix_sel: 1.0000e - 06
Cost of the FTS is always the same = 300,
but the cost of the Index Range Scan is now 4: 2 blocks from root/branch + block 1 sheet + 1 table blocks.So, conclusion: histograms to calculate more accurate selectivity. The goal is to have more efficient execution plans.
Alexander Anokhin
http://alexanderanokhin.WordPress.com/ -
SQL query problem finding difference in documents
Hi all
I use oracle 10g. I need emergency aid to find the difference in documents based on the date:
I have sales of the table as below:
seller SALES_COUNT DATE
JOHN 20 04/01/2012
DENNY 15 04/01/2012
JOHN 30 04/02/2012
DENNY 30 04/02/2012
JOHN 45 04/03/2012
DENNY 50 04/03/2012
SALES_COUNT is up to man including the date of sale. Its similar cumulative number. John has total sales of 01/04/2012 to 03/04/2012 is 50 and same case for Denny. This SALES_COUNT will keep increasing with dates as sales continue to add in the table for each salesperson.
But I want to have seprate for each seller counties.
for example: JOHN SALES_COUNT 04/02/2012 is 30-20 = 10
JOHN SALES_COUNT 03/04/2012 is 45-30 = 15
DENNY SALES_COUNT, 02/04/2012 is 30-15 = 15
JOHN SALES_COUNT 03/04/2012 is 50-30 = 20
Please help me with this scenario and let me know if you need clarification. I would much appreciate your help.
Thank you.This gives you what you want?
with t as ( select 'JOHN' salesman, 20 sales_count, to_date('04/01/2012', 'mm/dd/yyyy') sale_date from dual union all select 'DENNY' salesman, 15 sales_count, to_date('04/01/2012', 'mm/dd/yyyy') sale_date from dual union all select 'JOHN' salesman, 30 sales_count, to_date('04/02/2012', 'mm/dd/yyyy') sale_date from dual union all select 'DENNY' salesman, 30 sales_count, to_date('04/02/2012', 'mm/dd/yyyy') sale_date from dual union all select 'JOHN' salesman, 45 sales_count, to_date('04/03/2012', 'mm/dd/yyyy') sale_date from dual union all select 'DENNY' salesman, 50 sales_count, to_date('04/03/2012', 'mm/dd/yyyy') sale_date from dual ) select salesman, sales_count sales_todate, sale_date, sales_count - lag(sales_count, 1, 0) over (partition by salesman order by sale_date) daily_sales from t SALESMAN,SALES_TODATE,SALE_DATE,DAILY_SALES DENNY,15,4/1/2012,15 DENNY,30,4/2/2012,15 DENNY,50,4/3/2012,20 JOHN,20,4/1/2012,20 JOHN,30,4/2/2012,10 JOHN,45,4/3/2012,15 -
Query to select values that correspond to several beaches
Hello
Oracle 10g.
I have a POINTS table (ID INTEGER, CLASS VARCHAR2 (15), CUMULATIVE NUMBER (2.1),...).
In my application (APEX), I show a list of classes of point, order by date.
Then the user can choose a range of classes point (CUMULATION is not indicated in the request, it's just for example):SELECT CLASS FROM POINTS ORDER BY CUMUL;
For each range, I only store the first classes and he would give the last selected by a user, in a table USER_SELECTION (ID, ID_USER, FROM_CLASS, TO_CLASS), so using the example above:CUMUL CLASS 12.2 31458 <- 13.4 5S84 <- range 1 13.6 78PPH <- 15.0 3R594 <- 15.1 ZB452 15.5 54IO 17.6 21GFD 19.2 A54VV <- 19.9 IC112 <- range 2 20.8 158RC9 <- 21.3 G4G5 23.0 V22 <- range 3
The problem is that in a query, I need to return all items selected by a user, and I don't really know how to get there without too much work...:ID ID_USER FROM_CLASS TO_CLASS 1 12 31458 3R594 2 12 A54VV 158RC9 3 12 V22 V22 ... ... ... ...
SELECT *.
POINTS
WHEN USER_ID = 12
AND IN THE CLASS (*? *);
Any help would be appreciated.
Yann.It is clear exactly what data are held in which tables etc but maybe something like this...
select user_selection.id, points.* from points, user_selection where user_selection.user_id = 12 and points.cumul between (select cumul from points where class = user_selection.class1) and (select cumul from points where class = user_selection.class2) order by user_select.id, points.cumul -
HFM - error illegal assignment rules editor
HFM version 9.3.1.0.0 rules editor
I wrote rules to get a cumulative number from January to November.
I managed to do work until September, but when I get to October he gives me an error when I consolidate illegal assignment: "OCT."
Why Oct would be illegal? In the code Oct (see below) appears blue, but all other months appear in black. Does anyone know what's not here?
Here is the code:
If vDollar_Overrides_8 = 0 and vDollar_Overrides_9 = 0 Then
("Sep = Aug & ') + ((A #"& sAcct &".)) C1 #TOTC1. C2 #[no]. Top of P #Aug.I #[ICP]. C4 #[no]. V # < entity Curr Total > * "& EOM_9 &"-() "& _" ""
"A #" & sAcct & ".." C1 #TOTC1. C2 #[no]. Top of P #Aug.I #[ICP]. "C4 #[no].
On the other
Ms = 0
End if
If vDollar_Overrides_9 = 0 and vDollar_Overrides_10 = 0 Then
Mistake here = > ("Oct = Ms & ') + ((A #"& sAcct &".)) C1 #TOTC1. C2 #[no]. Top of P #Sep.I #[ICP]. C4 #[no]. V # < entity Curr Total > * "& EOM_10 &"-() "& _" ""
"A #" & sAcct & ".." C1 #TOTC1. C2 #[no]. Top of P #Sep.I #[ICP]. "C4 #[no].
On the other
Oct = 0
End if
If vDollar_Overrides_10 = 0 and vDollar_Overrides_11 = 0 Then
("Nov = oct & ') + ((A #"& sAcct &".)) C1 #TOTC1. C2 #[no]. Top of P #oct. I #[ICP]. C4 #[no]. V # < entity Curr Total > * "& EOM_11 &"-() "& _" ""
"A #" & sAcct & ".." C1 #TOTC1. C2 #[no]. Top of P #oct. I #[ICP]. "C4 #[no].
On the other
Nov = 0
End if
HS.exp "A #" & sAcct & ".." C2 #TAX_CTA_Chg_PYDec.I #[ICP None]. "C4 # = [none] (" ' & Nov & "").Odd - did the same thing on my HFM rules editor. It's as if the editor uses "Oct" as a system variable or a command. Briefly, I looked at the Oracle's Web site for documentation on the rules editor, but found nothing. You can use "strOct" or a Variant to work around the problem.
Maybe you are looking for
-
What should I use for a replacement of WinMail in Windows.
What should I use for a replacement from WinMail in Windows 7 when requires it a number of sites to meet an address or a link that the site offers an answer or a question. I have msn, yahoo & gmail but lost WinMail when I've upgraded from Vista to W
-
Differences between models Aspire R7
Can someone tell me exactly what are the differences between the R7 Aspire 572-6423 and the R7-572-54208G1Tass? Also, which of these two is the newer model? Thank you!
-
I get an error when you try to deploy a file of debug on a Z30 bar: result::failure 532 all development 100 slots are already in use I removed all applications development, renewed my debugging token, rebooted momentics and restarted the unit, but th
-
Our College has licenses for Adobe Photoshop purchased42. We received reminders of renewal, but we won't renew them thinking we would do it during the summer. We do not uninstall the software. Are we in any way responsible? Is required on our part to
-
Exit demo expiration Captivate9
HelloI am to evaluate Captivate9 trial version for our society. The output generated by the trial version (exe and outputs HTML5/Flash) has a form any expiration, such that the output content will become is no longer visible? There was a warning abou