DAQmx split or filter the signal
Goodday,
A map of 4461 PC, there are 2 mic's connected. I use the Read.Vi of the DAQmx for it with 'ai0:1' as physical addresses.
These signals is used to calculate the rms value.
And this value is sent to
Ai0-Ao0 online
and
AI1-online Ao1
But sometimes I want to use only one microphone and so only for example use "ai1" However when I do this the Ai1 signal is at Ao0.
AI1-Ao0 online.
It seems that the Read.vi write all channels "signals channel 0" instead of "Ai1 to waveform channel 1".
How can it be changed or filtered?
And is there a way to create a drop down menu to select Ai0:1 (multi-channel) control? one is to create is now only for selection of a channel.
The command select channel a constant has a menu drop-down to select one or more channels. Just use the browse option.
If you have only one selected channel, you don't have that one in the waveform table, so if you still want to affix a specific chart, ai1 put function index in array inside a case statement. You have three different only case - ai0 ai1 only, ai0 and ai1. Wire instruction box for graphics.
Tags: NI Software
Similar Questions
-
filter the peaks on the signal from ECG pulse!, help!
Hello
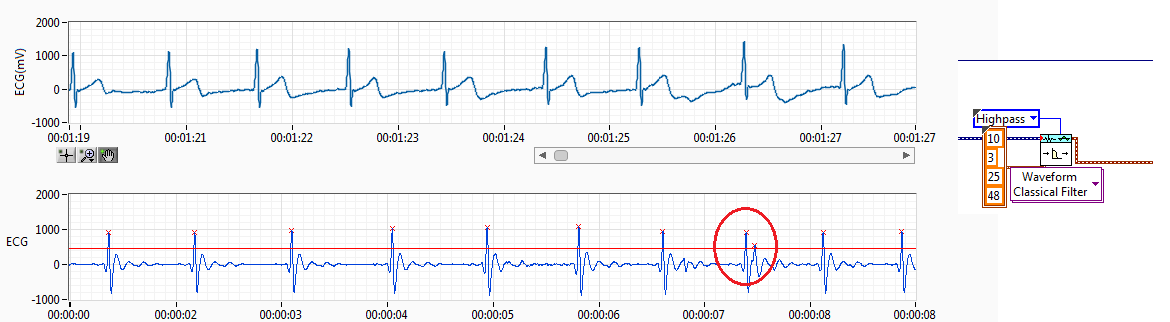
I have RCV of the ECG signal. I filtered the ECG signal and get the resource (interval between each pulse of ECG) records.
The source of the signal have noise I use a threshold but sometimes spikes of failure. Like the previous capture. Normally, if you get a pic of fault detected, I'll try to find this index to add to the left or right of the peak, normally I add to the lower value. This works if it has only a bad impulse between 2 good.
The problem come when I have more than a ridge between the two coupons.
Also, when the impulse of R a loss threshold I have trying to find the index and get 2 new reading making division 2 peak value.
I have attached the method I've used to adapt it. I only works if I have 1 Ridge added on real measures of R or pulse 1 loss R, when I have several pics no work.
I would like to hear an idea to make it work better. I don't like the idea of removing the value interval, I have 2 hours of reading and if I remove the values I have lower data outoput is why I tried to summarize or division of values to get the correct reading without losing any data.
Perhaps, there is any better filter for ECG of entry, so I have a R-own pulse and less noise between ECG pulses.
Any advice is welcome.
Best regards, Fred.
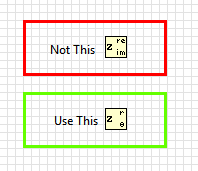
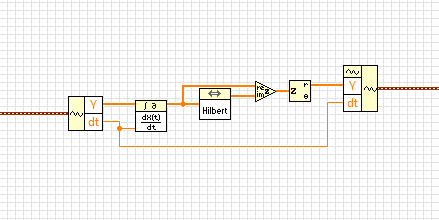
Almost. in the last step, you have extracted the real part of the complex waveform. Instead, you must retrieve the extent.
BTW, this idea isn't mine. I got from this article
http://www.ScienceDirect.com/science/article/PII/S0010482501000099
-
split the signal not showing multiple output
I'm dividing the multichannel signal from acquisition of data NOR-6008. When I connect the data to the separation of the vi signal, there is that a single output eventhough I did the dow to give me all the outputs.
Please help its urgent.
What version of LabVIEW are you using? You can post your VI?
If I remember, one of the versions of LabVIEW had a bug in how the signal split function would work.
-
How can I filter the noise of a signal?
Hello
I wonder if someone can point me in the right direction.
I got the task to analyse the signal from a load cell, measuring vertical efforts on a buoy in the ocean waves. All I have are data files - Earth "calibration" run and a period of measurement of forces in the water. They are both simply traces time force vs. time. Calibration run consisted of hanging weight of the load cell. The problem is that the signal is very noisy, with a +/-10% fluctuation around the average. I don't see any particular model or the periodicity for the noise, but there may be something there.
As a mechanical engineer, I don't know a lot about the signal processing, but I think there may be techniques to characterize the noise and filter it essentially leave the signal of interest (buoy in the water). I tried to run Fast Fourier Transforms of the calibration and signals live (in MS Excel), but they gave me a huge spread of frequency component, some with puzzlingy large amplitudes. Can anyone suggest alternative approaches or indicate where I have gone wrong?
Thank you.
What are the software tools you have at your disposal to achieve this? Using LabVIEW? What is the sampling frequency of your signal?
The first thing to look for are the functions of filter and start by using a simple low pass filter (for example: Butterworth filter). In view of your signal, you expect the signal to be less than 1 Hz, so put 1 Hz as the crossover frequency. Who should get rid of a lot of noise already.
-
How to filter the traces of tension TDMS after acquisition?
Simple question. We have acquired a lot of electrophysiological data with express signal. We now need to filter data after the acquisition for later analysis. I can import the files TDMS tension of previous experiences, but can't seem to run the filters we used on the side of the acquisition to filter the existing traces. Is there a simple way to do this?
-smb
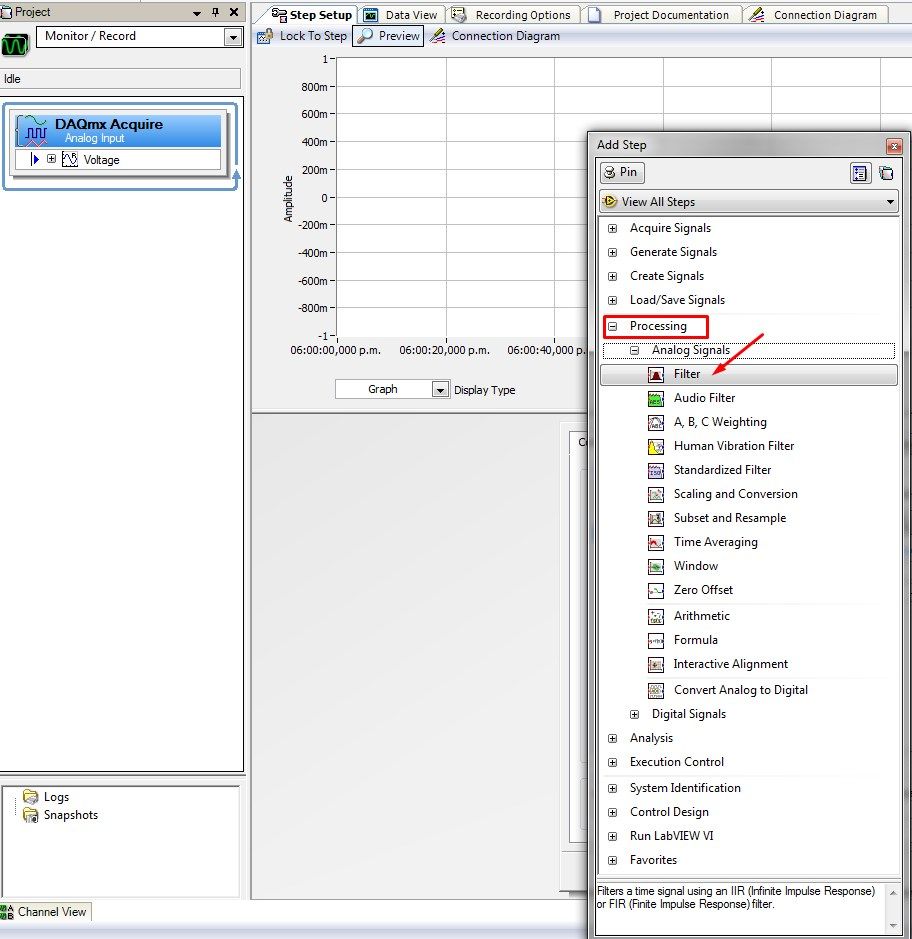
Hello Chinchilla,
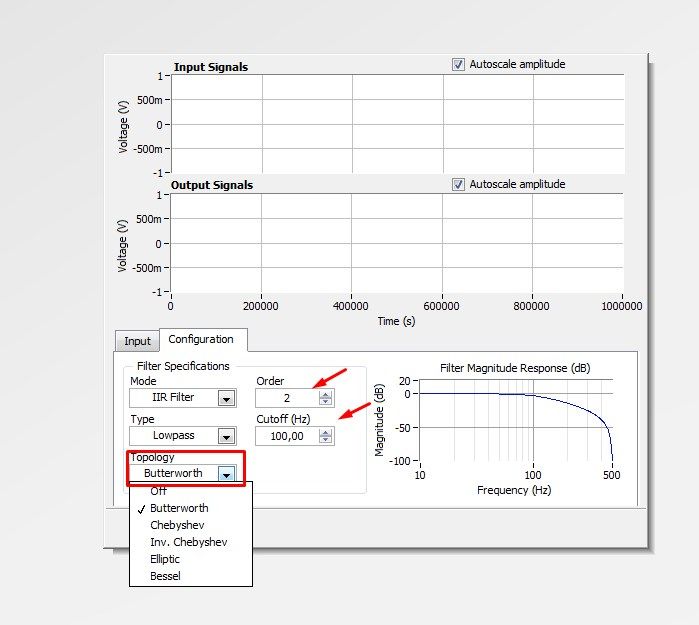
I enclose a few screenshots on how to add a step to an analog input filtering. You can select the type of filter and order too.
In this screenshot you can check how to change the configuration of the filter
Finally, you can access the TDMS of LabVIEW file with one of the examples of PDM. Please follow these instructions:
1. open LabVIEW
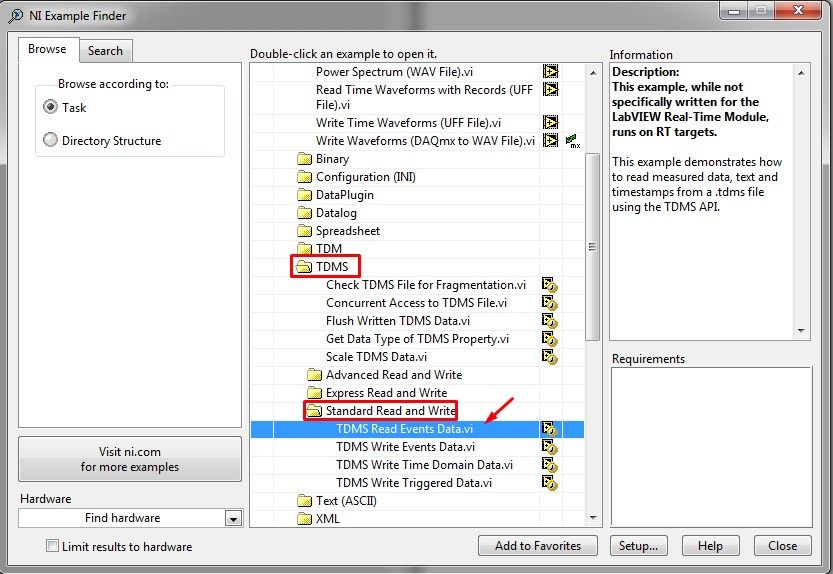
2 - go to help > find examples to open the Finder 'example '.
3 - Go to Fundamentals > file Input and Output > TDMS > Standard Read and Write and select the VI named TDMS read Events.vi
You will need to know the data present in the file to read correctly. For this, you can use the leading PDM Viewer VI:
http://zone.NI.com/reference/en-XX/help/371361K-01/Glang/tdms_file_viewer/
Or you can use the Toolbox for excel: http://www.ni.com/example/27944/en/ (allows you to transfer the data to Microsoft Excel).
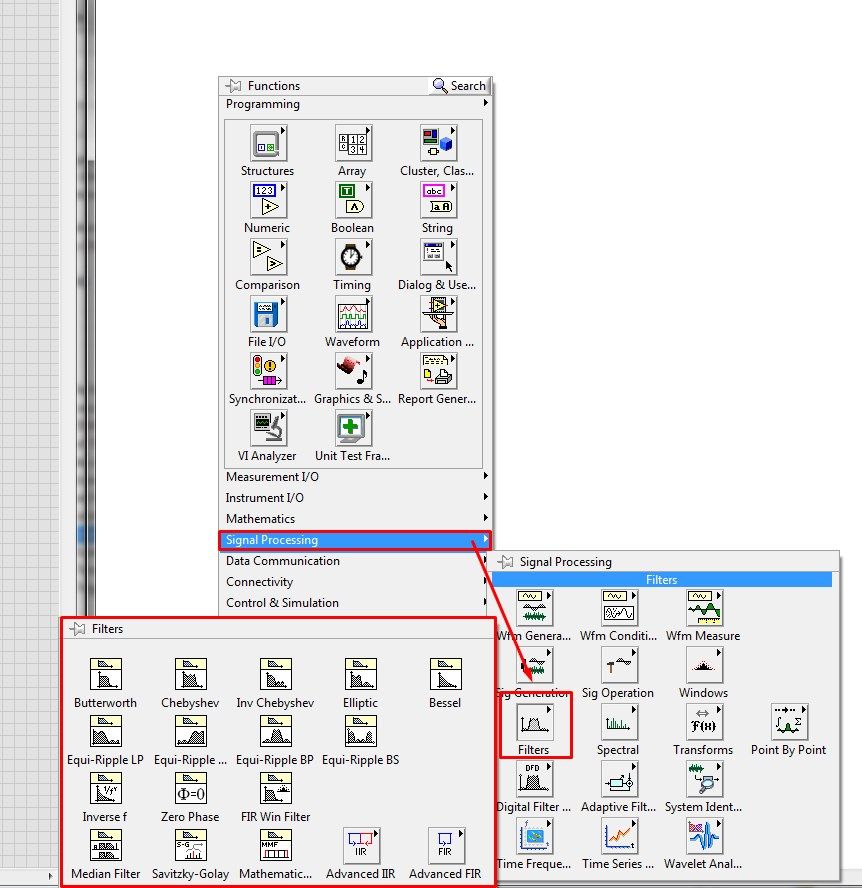
4. After reviewing the data, you will need to apply a filter. You can find the filter functions in the range of Signal Processing.
Please let me know if you have any questions on this subject.
Kind regards
-
How to extract the signal from the waveform of my power level designated?
Hi all
How can I extract the signal of the waveform accroding to the power level? I read the Trigger & Gate .vi, but this vi retrieves the signal duration. I want to extract the signal depending on the power level.
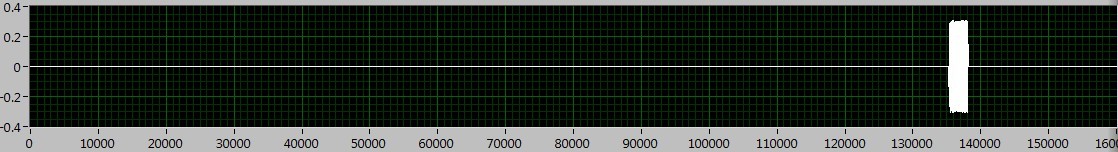
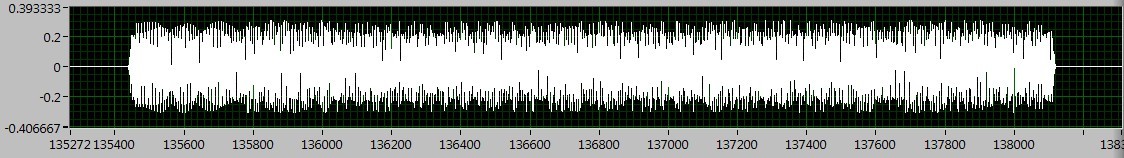
As shown in the following figures, the signal I want to deal with is between 130000 to 140000, if I Zoom, I can see the useful signal is between 135400 to 138200. The question is how to extract the signal in the area?
I tried the sub_NoiseEst_And_Chop_Shell.vi in the example of Packet_based_link also, but this Subvi seems to be a bit slow. Can someone give me the best advice? Thanks in advance!
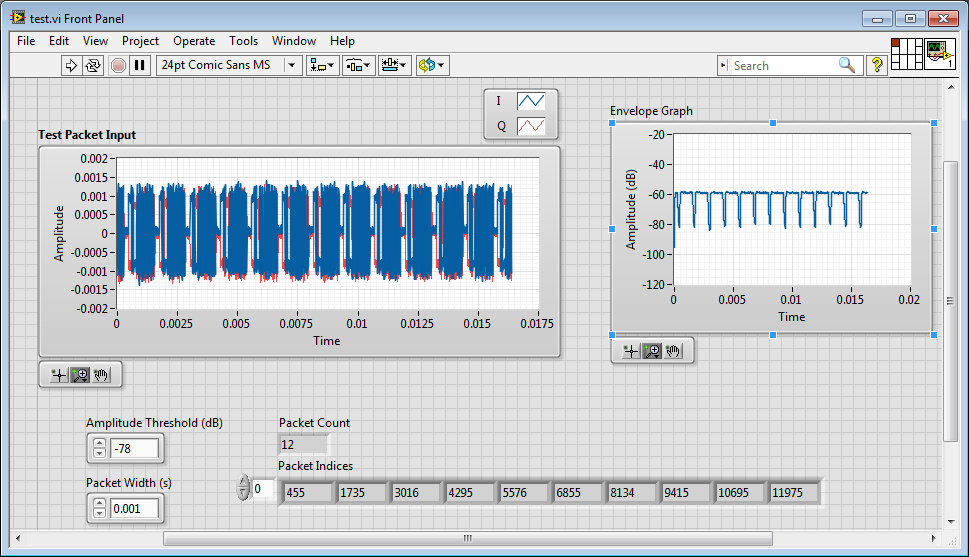
I'm working on something similar, but have not had time to fully develop.
My idea was to use an envelope detector (low pass filter) and then use a detection of energy VI on the envelope.
Here is where I left
-
low Harmonic frequencies in the signal strength
Hi all
I try to know what are the causes of noise in my signal, whether it's a faulty hardware or my lack of knowledge.
The system that I'm actually consist of two engines not to not (parker HV232) that provide the uprising due to frost harmonic + pitch motion with phase shift of 90 degrees (a kind of movement of fish tail beat). I have a load cell 3 - axes attached to the shaft of the motor, pitch, and it measures up, drag and torque on a plateau which oscillates in the tunnel water (oscillation is provided by these two Steps). Tunnel to provide the incoming stream.
Signals of strength are captured through SG-23 + PXI-6221 daq card, I put the gain on the last of them to +/-200 mV for better resolution.
When the engines are turned off, the noise level on the static signal is the threshold of resolution, and nothing strange is not shown in the signal, and its ghosts.
The problems begin when I initialize the motion on the steppers, FFT of the watch signal of the low frequency spikes that are exact multiplies the frequency of oscillation, I have attached a PDF for example.
Disengage amplifier/filter which was suggested by manufacturing, and suspect I have observed could be due to this I'm not sure at 100%. The VI I use filter band-pass data in the 0.2 to 6 Hz, but somehow I can still see noise beyond 6 Hz.
I was wandering perhaps someone has experience with similar issues and can suggest a solution on how to get rid of these harmonics.
Thanks in advance
I'm not an expert in the dynamics of the tunnel, but from what you say, it looks like they can't be noise but components generated due to the rotation of a mechanical Assembly. Normally people refer to these harmonics in the form of 'order', which means that they are a multiple of the frequency of rotation.
So maybe it's the attacker
1. check by an expert (the one that includes the mechanical system that you are using) that to the point where you measure the force will not get the components of the order.
2. understand what exactly is the measurand. What exactly do you want to do with the measured signal (RMS, FFT etc..) Then you will be able to figureout if components of the order may affect your measurement.
Oleks wrote:
Disengage amplifier/filter which was suggested by manufacturing, and suspect I have observed could be due to this I'm not sure at 100%. The VI I use filter band-pass data in the 0.2 to 6 Hz, but somehow I can still see noise beyond 6 Hz.
During filtration, the attenuation in the band determines how fast the signals will be thinning of the hard shoulder.
-
Hi all
This should be a pretty simple question, but I can't seem to find the answer online and currently do not have the functionality to test this:
I'm using LabVIEW 8.5 and have a VI that imports data from sensor through the DAQ Assistant. In the configuration tab, there is a range of signal input. What happens if my sensor exceeds this range? I get a warning? The default value is the maximum (or minimum)? I was interested in writing a code to display an error that I approach the limits of this range, but did not know if I also need to include code to display an error if the scope is exceeded as well.
Thanks for the help,
Tristan
Hello, Tristan,.
The behavior depends on the selected range and the device you are using.
If you are using a device with a single input range is valid, we will use this range, even if you set a smaller minimum and maximum in the DAQ Assistant. So, if your device only supports ±10V and you set the range to ±8V, you will still continue to get valid data after your top sensor 8V until what you approach 10V. When you reach the limit of the extent of your device, the output will be 'rail', and simply return the maximum value until the signal is less than the maximum value again.
Note: A device that is nominally ±10V usually has a go-around (such as ±10.2V) which are usually specced in the manual.
However, if you use a device with several ranges of entry then things become more complex.
NOR-DAQmx player will choose the smallest range that entirely covers the interval you choose. For example, suppose that your device supports the following input range: ±0.2V, ±1, ±5V, ±10V and you choose 0V - 3V as the range in the DAQ assistant. The NOR-DAQmx driver will focus on the input range and the list of the entry lines that your hardware supports and choose the smallest encompassing the entire range that you set. This would be the ±5V, because this is the only beach that contains up to 3V. Thus, all between ±5V input signal is returned and none outside this range will be 'rail' to the maximum or minimum value.
We do this because using small beaches make more efficient use of the resolution of the ADC. So, we try to use the most effective range based on what you ask without picking up a range that will make you miss data.
Let me know if I can clarify it more.
-
Hello everyone. I'm trying to filter a signal using filter Butterworth that VI included with LabView. The problem I have is that it is a signal in time real get sampled at a certain speed with a certain block of samples. The filter seems to do its job properly for all samples in the middle of the block, but it doesn't for the first part.
I have attached two picture to show the difference with and without the filter. It is a sine wave.
I think that the problem comes from the Convolution of the input signal filter and distort the signal in this way. I was hoping people can say this is the problem and help me to find a way to a solution.
I can show you my code as well, but to me, that this is a general problem with filtering, rather than my code. If you think I'm wrong please tell me.
David.
-
Filter the data to WAV butterworth - problem
Hello!!
I have LabVIEW 2013
I m new in matlab and I have the following problem:
I want to filter voice and data to WAV file with block Butterworth Filter.vi. I don't know how to load the signal with his reading file Simple.vi, I know how to get the info on file with the Info.vi file, and I know that I can display data of waveform with waveform chart/graph. But I do not know how to properly set up butterworth filter in my diet, or better said how to properly bring data on this subject. When I m try to display data filtered with waveform graph I get only flat line.
I already checked OR examples (IIR Filter Design, IIR filter using option Specs, IIF assigned and response, IIR filter design). But after that, I felt even more stupid and lost.
In fact, depends on number of channels (mono/stereo) - should I separate?
Do I have to use a loop?
Second question - how many changes I have to do when I want to have a filtering in real time with filter.vi to butterworth (for example - to obtain data from the microphone)
Thank you very much!
Hi TOM 5 times.
you set a low pass of the 1st order, so he dampens high frequencies with only 20 dB/decade. It will NOT erase anything greater than 10 Hz, it will be just wet it!
You must use an order higher for your low-pass filter to effectively cancel higher frequencies!
-
Determine the position of a part of the signal on a graph
Hi all
I have a problem. I determine the position of a part of the signal on a chart. So, I have to determine the maximum value of the part (this is not a problem).
Signal a lot of noise. I did some filtration but still signal have noise. Concerning this, filter change signal, two later when I take one measure, there is a possibility that this is not true.
Anyone has idea how to determine the position of a part of a signal automatically, for the various signals (similar).
There are photos attached where is what belongs to an interest in a signal. There is a VI where is an a test signal.
Thank you
Hello
From the screenshot, I understand that you only interested in the local maximum of the signal.
There is a VI that detects peaks when you specify a certaing point and this point maximum width.
Later, it's just a matter of setting the value of local maximum of you. Basically, you'll have to point once again got 1 d table than VI.
I enclose a VI that can be a good starting point for your application.
Best regards
Ion R.
-
Which is the correct Point on the waveform of the Signal?
Hello
Please see attached image.
I have labview software which is to measure the load of a load cell output. According to me, that the reading is accurate, except with the software Labview, we get up to 50 lbs less when we read it with the oscilloscope technician.
What I see is that the technician measure the amplitude of the signal at the top and when there is little noise reading of the oscilloscope is even higher because the placement of the cursor is higher.
I see that LabView is more or less because when we place the cursor oscilloscope in the middle of the measurement at the center of the signal signal not top it it reads then the same my labview program. I also have a low bypass filter in labview software.
Which are the correct measure points waiting for oscilloscope to measure? in the picture as an attachment the white slider is positioned correctly, or is the correct red cursor?
It's just an example of image zoom to see better.
Thanks to you all.
JCollado
If I understand you correctly the width of the track to noculars represents 50 lbs of difference as? If you think about how works a noculars, then the center of the line displayed is probably the most accurate. The line width is determined by a few things, noise superimposed on the signal being a. So, with a noise filtering in your LabVIEW its 'width of the line"program will be closer / diluent, as it will have removed some of the noise component. Place the cursor in the middle of the path displayed in the noculars is an approximation of this, sort of looking for the point where the noise is "average" out 1/2 top / in-1/2 under the cursor, which is about the signal of 'data '. It is difficult to make measurements of accuracy of a noisy signal with a noculars for this reason, where do you put the trace? If you were to remove the filter program LP you would probably get the equivalent of the "wide trace flag" which would be a series of values that plotted close the underlying signal, but with high and low variations equivalent to the width of the track.
So after all this verbiage, I would read the trace Center, perform an average of noise 'eyeball '.
-
How to filter the modules of the version of TB?
My version of TB: 31.1.2 on Win7
The Add-ons Manager has a section called "Featured addons". I think that, Hey they must be cool if they are featured! I try "Contacts Sidebar" only to discover that it was updated in 2007 and does not support recent versions. How to filter the Add-ons to display only those compatible with my version of TB?
All the people who still use older computers from apple. This is the last version that will run on them.
-
Mobile Firefox is unable to filter the results of google by date
I have mobile Firefox installed on my Nexus 4 side by side with Google Chrome browser. When I do a search on google in mobile Firefox I can't filter results by date, but I can't in Google Chrome browser.
What Miss me?
The function to filter the results of google by date is missing from the mobile firefox browser?
Thank you
It seems to be part of Google's strategy to dominate the world to retain some features of other browsers. I don't know if there is a solution to force search tools to display in mobile Firefox, but you can try the strategy adopted by another user faced with a deficit of function and use the fake extension to lie to the sites on which browser you use.
See: Google local search does the same in Firefox as in Chrome. How to repair?
-
App to determine the "Signal strength" airport
I have 1 Airport Extreme Base Station (5th generation) in my house.
I have a 2nd Airport Extreme Base Station (also 5th generation) in a separate building in my back yard.
The 2nd airport is connected to the airport 1 via an Ethernet Cable that runs through an underground conduit.
I'm sure I used to have an App on my iPhone that would check the 'intensity of the airport Signal' as opposed to the 'speed '.
Maybe it was on my old iPhone 4S & it was never transferred to the iPhone 6 Plus?
Whatever it is, I can't seem to find the app anywhere.
Does anyone have an idea on what this app can have been called or who made it?
Any help would be greatly appreciated.
iOS does not allow access to the wifi signal measures last I checked...
However, I can recommend the app Netspot (PC/Mac friendly) to measure the signal wireless throughout your home.
Maybe you are looking for
-
Hello I have a "small" problem. It all started with the following BSOD: 0x00009C (0x8922c94c, 0x00000000, 0x00000000, 0x00000000) I managed to find the touchpad is defective. I unplugged, problem solved. It was working fine until I noticed that a sin
-
I would access a Web of LV page and enter a string in a bar of 'finding '. Once the chain has been formed, I am interested to press a button on the Web page, which then displays the results of the research. I can take the results and pull them in LV,
-
Hi all Recently, I had some problems with my hpe-140sc. Its been crashing all the time, hang up the freezing and so on... Very unstable, at the same time, then a few hours of smooth functioning. I just thought it was a kind og software problem and I'
-
Cannot communicate with the first DNS Server (169.126.63.1)
HelloI have recently had problems with my internet connection and therefore cannot get on the internet at my place when it used very well. I have a wired connection usually, but tried to install a router but now even the wired connection doesn't work
-
The pc is a hp pavilion a706n and windows vista ultimate.