data is plotted on the graph of absolute time delay
Hi all
I'm plot data on a graph of absolute time and I find 2 hours difference between the data displayed by the debugger (left) and data on the graph (X - SCALE AUTO).
The time saved in ptTime, was acquired by using the function 'time' and the PC has Amsterdam, Berlin, Rome as time zone.
Here, under a screen shot that implemented the code, the debugger and the result.
The debugger is also showing the version in good time!
Can anyone suggest me how to process data in order to have the same result on the debugger window and on the graph?
A big thank you and best regards
Sergio
Question: in the CVI debugger show you, the time_t variable appears as a double, while its definition in 'time.h' is ' typedef unsigned int time_t; "so I am a little confused.
Response: I did something nonsense in this screenshot: I took a variable of type double (it happened to be a UIDateTime, actually) and configured the debugger to format as if it were a time_t variable. The formatted values that the debugger shows me, therefore, are not valid, of course. But I just wanted to show the time_t format, because it corresponds to what you have in your screenshot, and I was already suspicious that you use time_t variable to pass to the curve.
Furthermore, if you are not familiar with the way in which you can change the formatting in the debugger, this is how you do it:
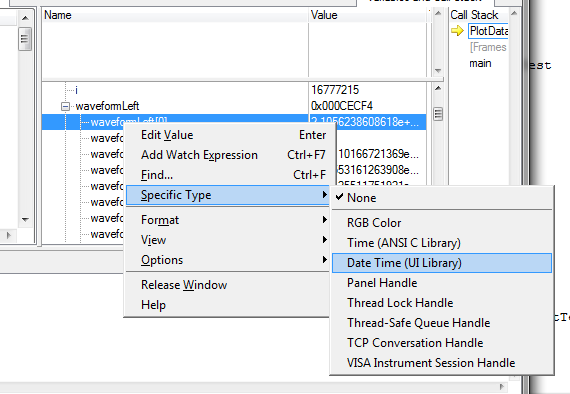
Usually, the debugger can automatically pick the best format to use, based on the data type of the variable (for example, with variables of time_t). But in this case, what the debugger calls a variable "Date Time" is all just a double. The debugger cannot assume that you want to display all your double variables as a 'Date Time', and so you need to replace yourself.
Question: I was not able to find UIDateTime using the ICB type, this is the value returned by GetCurrentDateTime(double *)?
Response: There is really no such thing as a type of data "UIDateTime". I've been a bit remiss with my terminology. Unfortunately, when you're dealing with dates and hours, there are several possible representations of these quantities in the world of C, and it is important that you use the correct the intended variant you use for. In this case, the chart controls expect that you pass the time format used by the library of user interface, that is, one that is returned by the GetCurrentDateTime or MakeDateTime functions. The underlying C for this representation of the time data type is simply twice, and so it is not a good name to refer to it. That is why I used UIDateTime, but I should have been clearer than that.
Question: Y at - it a function to convert time_t values UIDateTime values
Response: Yes. You can use the functions of the programmer's Toolbox following two, in exactly this order:
CVIAbsoluteTimeFromCVIANSITime (time_t ansiTime, CVIAbsoluteTime * absTime);
CVIAbsoluteTimeToCVIUILTime (CVIAbsoluteTime absTime, double * uilTime);
Tags: NI Software
Similar Questions
-
I want my table to have a constant slope already mapped out before she continues start tracing data in real-time... so that I can compare my new data point to point with the ideal slope that I already have in the background
Hi raza,.
as I said: it is not a problem to have two plots on a graph. But you need to use a graphic instead of a chart!
Like this:
have a constant ground created before the loop and a variable field created in the loop!
-
How can I get the data view to display the same amount of time I save?
I use the Sound and Vibration Measurement Suite. In the data view, I display a graph of time, the power spectrum, the Color Map and the waterfall. I am also showing strength in numbers group for several bands and doing cutting-edge research. I record 100 ms of the transient wave. In the data view, why the temporal plots show several seconds of data? What determines how much time will appear in the data view? More important, the power spectrum reflects the power for the entire of several seconds of data displayed? Same question for power in the values of band and cutting-edge research. I want to just this data displayed for 100 ms of the wave that I record. So, how can I get the data displayed (waveforms) and power numbers come only 100 ms of the recorded wave?
Finally, what is the best way to make account concisely the recorded data? By slide numbers on the Documentation tab is not concise, because it comes with graphics, etc.. I tried save as ASCII/LVM, but I get a bunch of stuff intermiated I don't care. Help?
Hi TimRsandiego,
SignalExpress is programmed to display graphs with default scales based on the type of action, it's reading. These scales and settings can be changed by right-clicking on the graph, and then select Properties.
If you are interested to learn more about how to use SignalExpress, I would recommend checking out some demonstrations/tutorials on NI.com. You can find some of these demos at the following location:
Let me know if you have any other questions.
Kind regards
-
How Downgrade of El Capitan in Yosemite without data loss and without the help of a Time Machine?
I, are looking for an answer to this question, but couldn't find one. If there is an and missed it, please tell me and I will look happily on it. I want to do it without the help of a Time Machine, because I used it at the time of Yosemite. And I discovered that you can use a cable USB or SD to come down, but how do you do this without losing all my data?
You must save, erase the drive, install Yosemite, restore your backup of the data
-
Move the data to the left and to the right on the graph in real time
I have a 1 d table X and Y Bay 1 d of the XY graph.
I want to move the chart along the x axis. I not want to act as if I'm grabbing the plotted values and moving them.
I thought that would be simpler to add a slider value to each of the X 1 d elements of the array. The value keeps adding when I move the cursor is positive and subtracting when the cursor is negative. I want the graphic to move left or right when the cursor moves.
Any ideas?
Thank you!
Michael,
Here's what I found works. It is much simpler than what you suggested, but there may be a few errors that can result from programming immproper. I'm not sure.
-
lighting of 3 leds using the sequence meal and time delay VI express?
run the vi and a LED light, 1 second later, the 2nd led should light, 2 seconds later the 3rd led must light up then everything must stay on for 3 seconds, I need to use a flat sequence with 3 images and express time in each image
Tips or advice would be grateful im a little new to this iv not been mess autour with her and to this day no luck
Nevermind I got it
-
Regions must display on the same position using time delay
Hi all
I use APEX 4.0.2
I have a page with 2 reports and 3 regions of the chart. Two reports are placed on the left on the page. Graphics one by a parallel with reports (right) need to display on the page. Is there anyway to show the cards one by one, using a few delay time? Is it possible to do like that in APEX?
Please help me on this...
Thank you
Lacombe
Try this in your DA
function x(p) { $("#" + p).show(); setTimeout( function(){ $("#" + p).fadeOut( 3000 , function() { switch( p ) { case "chart_one": { x("chart_two"); break; } case "chart_two": { x("chart_three"); break; } case "chart_three": { x("chart_one"); break; } } } ); } , 6000 ); } $("#chart_one").hide(); $("#chart_two").hide(); $("#chart_three").hide(); x("chart_one"); -
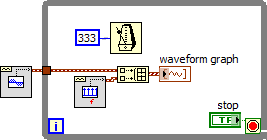
dispplaying data on the graph of waveform inside/outside while loop
I create a vi using the random number generator, entering the number in the function(express>>arithmateic>>maths>>trig>>sine) fishing and connect the output of the function sine waveforms. Table of waveform show no problem. If I replace the with graphic waveform table, I get an error that the source type is differenct type of sink. I then put waveform chart outside loop everything hoping that tunnel would act as a table, but still I get the same error. I then put build table palette between all border and loop waveform graph which is placed outside the while loop. I get no error, but no data is displayed on the graph of a waveform. Theoretically, if I press stop I would see a distorted sine wave on the waveform graph, but this doesn't seem to be the case. I am wondering how to view data on the graph of a waveform in such cases!
Thank you in advance for reading and help!
See you soon
First of all, you can take a part of the basis of LabVIEW tutorials.
Since you need to work with a chart and it is the preferred method to display data point by point, I don't know why you try to use a chart. In any case, you cannot use all simply a table of generation because that would be just the result of the last iteration and your graph indicates it is a single point. If you activate autoindexing, then you get all the values, but not before the end of the loop. If you were to use a shift register and the build dashboard, you might place the graphic inside the loop, but then you would face performance issues that the table would grow uncontrollably.
-
original title: why the time & date that sits on the computer change every time I have Vista premium edition reboot.using
Larson
Larson
Make sure you set your time in the right time zone.
Right-click in the time at the bottom right > set date/time > time zoneIf this isn't the problem, then...
You probably need a rew CMOS battery.
How to replace the CMOS battery
http://www.computerhope.com/issues/ch000239.htmCMOS battery
http://murfsgarage.cybertechhelp.com/CMOS.htmATTENTION: while the battery itself is very good cheap, be careful if you decide to replace yourself.
It is better to have another friend who knows also computer be with you together.The safest way is to pay the Department store. But it will cost you.
Your call. -
Enterloan - ready of absolute time not reflected in ADE
Hello
I have a working server ACS4 and can 'buy' the books of the ACS4 server without any problems.
I want also to ready publications for a period of time, that is to say 7 days. If I use 'enterorder' and adjust the UAT 'use the absolute time', it works very well and ADE count the days/seconds to book expires. But it goes in the purchased file on ADE. Ideally, I want the loan borrowed folder items!
So I created new loans Distributor rights for my titles, put the transaction for enterloan and the LAT "loan absolute time" download works but the book never expires! Can I return the loan, but unlike purchases no banner timeout is displayed. I know that the request is valid time because I tried to lend a book with a LAT in the past and got the following
"" < error xmlns = "http://ns.adobe.com/adept" data = "# $1259921764 E_ADEPT_EXPIRATION_IN_PAST http://URL:8080/fulfillment/URLLink.acsm $lat Fri Dec 20, 2004% % 2010: 20GMT 16:04 % 202009" / >
Total demand is less than minius URL and auth
I could just keep using enterorder, but I understaind is a slight reduction in the transaction costs for the loans, and I don't want to miss that!
Any help appreicated.Mike
If you do this with the same user, so be sure that the licenses are stored in your database, and if the license in your database is more permissive than resovled permissions then the existing license is used, and no new license is generated. To test this active ADE to a new anonymous user (this make sure that you don't have any existing licenses in your db correspondent), then try to 'borrow' the book.
-
Denote absolute time and absolute time calculations
We have Oracle database 11g in our production environment on RHEL 5.8 Virtual machine using VMware. The database version is 11.2.0.3.0.
I have a certain scenario here, I want the code of the logic of a trouble ticket solution. The working hours for problems resolution ticket is 8 am-8 pm and resolution time is 4 hours. Now if a ticket will be logged at 18:30, his expected resolution time should be 10:30 the next day (1.30 hours of standby and 2,30 hrs the next day). I am not able to understand as below:
- How to write a subtraction of absolute time from 20:00 to 18:30 (18:30 can be a DB column so it is fine). The main concern here is how represent absolute time of 20:00.
- Subsequently, also how to add time of 08:00 the next day
I hope that I was able to explain the application of absolute time representation and also calculations with it.
Please get back with the answer to my query.
Concerning
with inp as
(select sysdate log_time to double
Union all select trunc (sysdate) + numtodsinterval (6.5, 'hour') of double
Union all select trunc (sysdate) + numtodsinterval (18.5, 'hour') of double
)
log_time Select to_char (log_time, "dd-mm-yyyy hh24")
to_char (case
When log_time - trunc (log_time)< 8="" 24 ="" then="" trunc(="" log_time="" )="" +="" (="" 8="" 24="" +="" 4="" 24="">
When log_time - trunc (log_time) > 20 / 24 then trunc (log_time) + (1 + 8 / 24 + 4 / 24)
When log_time - trunc (log_time)< 20="" 24="" -="" 4="" 24="" then="" log_time="" +="" 4="">
of another trunc (log_time) + (1 + 8 / 24 + 4 / 24 + (log_time - trunc (log_time) - 20 / 24))
end, "dd-mm-yyyy hh24") expected_resolution_time
the NPI
-
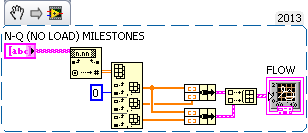
I'm reading the data (speed rate and flow) of a table and it plot in a graph.
I'm reading the data (speed rate and flow) of a table and it plot in a graph. I need to draw two values of l/min (speed) to the same speed. How can I do using a loop for?
There is no need actually to use a loop FOR this. And using a graphic waveform isn't the type of field for this, for a waveform you a (Start), the dT T0 (greatness not) and table D (Data), this isn't what you want unless you know precisely the measure will take place according to an orderly disposal, you'd want a xy chart so that you can trace the measures where they occur in the axes X and Y of preference.
-
Graph XY plotting the question with the data of repeting inside the loop
Hello
I have this problem I'm having with my plots. Maybe there is a better way to do it.
I have a set of data that I use inside a loop. I want the loop to keep reusing the same data. The reason I do that is because I want to continuously stream that loop exactly like that of my data file and plot it and do something different with it. My problem is that the XY graph does not draw correctly. I wonder if someone can help me to get field work and alo get data through the graph XY waveform.
The files are attached. Test.VI is the main vi
Note attachments removed by the request of the user of the admin-
-
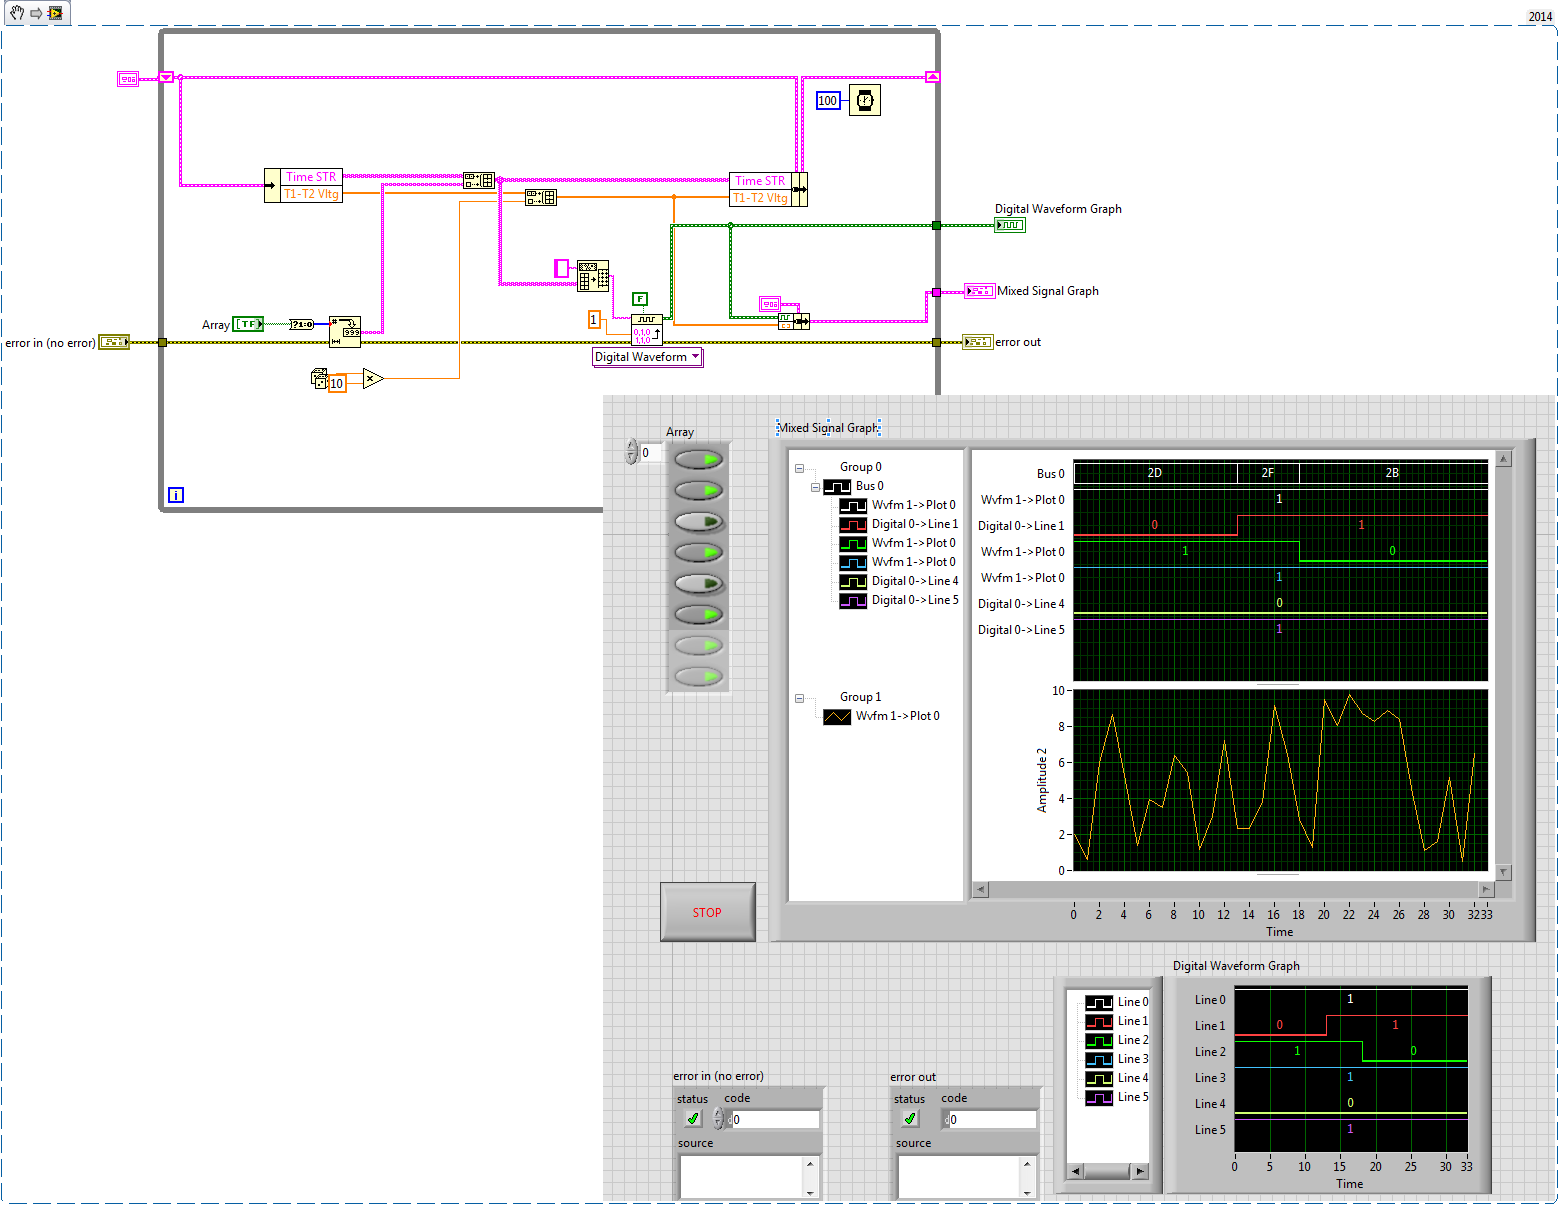
Mixed signal graph - data digital unable to see on the graph
Hello
I'm tracing analog and digital data on the graph of mixed signals. I'm not able to see numbers on the graph, but when I export data to excel it shows all digital plots also. According to me, Miss me some settings.
Please check attached VI for reference and let me know if anyone knows the solution
Kind regards
Jaysha
I changed the frequency of sampling to '1 '.
-
toggle is plotted on a graph when the application is running
Hello
I'm trying to figure out how to make a graph that allows the user to select which elements are drawn when the application runs. I want all data to appear on the same graph with the same x and axis of ordinates and maybe some checked boxes or something to allow easily what items are displayed.
Thank you
Gary
1... don't use two nodes in separate property for the PLOT VISIBLE and Act implementation CHART. If you do that, you don't know who runs first, - they are independent. Use a single property node (stretch it to include two properties). The top property must be ACTPLOT, 2nd one, be VISIBLE TRACE. In this way, it is guaranteed to run in the order you need.
2 you are the cluster of box check ONCE at the beginning of the program of reading and using the same value each time. You want to read the cluster when the CHANGE occurs, EVENT that is, in the case of the EVENT. You can read the terminal, or read the NEW VALUE property for the event, so be it is OK. But you have to read the new value, not the old one.
3... you also read your buttons ONCE at the beginning of the program, and re - trace the same value whenever you draw. You need to know when you need to draw and THEN read them and lead the chart.
4... If you set the timeout to, say, 100 mSec, in the TIMEOUT case, read the buttons and drive the graph, then you will have a living picture that updates approximately every 100 milliseconds. Implement #1 and #2, and you can turn on and outside plots.
I say "Roughly" because of the way the timeout works - if you wait 99 mSec and then click on a checkbox, the wins Manager check box and the timer 100mSec STARTS OVER when you get to the next iteration.
If you want the table to day exactly every 100 msec and then use time separate loop, with a WAIT TIL NEXT MSEC MULTIPLE. Do the waiting, read buttons, drive chart and repeat. A separate loop will not be disturbed by events in the loop of the user interface.
Maybe you are looking for
-
Uninstalling Time Capsule airport
Hello... I installed my Airport Time Capsule... .but I plugged on the modem with the bad port... the LAN port instead of the WAN port and I also didn t choose to use the option of passoword for guests... Does anyone know how to UNINTALL the airport t
-
I had a W500 WIndows 7 that turns off, usually unexpectedly while you sleep, but sometimes too, so on. Disable it happens as if the power is lost (for example, the battery/cord are torn out). After a turn off like that, I sometimes need to reconnect
-
BlackBerry JDE Build Error - new installation - Hello World
I'm new to the Blackberry development. I was able to get Eclipse works without any problems whatsoever and I built a few sample programs and one of my own. However, it seems to me that RIM Blackberry JDE has some nice features for the visualization
-
How can I remove a hyperlink to a PDF file in the drop of hyperlinks.
Muse, I created a hyperlink to a PDF file on my computer that has downloaded the PDF on my server.I have now disconnected the link and no longer wish to use the PDF file.However, the link to the PDF document remains an option in the drop of hyperlink
-
error of pens cleaner Adobe creative cloud
List of products installed on this computer1 adobe Creative Cloud Desktop2. clean all.Please enter the number of the option of the product to remove; Enter (q) to exit... > > 2Are you sure you want to clean all the affected products and associated fi