Debugging of Modbus slave on tatger in real time
Hello!
I have problems when you debug an application that contains a slave modbus on a real-time target.
The connection is lost when I run the program.
Change the port from 502 (default value) to other values seems to solve the problem.
LabVIEW uses the same port to connect to the target RT?
THA same problem notified here, but I received no response:
http://forums.NI.com/T5/LabVIEW/NI-Modbus-TCP-slave-on-LabVIEW-RT/m-p/1565842#M575497
Kind regards
Marco
p.s., We use the libray modbus labview (http://zone.ni.com/devzone/cda/epd/p/id/4756)
Hi Marco,.
as far as I know the port 502 is used only by the Modbus Slave Servers (Ethernet) i/o to connect with e/s Modbus master servers so you should not see any conflict using this port.
(no other LabVIEW service is using this port).
You can check if you have deployed Modbus Slave (Ethernet) i/o duplicate servers. Modbus Slave (Ethernet) i/o duplicate servers cause errors when these I/O servers listen on port 502.
Hope this helps
Clara
Tags: NI Software
Similar Questions
-
Hello
I have a compact rio, which has a 4 way frame this chassis is the three modules of ni9234, they are related using FPGAs for application in real time, then using shared variables in the low-speed loop associated with a slave modbus to communicate with the domain controllers, the nor 9234 accelerometers linked to them with option ac coupled iepe on c modules , my problem is the real-time application seems to work well even when power loss occurs it restarts without problem and the fpga written hard disk portable bin files very well, but without an accelerometer connected I get readings of low noise as soon as I connect an accelerometer to one of the outputs 10 it just goes to a fixed number (0.03125) as soon as you unplug it again He returned to readout noise, I ran a scan on the modules and get only a spike when I connect or disconnect the accelerometer, I tested voltage at the pins on the module and I get 22 volts CC which makes it more likely that the material is not the problem, but software is perhaps the cause to hang up, I join the project and files for your perusal. I also realized a new project which, in mode directly linked scan has the module entry in the shared variable and the scenerio even once again. Help would be appretiated.
Thank you very much
Jason
Whren using waveform with the 9234 acquisition, we recommend the following FPGA and RT model.
http://sine.NI.com/NIPs/CDs/view/p/lang/en/NID/209114
It can be extended as a datalogger with:
http://zone.NI.com/DevZone/CDA/EPD/p/ID/6388
or using shared variables combined with the analytical engine
http://zone.NI.com/DevZone/CDA/tut/p/ID/9851
The FPGA in all this, as well as the framework of RT have used successfully by 1000s of users. I recommend giving these a try.
-
Debugging on a real-time target - deployment issues
Dear community,
After RT my 9651 sbRIO module wiring code, I do tests to check the intended functionality. For this I start my main VI who deploys the code on my SoM and I can happily move forward with my debugging session.
Sometimes, however, while in the process of deployment, I get an error saying:
[VI - name] .vi loaded with errors on the target and was closed
When I open the VI it has no errors and the VI should work a fine might think.
My solution was so far of the VI, just open move the wires and terminals round, re - save the VI and this is the deployment works.
This trick worked for a while, because deployment error ca occur arbitrarily on different VI making debugging quite cumbersome.
I then went ahead and just run the wrong VI in RT mode by moving terminals and structures around to get the VI runs in mode debugging, but it is very time consuming.
Given that 3 people working on this project and we use git-subversioning I also do not want to "touch" each time just screws for the debugging session will without actually modifying the feature.
Has anyone encountered a similar experience or perhaps found a magical setting to avoid this subject a lot of time?
Hello
If solutions already present Spex does not do the trick for you, clearing the cache of the compiled object can help.
For more information, take a look at the following link:
Why my screws are loaded with errors when it is deployed at my target in real time? -National Instruments
http://digital.NI.com/public.nsf/allkb/7F6502FF0560FA9086257EB3005B13BAConcerning
Alex
-
Stop the Modbus slave server works if have the request to address 0 frame (from
Stop the Modbus slave server works if have the request at the address 0 (broadcast massage) frame
Hi alexart,
How do you define the address 0? When I put my server Modbus slave address 0 in the communication parameters, it is by default to 1, so I am not able to change the address 0.
In addition, the server does not work? What is happening and how do you know? Is there an error code, or what else is happening?
Kind regards
Stephen S.
-
Real-time execution trace toolkit to optimize the Labwindows/CVI code
Hello
I am trying to optimize a code in real-time in LabWindows/CVI by minimizing the time of each section of the code is taking and find bottlenecks in the code. I check this time using the real-time execution trace toolkit.
However, I just found it seems to be a constant error when you use the tool of real-time execution trace.
When I put the traceviewer 'start' and 'stop' right after the other, I get around shift schedule 9us. It seems that the CPU will in some "idle" after the start of the trace mode, or maybe it's the time of communication or something.
I'd appreciate it if someone could give me an idea of why this is happening. The time of real-time application window is very limited and I'm trying to minimize the time as much as possible. Even the United States 9 error is difficult to resell.
I used the following code:
TraceConfigure (1, 1, 0, 25000, NULL);

TraceStart ();

TraceStopAndSend (HOST_ADDRESS);
and there is a photo in the toolkit of real-time execution trace.
Thank you.
Generally, you might be better off picking off the clock at the beginning and end of what you want to track. RTETT my introduce overhead that becomes difficult to quantify... Which is what you probably already see. The debug mode will also implement a ton of overhead. Then... Destemming of the clock in release mode will probably give you you the best estimate.
-
I have 2 questions related to LabVIEW Real-time. I'm using LabVIEW 2010 Service Pack 1. We have a PXI-8186 controller running the embedded real-time.
(1) I have my software written to communicate using TCP/IP. The real time software runs the listener 'TCP create' then the 'wait on TCP listener"to look for the connections of the computer. This works well in the LabVIEW project. I then build the executable and deploy it in the system in real time, set up to run during startup. I put the target name to be my program name "Test program.rtexe" rather than "startup.rtexe". I don't know if that makes a difference. I saw the other files in the startup folder of the system in real time that have been named something else. My questions are: the name possible no matter what name we want and the system in real time all programs contained in the startup folder is running or is there another method to specify the programs to be executed?
(2) is there a way to monitor or to see what programs are running on the system in real time? As the the Task Manager on a windows system. The reason I ask, is that after I restart the PXI system and without using the program of project, I can't connect to my test program running on the system in real time. I don't know if the software is running on the system in real time, is it established that the network interface which it was assumed, etc. to determine why I can not connect with him. Any help on various methods to determine if the software actually runs would be useful.
Thanks for any help you can give.
Bill
Finally found the problem.
It would seem that, at least in the 2 controllers shipped we have there, controllers have a flag in the BIOS that allows you to disable the file to begin execution on the system in real time. Once I put the flag on the 'NO', everything works. The flag is named:
'Disable the boot VI' tab 'LabVIEW RT"in the BIOS.
It is a good option if the boot VI is damaged or was not debugged prior to deployment.
-
File not found when you try to call a dll on LabVIEW Real Time machine
I have a dll called "DLLRTTEST" that I wrote, and claim successfully on my host. Now, I try to call this dll from a vi that is on my computer in real time. Currently, I get a message 'error 7 occurred at the crux of library DLLRTTEST.vi. call function' when running
In the attached screenshot, I try to ensure that the vi that I am running is indeed on the system in real time. I then use a 'check if file or folder Exists.vi' to confirm that the dll that I'm about to call exists on the system in real time as well. However, I always get an error "error 7 file not found" from the node call library feature.
Any help is appreciated.
Thanks again for all the responses. As I said earlier, I had already met and solved the problem identified in the link provided by Nathand. I had to go down to Visual Studio 2008 to go beyond this particular error, after which the app of auditor of the dll in real-time reported my dll needs to run successfully.
I just got the phone with Jack in charge NEITHER well, and it turns out that I simply had to compile my dll in release mode. Decommissioning of VS 2008 I got the correct version of dll (msvcr90.dll), but since I am compiling in debug mode, I found myself using msvcr90d.dll (d for debug) who doesn't have my computer in real time.
-
Real-time application does not work; source code works very well
The short version is I'm programming a cRIO and apparently the RT code isn't running after you deploy, and I can't understand why. It is further complicated as I do all this remote and I don't have direct access to the unit since I am 500 miles away. I work through a couple of other guys who know some LabVIEW, but neither is working on the site so that they explicitly trip there whenever I have a bright idea.
I was there a few weeks ago. During this time, I created a code simple cRIO, since I'm new to the cRIO, allowing the user to move a control and change a chart. It worked fine, but I must stress that it did not have a FPGA component. After that, I worked on the actual code, which reads some sensors, displays the results on a user interface and stores the results. Did FPGA. I used it in the LabVIEW environment and it worked fine, but I ran out of time before I could finish a release build and deploy the RT as a compiled application. I sent them the version later, my contact deployed but had the network stream errors during execution of the user interface.
After hours to address network problems and sending over debug versions, I tried to create a log on RT level so I could see what was going on. The journal is not yet open, even if it is the first command in the code. I have pores through the forums and found http://forums.ni.com/t5/LabVIEW/cRIO-Troubleshooting-creation-and-deployment-of-startup/td-p/1956475... which took a new direction.
I had my contact use the RT debug console and when it pulls up to the front of the RT, it shows an arrow broken at delivery. He clicked and nothing happens - no work, no list of bugs. If he shoots to the top of the list of bugs manually, it is empty. Again, the RT works very well if you run it through LabVIEW and not as an application compiled in real-time. He also noticed that the open FPGA VI was grey on the block diagram. Are no other icons.
If the problem seems to be that the compiled application of RT becomes some kind of error, but do not tell me what it is, and it seems to be related to the opening of the FPGA. I recompiled the FPGA and RT. I recompile the RT himself, but not the FPGA, because this would take hours. It is download everything properly for the cRIO. The RT is set to run automatically. It is restarted the cRIO whenever he deploys the RT. They have LabVIEW on a computer, but it doesn't have the correct drivers to run the code of the environment of LV. I am to resist have them install the dirvers because downloading big files is complicated due to the restrictions of security as well as a lousy connection at a remote site. In addition, it does not solve the problem of RT executable doesn't work is not the same as the source code, which, according to the thread above, seems to be a thing.
The last thing I'm getting is that I sent her instructions for how to build a source distribution of the project that I sent and try to deploy on the cRIO. Even if it works, I'm not sure that this is an acceptable solution, because I assume running VI, rather than the EXE is slower, and they need to speed on this project.
Simply, I don't know where to go from here. I probably need to get direct access to the cRIO and I might be able to convince them to ship to me so I can understand this point, but I don't know where I got same departure other than the Voodoo debugging standard of "trying stuff randomly until something works". I am open to suggestions, if someone managed to solve this before.
Code snippet of the first part of the project is fixed, although I don't know how much what good it will do. I am really confused, and the customer is frustrated with how much budget is going to solve this problem.
-
Abnormal behavior observed in real-time executable.
Hello
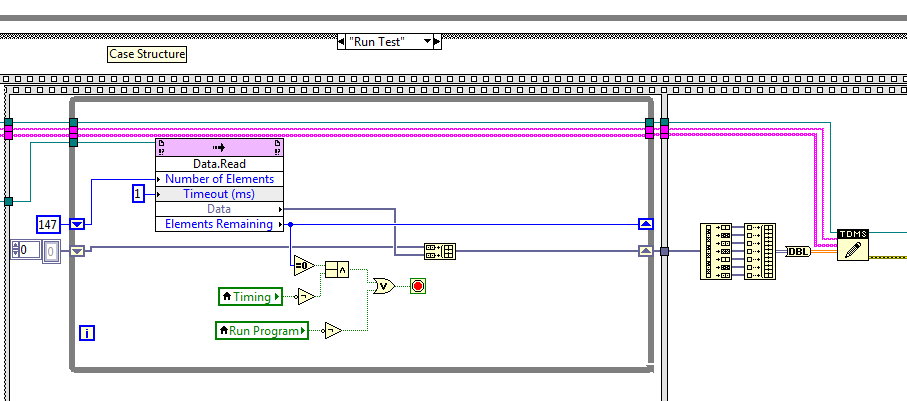
I have an interesting problem. I have developed an embedded application of Real-time/FPGA for cRIO 9024 and come across a problem that I don't understand. I work FPGA and RT of top-level and subVIs, proven individually and together when it is run interactively. When I create and deploy an executable in real-time like start, however, the behavior changes. I posted the code below, which I'll explain briefly:
I have a state machine with 5 States architecture. "Initialize" and "Shut Down" are exactly meet once whenever the device is reset, and the cycle between them is wait > pre-test > wait > run the Test and repeat as many times as desired. Measures are taken by FPGA and past in real-time by DMA FIFO and are then recorded to the TDMS file by the real time. Everything else is just interface.
The problem comes from the first time, the program enters the Test case to run. The FPGA send measurements as usual, and they are stored in a growing table updated buffering in the fixed-point shift register shown below.
Run interactively, this method successfully bed, buffers, sorts and writes all data in the file. However, in time real executable, only the data collected in the first round (147 items total, as it is initialized by the whole shift register) are saved, the rest seems remainsin a buffer? before calling the following function TDMS write, is that in the case before the next test.
I'm unable to debug the executable file in real time, probably because of the FPGA reference or some other schema components. I tried to replace the pad with a FIFO in real-time, a variable shared with RT FIFO active and tried to write inside the loop. The FIFO are not improving the situation, and when writing inside the loop, the loop does not run quite fast to stand.
The problem does not exist when I run the VI interactively from my computer, only when I try to deploy all of the embedded, any application that works (as far as I know) except this one place.
Any ideas to solve, or workarounds?
Ryan
Technical support helped me to resolve the problem, the early termination of loop caused loop condition, although I still don't understand why the behavior was different as an executable file, because the condition of the loop has worked in interactive mode, so if someone has any ideas as to the why, I would still like to know.
-
launch of LV in real time on the target programmatically
I'm new to LV in real-time, we are developing drivers for a bus controller in real time (I've already coded normal LV using UIBC pilots) and I am trying to achieve the structure for the execution of the samples. My first thought was to have a directory of the samples on the RT target and have a "table of edge-like" LabVIEW interface on the host that would launch the sample on the remote target. But as I read on in real time, it seems that the apps are not stored on the target, but simply run on the target at the launch of the explore (?) project. What is the code (VI) downloaded to the target whenever a program is run?
Is there a way to download and run a VI on a target of a diagram of block LV programmatically?
thanx
lmd2
lmd2 wrote:
Thank you, but just to get me it's OK:
When you launch a VI from the Project Explorer, it is downloaded into the memory of the RT system.
This remains in permanent memory - or is it re - downloaded every time that it is run from the Project Explorer?
It remains in memory until you restart the RT system or download the other screws from the Project Explorer. To simply run it several times (without modifications) should not be re-uploaded.
To start the screws on the RT of the Project Explorer is really nice for debugging or testing, but if I understand your needs isn't really the way to go.
For example, you can have an application that is started automatically on RT target that communicates to the host via TCP/IP. The host can request this request that samples are available. Then, the host can send a command to initiate a sample. The application of the RT will then call (dynamically, i.e. the local VI server) the corresponding sample of VI.
Hope this helps,
Daniel
-
On a Linux operating system, what tools need to developed a real-time application communicating with FPGA?
It is not unclear to me by reading the documentation on the website OR tools or drivers should I install on a Linux operating system in order to develop a C++ real-time application (that interact with FPGA) which will take place on a sbRIO-9651.
Is this possible at all?
Thank you
Michel
Everything works very well with an FPGA VI, compiled with LabVIEW FPGA 2015.
1. I have installed Eclipse on CentOS 7 with cross-compiler found at this link:
Compilers C & C++ GNU for Linux ARMv7 (Linux host) 2014
2. I also install a debugger crossed to debug application c / c++ remotly. Once on the page go in the section "Linaro Toolchain for Cortex-A" and download the second link linux "linaro-toolchain-binary (big-endian). The binary gdb is in there, so you must point towards him in the Eclipse debug configuration:
3. I installed the linux drivers from NOR-RIO 15:
4. I was able to program an application to c / c++ opening and running a LabVIEW FPGA Bitstream in a few steps:
Example of API Interface FPGA C OR real time Linux and Eclipse
Michel
-
Hypervisor-HyperTerminal: how to write texts in HyperTerminal to a VI in real-time
I use on my PXI system hypervisor. With 'Specifications to build', I built my RT application in a standalone rtEXE file and set it as start VI for my RT system. It seems to work, since I have received information from my "hypervisor-HyperTerminal" while restarting the RT system. He writes, "Startup Application: d:\ni-rt\startup\RTMain.rtexe. However, I don't see how my RT application is running or if an error occurs. Therefore, I think to write texts or my RT application information to the HyperTerminal.
I wanted to use VISA to the serial port of the HyperTerminal on the side-access system in real time. I used the example LabVIEW "basic series write and Read.vi ' to 'smplserl.llb '. Under the system in real time, I found only a single resource VISA name, which is "COM1". Apparently, I can write successfully texts at the port "COM1", because no error was shown in the example VI. But the texts do not appear on the HyperTerminal.
Do you have an idea, what I did wrong in my attempt, and how I had to do it correctly? Thank you very much.
Kind regards
Scarletice
Hello Scarletice,
You can use the Debug String VI (http://zone.ni.com/reference/en-XX/help/370622J-01/lvrtvihelp/rt_debug_strings/) RT a message programmatically to the console at the time on a Real - Time Hypervisor system LabVIEW Real-time.
Please let me know if you need additional help, and have a nice day!
Best regards
Casey Weltzin
Product Manager, LabVIEW Real-time
National Instruments
-
Pass an array of real-time desktop PC
Hello
I recently started using LabVIEW Real time. I want to transfer an array of data from a PC to office to a PC in real time. The data transfer is time and once real PC will make further processing of the data. I'm using LabVIEW 8.2 and the corresponding version of the time real LabVIEW. I do not understand how to program the time real PC to receive all the elements of the array in the order. Below is a brief description of what I've tried so far.
At the beginning, I created a shared variable on the computer which was the data type double target. I activated "Buffering" and set the size as 10 double rooms. Enable FIFO tab real-time time real FIFO, selected several items and set the size as 10 double rooms. On the desktop, I used a loop for to transfer all the elements of the array in the shared variable. I used a 500 ms delay in the loop for debugging purposes. On the target side PC, I used a while loop, the same delay of 500ms and built a table reading the shared variable. To run the program, I ran the VI on the target PC and then the VI on the host. I could see that the painting was being filled with data from the host computer, but the first element of the array of host PC has been filled in the second element of the array on the computer target. Another problem, is that there is no way to prevent the target computer that the host PC had sent all the data and he had to stop the filling of the table. The first problem with lag of data can be attributed to the timing. But I don't know how to solve problems.
I also tried declaring the variable shared on the computer target with the double data type 'Array of '. But when the data is passed from the host PC for the target computer, I don't see the variables reflected on the target computer.
Is could someone please tell me what error I do here?
Hello
The problem has been resolved. It is LabVIEW time real 8.20 which has been altered. Therefore, did a re-installation of LabVIEW. Now I have the sample project attached (ex2.zip) in the previous post works perfectly. Thank you for your help.
Kind regards
Prashant
-
iPhone download videos in real time with the company data?
How to set up my iPhone 5 to download videos in real time on my iCloud account using the data of the company (and WiFi, too)?
Alexander.Carpenter wrote:
How to set up my iPhone 5 to download videos in real time on my iCloud account using the data of the company (and WiFi, too)?
iCloud photo library - Apple Support only works when the two is connected to wifi, no cellular data.
Read here's how it works.
-
Get strange errors 'real time' in the browser console, what do mean?
I noticed recently that since yesterday is the day prior to that, I get a strange 'real-time' error messages in my browser console log. I get them for more or less the same sites, and I have attached a screenshot of some of the most common mistakes for example. I see these errors very frequently in the browser console log.
So I'm a little worried about what mean these errors, why I want to come and if anything, what to do about them.
Hello
Try Firefox Safe mode to see if the problem goes away. Firefox Safe mode is a troubleshooting mode that temporarily disables hardware acceleration, restores some settings and disables add-ons (extensions and themes).
If Firefox is open, you can restart Firefox Safe mode in the Help menu:
- Click the menu button

click Help

then select restart with disabled modules.
If Firefox does not work, you can start Firefox in Mode safe as follows:
- On Windows: Hold down the SHIFT key when you open the desktop Firefox or shortcut in the start menu.
- On Mac: Hold the option key during the startup of Firefox.
- On Linux: Exit Firefox, go to your Terminal and run firefox-safe-mode
(you may need to specify the installation path of Firefox for example/usr/lib/firefox)
When the Firefox Safe Mode window appears, select "start mode safe."
If the problem is not present in Firefox Safe Mode, your problem is probably caused by an extension, theme or hardware acceleration. Please follow the steps described in the section Troubleshooting extensions, themes and problems of hardware acceleration to resolve common Firefox problems to find the cause.
To exit safe mode of Firefox, simply close Firefox and wait a few seconds before you open Firefox for normal use again.
When find you what is causing your problems, please let us know. This might help others with the same problem.
- Click the menu button


Maybe you are looking for
-
12.4.3 iTunes for Windows 7 32 bit
I do you
-
What is the correct way to "downgrade" from Vista to XP on Satellite Pro A120?
I want to downgrade to XP. I have a Satellite Pro A120 PSAC1E. How should I proceed? TIA.
-
Satellite L30-105 (PSL33E) Windows Vista does not see the DVD - ram UJ-850 s
Hello I have a Satellite L30-105 (PSL33E) with windows Vista. Windows Vista does not recognize the DVD - ram. BIOS recognize DVD-ram. I tried to download the drivers for the DVD-ram, but they are not on the side of Toshiba. Who can help me to get the
-
weak continuous signal low-pass filtering
I get continuous signals to the NI USB-6259 of multifunction DAQ device is acquiring its signals to 1000 Hz. The rate of data acquisition can be changed through the GUI, but that is for later analysis. The main issue here is labwindows offers many op