Detection of peaks of waveform data
Hi people.
It is probably obvious, but I can't understand it. In the attached VI sine wave detector summits are determined from a simulated signal. I want to be able to do the same thing with a waveform data (DBL), but it won't let me. How can I extract the signal of the LDM to feed the rest and make the waveform work VI right Ridge detector?
Thank you
Select this option.
Use of DDT, found in the range of Signal handling, to change the dynamic thread in a waveform.
Bob Schor
Tags: NI Software
Similar Questions
-
problem with the history of EEG waveform data
Hello world:
I use SIT to create a user interface in Labview to communicate with a simulink model. After I configure the SIT connection manager and run the vi, the output was displayed in waveform graph.
Now, I want to get all the data in the history of the map of waveform. I tried to use the graphic story property node to access the whole of the historydat. But nothing copied in the part of Y in the front of the cluster of waveform...
Can someone give me a helping hand on what is the problem? or has anyone encounter the same problem when you use SIT. I am really confussed...
I've attached the vi, but to run the vi, you must have a simulink model corressponding and SIT, so I'm really sorry that you can not run it
And thanks a lot a lot a lot for that.
/ Shangning
I just realized this data is a 2D waveform table, which contains the waveform 2000 * 1, and each waveform data contains only 1 value of Y.
-
get the timestamp of waveform data
Hi all
I'm coming out of the timestamp from waveform data if this is possible. I am writing to file, but the express vi does not allow for fractions of a second and when I write a string waveform data for use with writing to the worksheet, the data of time is lost.
any suggestions?
Use Get waveform components. What part of VI? Writing to a file of measure written fractions of a second.
-
Detect the PEAK, mount and average
I use a loop in LabVIEW 8.5 to capture the signals emitted continuously by a card, peak detector.VI is used to detect the signal peaks, then fit.VI nonlinear curve is used to climb the summits, signal now capture, detection of peaks, mount and display pics are all works very well permanently, but there are still some problems annoying me.
1. the received signals is not very stable, so editing results expected on average for 100 times, then how can I averaged the results of fitting on the condition that the capture of signal is not interrupted, this is the time loop does not stop, when the average is made this time, average is reset for the next 100 fitting results can be average again?
2. There is another way, that's 100 results of fitting is automatically saved to excel, then the results is an average manually in excel, then how to store results like this: the first 100 results of connection are stored in an excel file and the next 100 results for other excel connector or they are stored in an excell , but in different columns? Of course the thses are subject to the capture of signal is not interrupted.
3. There is a threshold for the detector.VI peak, but the captured signals entry isn't very stable, so the number of peaks detected is not the same every time, like this time, the number of vertices is 40, next will be 39, this will affect the results of fitting slightly, then how do to detect the same number of vertices every time such as the number is 40 each time?Any advice will be appreciated!
Maybe the pic attached detect.vi 'test' can help you. "medium signal.vi" is a sub VI on average the signal in a way online.
There are three methods using the input signal:
1. no average.
2. average exponential.
3. linear average.
Your problem is when the input signal is damaged by some noise, and you want the input signal before the detection of peaks on average. I use white noise to simulate a noisy environment.
By default, the average mode is 'Linear', and the number of averages is 50. The more averages, the best on the result, but more time to update.
Swith mode between 'Linear' and 'No way' to compare the difference before average and average.
Average exponential is not appropriate in your case.
Let me know if it works for you.
-
Hello world
I'm trying to filter the noisy analog inputs of 10 channels (DC). I'm sampling of 100 samples/channel at 1000 Hz. My idea is to filter the data with a low pass filter (cut to 10 Hz 3rd order butterworth low freq) and then to calculate the average of each package of 100 samples. Finally, I would like to receive values at a rate of 10 Hz, which can be displayed on the front panel and be written in a file of measures.
My problem is the following:
The Express filter VI does not filter continuously after that the VI began. It seems to reset each time the loop runs. The table of 100 samples (white) before and after (red), the filter appear in the image "filterResponse". If I take the average of this table, it is of course less without the filter due to the transitory values between 0 and 0.025 s. I built a simplified version of my VI with only one channel using the VI "Simulate signal" and my concept seems to work well which is permanently (see "filterMeanExample.vi"). I get the idea that it might have to with the kind of dynamic data that is supported by many express VI. But since I'm on the VI KEITHLEY, I do not use the type of dynamic data. In fact, I had to convert a waveform data type to get a vehicle appropriate for the file of the measurement of its release.
I wonder how to keep the filter VI of reset each time that the loop runs.
My VI is rather large and contains the KEITHLEY 'Acquire signals' VI which most people do not have in their libraries, so I decided to show only the images.
Thanks for your help!
Phil
System: WinXP, LabVIEW 8.2.1 Professional
Thanks for the tips, I am set!
I used the VI of butterworth filter in the tool box to filter on the Panel of the Signal processing that accepts the type of table data. I put the variable ' init/cont' true to prevent the filter to reset its initial States to 0. I guess, it was my real problem before. The Express filter VI doesn't have this option, so I wasn't aware of this feature.
However, an image of the current value is attached.
Thanks again,
Phil
-
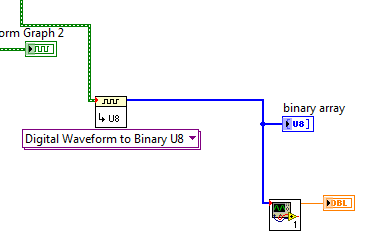
Process of waveform data (accumulated results)
Hi all
I am currently treating a waveform data that I read of DAQ card. Data are digital waveforms, so first I convert it to table DBL and then put the table in a block of prcessing (see attachment). Since I expect to get a report and indeed I got what I want at the first time. However, when I re - run the program, obtained results. for example the first time I got 0.5, then when I re - run the program, I expect to get another 0.5, however what I have is 1. If I keep running again, he continue to accumulate.
Can someone tell me what's wrong with my program? I have attached a screenshot of the code and also the vi that I used to do the processing.
Thanks in advance for your help.
Main program:
You have an uninitialized enter your last registry FOR loop to shift. Initialize to 0 and you should be good to go.

-
Hi all
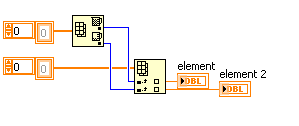
I am a fairly new user to Labview and am trying to create a program that: watching the entries in different modules (9213, 9217) CompactDAQ sensors check errors and then uses data from some final calculations like averaging etc. I've set up a small piece of code that includes the main functions that I am trying to accomplish. Now I'm rather uncomfortable with getting set up and assigned channels, then pass these data in a while loop that continuously pulls the data from these sensors.
I have the vi calculations complete and complement the inputs of channel UI, now, I'm working on the side of data manipulation and reading things. The waveform D 1 who comes to read function is currently divided into components I want (given String Name and Y). He then transmit this information out of the loop via a queue which transmits to the parallel loop below that will perform the verification errors and calculations of average. There are some things that make it difficult. I showed the 2 sensors in my example, but in the actual program, there may be up to 400 entries. The problem is that not all of these sensors will be used on all the tests that the software is used for. To use the entries in the VI test for example: if I'm trying to the average of these 2 entries to create a common value, but then on a test, sensor 2 is not there, it must be recognized that fact and not use it in the service average.
So to get down to it, I want to create something that can look through the D 1 waveform data groups, determine what these values are, then perform the functions necessary for these numbers once they are identified, then pass on the calculations of VI where it displays then usable for user information. I think I'm having a problem with the finding in sorting than what I thought at makes me think that there must be an easier way.
If someone has encountered this? What is my explanation of what I'm trying to make sense? Let me know and I can clarify.
In terms of features, I don't see anything wrong. with respect to the effectiveness we must remember some general indications. These issues that I bring to the top will not affect your code now since your stack sizes are very small but can start to create the fragmentation of memory and slow down the software if your stack sizes are much larger and the software runs for a long period of time.
1. try not to use the table to build. Whenever you use a table built labview creates a copy in memory. Try to initilized your berries and replace subsets.
2. as much as you can try not index tables or unbundle cluster several times. try to perform as many tasks as possbile in one shot. (what was obvious in your second loop)
In addition, he's looking good.
I made a few changes to your code and attached to it. I wanted to give you a different on her opinion as it relates to being able to control entry and exit of programitically, if you had a look up table. I do not have the same changes to your second loop but I can guide you through what to do if you do not want to go in that direction. Yet once your original code is well done for someone who is new to labview, so don't feel you need to follow the new design of VI. Just try to remove the table construction and multiple indexing as a good habbit programming.
-
detection of peak with two thresholds
Dear colleagues!
Excuse me, but I need example or any help for the detection of peaks with two thresholds. Namely two adjustable thresholds with detector standard Ridge for the creation of a detection bandwidth or range.
Detector of crete have only one threshold of... But why only one...

-
What is the difference between waveform data and common digital data? Whenever I have do analog data acquisition, the Board always wonder if I want to put the data acquired as a waveform or DBL type. For a specific data source, there is large difference for the two choices? If I chose to acquire waveform data, how to set the sampling frequency? I mean what I will get in a "waveform sample? Will it be a number or a set of numbers that contributes to a "wave"?
Thank you!
Right. A waveform data type can also have attributes assigned as the channel name. Read the help for a complete description.
-
Access waveform data passed in a DLL
Hello
I'm working on a LabVIEW application that processes the continuous stream, 2 ms/s, 32 analog input channels, each channel. This application has a DLL built in order to improve the table great handling performance in LabVIEW. Initially, I fed the DLL with a double 2D array returned by DAQmx Read VI and worked on a controller embedded high performance. However, the new requirement is, I need to treat timestamps as well as each Read call to HAVE him, and that's why I need to feed the DLL with the waveform data returned by DAQmx Read. Output waveform contains the timestamps I need.
The problem is, I don't see an easy way to access the data of waveform within the DLL (developed using Visual Studio C++). The type of waveform data seems to be a C++ class, and who looks like I need to add a considerable amount of code to retrieve the data within the class of waveform.
My question is, LabVIEW naturally does support access to waveform data in a DLL and if there are examples of code? I understand, I can you can also process outside the DLL waveform data and feed the DLL with the array element in the waveform data. However, I have concerns about whether if performance will be significantly affected.
Thank you!
Donghui Yin
Doy says:
Sorry for the incomplete design details. If you are interested, I have used high cards, not PXI. This is why I don't have a problem of bandwidth PXI. Special assistance, I need right now is the note, 'External Code in LabVIEW using' manual on Page 2-7:
"Note waveforms, digital signals and digital tables can be passed through shared
"libraries, but access to the data inside shared libraries is not supported at this time."Thank you.
I think that the text is clear enough! There is no documented API for access to international it data waveform within an external code module. The generated data type the node in library call for such a parameter is HWAVE or something, indicating that it is an opaque handle whose implementation details are deprived of LabVIEW. Since there is no documented API for access to her international of such data there is simply no way to access it.
And I didn't know all the functions that are exported in the LabVIEW executable that I could easily connect with the waveform dataype. Even if I had, we still do not know the prototype (aka list of parameters and types) of these functions.
Your only viable solution is to work with the data types supported. Your C code, or possibly the LabVIEW (table handles) native data type, either passing data in table C. else pointer would require reverse engineering of disassembly, a legally questionable approach, but also a lot of your time. And everything you would find this way I would be very hesitant to use in what feels, walks or crawls like a real-world application, since you can't be sure that your conclusions will work for any situation. It is also likely that your results will depend on some attributes may change between versions of LabVIEW.
-
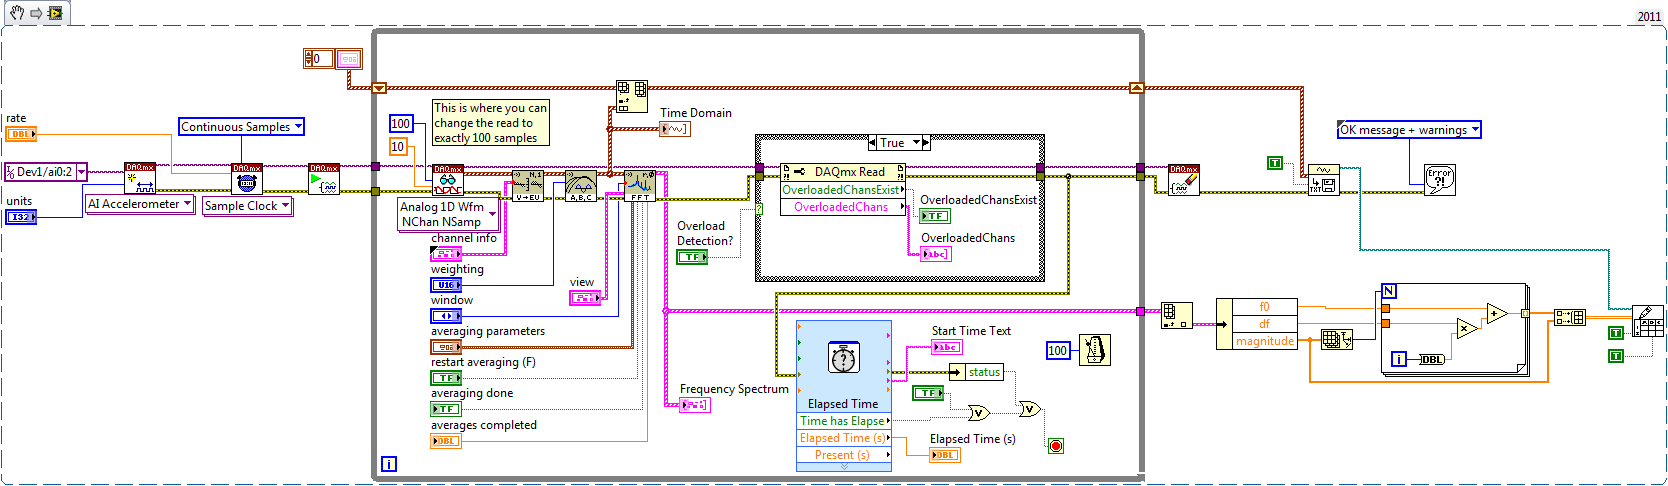
determination of the sampling rate and the frequency waveform data record
Hello
I write a simple program that collect data from a triaxial accelerometer input, convert it to a frequency spectrum, and then save the time domain and the frequency of the waveforms in an external file separated. I don't understand how to set the sampling frequency, however. On the DAQ Assistant, I updated the acquisition mode "Samples continues" and read samples is 2 k, which corresponds to the total number of data points that are collected. How can I program sampling for awhile, it 30 seconds, for example? Wouldn't be better to set up a trigger, as it will continue to collect data up to what I told it to stop?
I also want to save waveform data in a separate file that can be easily seen by other computers that have not installed Labview. I have currently the program put in place to convert a text string of the waveform of the time domain and then save it in a text file or a spreadsheet. It works fine, but I would also like to record the frequency wave, which is a different type of data. How can I do this or is there a better way?
My program is attached. Thanks for your help!
Here's how you can use the shift register to build the table, and also where you can choose to play exactly 100 samples per while the loop iteration.
Brian
-
Writing of continuous waveform data
Hey,.
I can't change the continues writing data to the worksheet found code here. I modified the code to write data to a spreadsheet so I can get a timestamp to the data that I collect.
My problem is this: whenever I run the code it rewrites the header of waveform information in the spreadsheet, so I could get 100 rows of data, good timestamp and then 4 rows of header information more than 100 lines of timestamp and then 4 header lines and so on. I have been using the feature to add the entry in the spreadsheet, which I think is part of the problem.
How can I get waveform data to write continuously in the spreadsheet and write only once the header information?
I have attached my code and an example of the header several write the problem.
Thank you!
He removed a + 1 function after that loop to the bottom left of the VI.
This is the VI saved at 8.0 LV.
-
How can you save waveform data w / an iteration variable?
No one responds to my messages, three Ive packed in the last hour, no one knows how to do this? I don't think that's the problem.
Please help me, I need to save waveform data, however several times a second the user said, I have one already done 'iteration timer' but it does nothing.
Please, if you can help me, I use LV8.5.1.
Thank you
(I am a very new user.)
-
Detection of peak at the same time
Hello
I have two waves A and B with 10000 sampling point.
Now, I want to find Max and Min waveform peak value has and correspond to what I want to know the respective value of the B wave.
So end of thw Finally I have the Max value of A and this is the respective value of B.
For this so I want to know the basic idea.
Thank you
After samples were taken by the waves. Use "Table Max and Min" on a range, or edge detection
Then connect the clues of the max and min for "Index Array" of table B.
-
How to detect the El Cap installation Date
So El Cap is a bust for me (many questions NAS), I need to go back to Yosemite. Someone at - it a good way to detect what day I did the install on? Can I restore to the last TM before that?
Thank you.
Open the App Store, then click on purchases. You should see a list of all applications that you downloaded and the date that you installed them.
Maybe you are looking for
-
How can I turn off live bookmarks and use the other drive
I regret that I checked the possibility to always use live bookmarks for my RSS FEED. Now I want to use bloglines, but when I click on the flow RSS to add to bloglines, live bookmarks appears and I can't have the power to add to bloglines. I'm so fru
-
Safari 6.1.1 does not play youtube videos. Can someone help me please? Problem started today.
Hello Today my MBP, Safari 6.1.1. stop playing youtube videos. YouTube says safari is obsolete. What should I do? Thank you.
-
Your opinion about Satellite A100-906
I'm about to buy.Anyone can recommend? I personally interested in the life of its graphics and battery. I do have problems with Go7600 overheat?If she is underclocked?No problem with the CD/DVD-ROM?
-
Vertical center label multiline inputText
Hi allI'll start by adf, I use jdevelopper 11.1.2.4 and I have a little problem with the label of a text of entryI want that label description in order to be at the center of the inputext which includes attribute equal to 3 lines.Thank you.Khalil
-
Is there a play loop, or anyway a button loop segment (image) when editing in the timeline in first elements?