Generation of sample data edifacts.
HelloMy requirement is like that I need to read the folder EDIFACT document and convert it to XML and put it in the other folder using the Protocol Generic file 1.0.
I used the B2b technical editor to generate the .ecs and xsd files using the model EDIAFCT D98A good command.
I also generated the corresponding .dat file usiing the respective .ecs and .xsd files. Now when I open this .dat file it shows only the gross structure of EDIFACT, but how can insert sender, the identification of the receiver, the data (payload) in the .dat file using spec writer.
While when I place the .dat file in the folder reference in the channel listens to read the file and convert it to xml as I marked the option translate into agreement.
How should I enter my data in EDIFACT format to test my usecase.
Kind regards
Nishant
You may see in ecs who where in the dat file is referring to what data and therefore you can enter data. Another way, first configure B2B for outgoing and pass XML. It will generate a native EDI file that you can modify and use for entrants.
Kind regards
Anuj
Tags: Fusion Middleware
Similar Questions
-
Does anyone know how to add a folder with sample data the installer to labview
I have set up a program to install the application to a project I'm working on that. I want to add a folder to the installation with some sample data files. Currently, I added a readme file that tells the user to decompress a file included with the Setup program in a certain folder. Is there a way to automate the process and include this with the installer?
First add all the files you want to include in the project. Then in the properties of the installer:
1 use tab destinations to add a folder if you have the sample files contained in their own folder.
2. on the file source page, expand "My Computer" and find the files in the project you want to add.
3. Select the folder you want to that they be located on the right side and click the right arrow.
-
Convert unequal sampled data dynamic XY data for use in other subVIs of signal processing
Hello everyone. I wonder about this and have searched some topics of discussion, but all seem to point to do so, to re - sample the signal with the dt as low as possible. However, for me, I got the data using another instrument and its treatment and analysis using LabVIEW. Are there sub-VI/methods that can be used to convert a given without having to re - sampled or interpolated, XY train that is to maintain the measured signal and convert the pair in a dynamic type?
Thank you
If it is unevenly sampled he cannot be given dynamics. Of course, you can keep a copy of the original data for later comparison, but you must resample or interpolation in a way to make any type of treatment that requires uniformly sampled data.
Lynn
-
Essbase Studio impossible to 'Examining the sample data' in the Oracle DB Data Source
E.M.P. version 11.1.2.3.500
Oracle DB 11.2.0.4
on Windows 2008R2
I created a user DB ESSTBC with the following user privileges
CREATE SESSION, CREATE TABLE, CREATE TRIGGER, CREATE TYPE, CREATE VIEW
This is my first attempt on the Essbase Studio, so I executed the following scripts as the user ESSTBC to create the TBC tables and load the data
tbc_create_oracle. SQL
tbc_sampledata. SQL
I am able to connect with ESSTBC and select the tables all loaded and made sure the data is loaded correctly
Then in the Studio of Essbase, I created a data source, which I can list all the tables in the schema ESSTBC in 'Data Source Navigator'. I also managed to create a Minischema by joining the tables SALES, SCENARIO, and MEASURES.
However, in "Data Source Navigator" when I select "SCENARIO", right click and select "View Sample Data", I am able to pull data from the table. that is the table with all the names of columns grid but no data. No error messages were shown in "Messages to the Console.
Back to Developer SQL and connect the same DB as ESSTBC, I have no problem do a "SELECT * SCRIPT;" and recover all the data of the table without a problem.
I proceed creating dimensions elements then a hierarchy of "SCENARIO". But again when I try to get a glimpse of the hierarchy has got an empty tree. Apparently, there's something wrong,
No matter what mark on what I missed?
Thank you very much.
Problem solved. The cause being my stupidity ruin a access DB. I can see examples of data without changing anything in Essbase Studio after you change the DB user rights.
-
BI Publisher fail to get the sample data
Hello
We have a BI Publisher integrated with OBIEE 11.1.1.6.2. We try to create reports BEEP using the analysis to OBIEE existing. When I create the data of existing OBIEE analysis model, it allows me to select the existing analyses of the shared folder and together created him, but when I hit the sample data database create he does nothing. He simply display a blank page. I checked the connection to the database (via BI Publisher manage) and his works fine. Any idea what's going wrong here? No matter what pointer that log file, configuration file, should I be looking to investigate more?
Thanks in advance.Take a look at the NQQUERY.log to see if you are able to locate the query that was sent to the database...
Thank you
Bipuser -
Not available in all sample data tables during installation of RMS
Hi all
During my 13.2.3 RMS installation, do not produce sample data for tables like IF_TRAN_DATA, IF_TRAN_DATA_TEMP, SA_EMPLOYEE, CLIENT, LOC_TRAITS? I got the data in the tables as class, WH, SUP, ITEM_MASTER, ITEM_LOC etc.Hello
This isn't a problem I think. Some tables are provided scripts for, others not.
trandata etc are operating tables, it will certainly not fulfilled by the sample scripts data, you need to run some batch to generate documents, or do some UI operations.
Re the SA_EMPLOYEE CUSTOMER, tables LOC_TRAITS: this are not required for a system that works. WH, OVERTIME, etc. are required to have something to undertake a basic operation.
Best regards, Erik -
Governor limit exceeded in the generation of cube (data records Maximum exceeded)
Hello
I have a PivotTable that contains about 30 measures and the lines are also measures. The columns are the last 12 months, I get the following error when you try to view the results:
Governor limit exceeded in the generation of cube (data records Maximum exceeded).
Error details
Error codes: QBVC92JY
I checked view pivot instanceconfig.xml and these settings are set to higher values:
< CubeMaxRecords > 100000 < / CubeMaxRecords >
< CubeMaxPopulatedCells > 100000 < / CubeMaxPopulatedCells >
< PivotView >
< MaxVisibleColumns > 5000 < / MaxVisibleColumns >
< MaxVisiblePages > 5000 < / MaxVisiblePages >
< MaxVisibleRows > 100000 < / MaxVisibleRows >
< MaxVisibleSections > 5000 < / MaxVisibleSections >
< / PivotView >
I do not know why this error pops up as the set of data is not large, there are 30 rows and 12 columns.
I followed http://obiee101.blogspot.com/2008/02/obiee-controling-pivot-view-behavior.html
Can anyone help?
Thank youHello
Increase the size of CubeMaxRecords and CubeMaxPopulatedCells and check it out.
600000
600000 See you soon,.
Aravind -
Hello people,
THAT THE QUESTION PERTAINS TO:
I play on 2 parameters of a system based on the sampling time: Rotary position and vibration (accelerometer g increments). I want to take a fft based on the post to create a spectrum of the amplitude-phase speed order in / s. To do this, perform the following:
1 integrate (and scale) g vibration signal in the / s (SVT Integration.vi)
2 signal sampled vibration resample the same time at an angle similarly charged signal (ma-resample unevenly sampled input (linear interpolation) .vi)
THE QUESTION:
Order in which operations should be carried out, integrate then resample or vice versa? I didn't order would be important, but using the same set of data, the results are radically different.
OR ORDER ANALYSIS 2.0 TOOLSET:
I have the NO order Analysis Toolset 2.0, but I could not find a way to get the speed profile generation live to work with signals of position encoder DAQmx (via pxi-6602) quadrature. In addition, it seems that I have to specify all the commands I'm interested to watch, which I don't really know at this point (I want to see all available commands) so I decided to do my own fft based on the post to get a spectrum of the order.
Any help is greatly appreciated.
Chris
The order is to integrate the time domain of first - creating a speed channel. You now have a new channel of data. In general I would put this in the same table of waveform with waves of acceleration time.
Then re - sample your acceleration and/or your speed signals, and then you can calculate the spectrum of the order.
-
I have already tasted the data of an input in the time domain signal. the signals are sampled by ADC and stored in excel file (about 16 K samples). I need to feed to the FFT VI for the plot of the FFT. I tried several bolts of FFT, but nobody does not accept data samples directly which is stored in the table 1 d. Any ideas? Thank you.
Hi ABM26,
Your input signal looks like a pure sine wave. You perform the FFT and get the amplitude. So you get two peaks in the result. I think it is the correct result. Why do you think the result of the FFT is false?
And I realize that you want to calculate what the power spectrum. You can use the Signal Processing > spectrum analysis > Power Spectrum.vi directly.
-
Hello
I am trying to trace my data sampled, but I think I'm doing wrong somethinng.
I took 1000 samples pf my signal analog to 1Kz, dt = 10, stored in a table and through fft spectrum.vi I tried to plot the data, the frequency of Ampliteude vs. The analog input is a magnetic field meter, I measure my pc for the test field.
The problem that in my view is the scale of the frequency, my opinion is that the Summit should be 0.05 Hz 50 Hz and not
I have attached snapshots of my program and my results. could you please check and tell me if I'm doing something wrong?
Concerning
Garbage in, garbage out!
You lie to LabVIEW so its bad data donations as well.

If you read the help for the timed loop, you will see the dt is the source of synchronization units... you are collecting data at 100 Hz.
Next:
"dt" for a waveform must be in seconds at 100 Hz the dt should be 0.01 NOT "10".
Then read the help, mod your code and you should get the results much more resonable.
Ben
-
Sample data and application of planning for planning 11.1.2.1
have been finding sample application and sample for hyperion planning 11.1.2.1 data
Please notifysqlplus should be available on the machine where the Oracle DB is installed.
See you soon
John
http://John-Goodwin.blogspot.com/ -
Access the 4th generation Time Capsule data remotely in Mac and PC
Hi all
I intend to log in case Apple support, but my Service and Support coverage is already expired > _ <.
Apple PC does not support mobile devices like IOS or android, so in this top, I'll focus on Mac and PC.
Appreciate if you guys could give me advice on how to set it up properly.
Material and Configuration:
-ASUS RT-AC5300
Firmware version: last 3.0.0.4.380_3341 - g25420f5
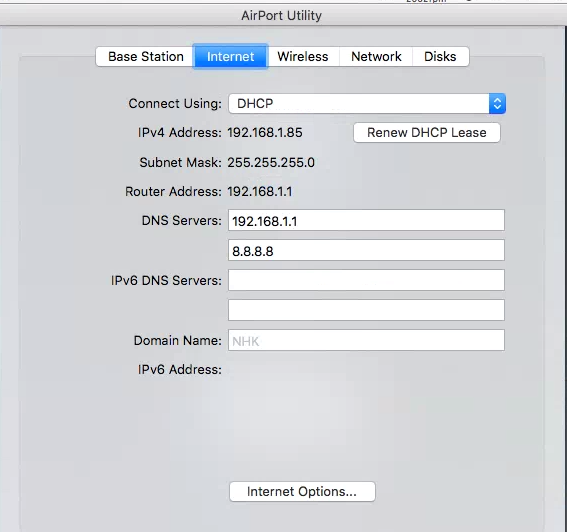
IP: 192.168.1.1
-Configured Port forwarding, Port 548 to 192.168.1.85 in ASUS router
-Time Capsule from Apple 4th generation (Firmware version: 7.6.7 last)
IP: 192.168.1.85
-Cable for direct LAN connection between TC Apple and ASUS router
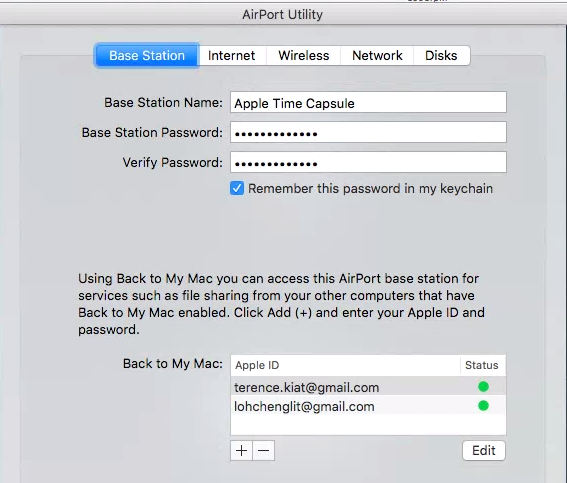
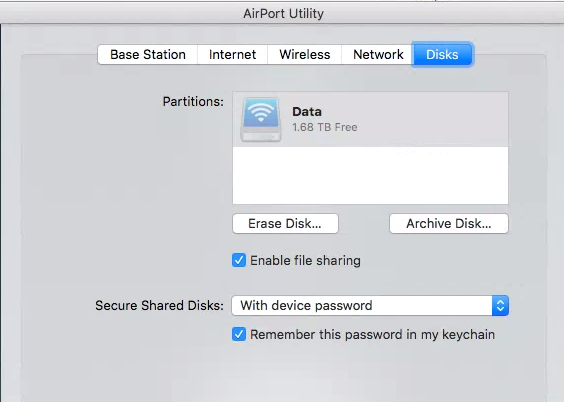
I can access my Apple TC LAN for PC and Mac (for PC, installed the Base Station Agent from the airport, for Mac, I access it via the Finder with credentials for password)
Tried several times to set the TC to be able to access remotely to both Mac and PC platform, also read many articles, no luck.
Grateful if someone here can guide me on how to configure it so that it works correctly.
Screenshots below for Apple TC settings:
http://i2.Photobucket.com/albums/Y25/TerenceNHK/Apple/base%20Station.PNG
http://i2.Photobucket.com/albums/Y25/TerenceNHK/Apple/Internet.PNG
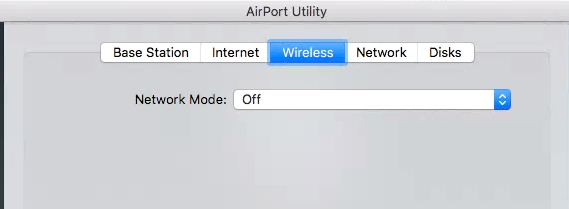
http://i2.Photobucket.com/albums/Y25/TerenceNHK/Apple/wireless.PNG
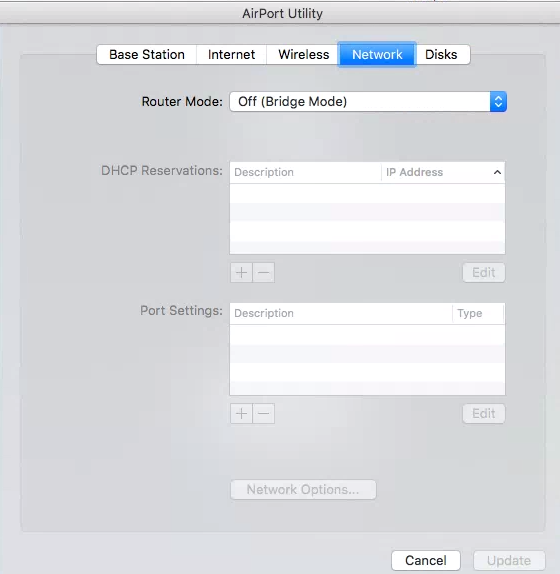
http://i2.Photobucket.com/albums/Y25/TerenceNHK/Apple/network.PNG
http://i2.Photobucket.com/albums/Y25/TerenceNHK/Apple/disks.PNG
Thank you very much!
Kind regards
Terence
In your Mac, in the finder, use Go, connect to the server.
Type of AFP://yourpublicIP
Download your public IP address of the router asus news... remote WAN you should use DDNS... iCloud is useless... disable in the TC... It does not work behind another router for most people.
But you must use the public IP address or DDNS address... It is available in the Asus firmware. Best is to buy a static public IP address from your ISP... This is the only reliable method... is worth a bit of money on a dynamic IP.
This is unnecessary for Windows computer... Access SMB is usually blocked by ISP and Windows does not support AFP.
Please post your pictures directly here... It's so much easier, then, for us to see.

-
Hi all
I am running FM12.0.2.389 on Win7-SP1 (64-bit) laptop with i7 & 16 GB of RAM.
I reported this problem as a bug in the Adobe bug base, but they were not able to reproduce the bug with the files I sent. This leads me to believe that the conflict is perhaps the result of something gone wobbly or conflicting in my system. Here's what happens:
Using 'Set expression' triggers crash FM on the next file > save, displays the error message on the imported graphic and loss of data which has been marked with conditions to exclude "NOT" in the phrase Boolean build.
Steps to reproduce using my files (zipped):
1. open Ch1_Introduction - 4FC.fm.
2. create a build expression named 3DpartnerKitConditions using this definition:
not "LIVEonly" and not 'InstallOnly' and not ('Commentary' or 'Deleted' or 'Future' or 'international' or 'PostInstall' or 'Question' or 'SDinstallOnly')
3 file > save.
4. apply the expression of the construction.
5 file > save... (crash)
Result: All conditions excluded via Boolean DO NOT tag data is not longer in the file, as seen in Ch1_Introduction - droppedText.fm.
What I THOUGHT was going to happen are that tagged data excluded via Boolean DO NOT conditions should stay in the file but hidden and can be demonstrated easily through text show/hide conditional > show all with indicators of Condition Show. Sometimes it does not crash FM and must behave this way, but 90% of the time the result is the crash and data loss.
Other things that I am looking at, I think I have a few scripts or running plugins that have been written for previous versions of FM. Yes, I'm addicted to the things of CudSpan, Bruce Foster, Silicon Prairie, FrameExpert, Sundorne and Miaramo. I noticed that (admittedly written in FM11) SafetyMIF causes crash FM at the exit, but as we use the Git repositories for incremental recording, trying to produce regularly the MIF is quite complicated the case, and record the bin file from FM bloats the referential way too technical to be happy at all.
I don't know what triggers the question of expression Boolean tag, but I really, really need to solve. I'm a solo writer (for now) with a very heavy load of docs and deadlines that can be managed by only sound sourcing methods. Thus, these files depend on variables, condition labels, shared files between different books, shared graphics and overlays of text, if any.
Someone in the community can help me find a way to identify the root cause? I plan to approach troubleshooting by first uninstalling FM, cleaning the trash to uninstall typical Windows, reinstall fresh FM, then adding the plugins one at the time and the attempt running Boolean tag setting after each plugin is added to see if I can tell which one is the trigger of the question. If it is a corrupt, obtained FM facility that would solve the problem, too. What do you think guys?
Thank you
René
Rene,
It is a healthy approach and probably the only thing, because there may be interactions between them (even though I probably have most of the same and do not see the odd-ball accident during recording).
Bruce Foster those who aren't are not compatible with FM12 (or even 11) - too old. Some of the plugins of Chris also had problems with FM11 and 12 If you don't have the correct MS 32-bit operating times installed (even on a 64-bit operating system).
-
Need some sample data for the practice of obiee
Hi all
I installed OBIEE 11.1.1.5 using SQL SERVER 2005.
Can someone help me on some examples of data for purposes of that practice sampleapplite
Thank you
SatyaBSatya done!
Rgds,
DpKa -
Newb: No simple sample data cube
Hello
I have the following simple table Setup
GDP-fact
gdpid PK
GDP
LocationID FK to the GDP-location - dim.locationid
GDP-location-Sun
LocationID PK
continent
country
In GDP-location-Sun, I have the following data:
LocationID continent country
1 Europe UK
Europe 2 Italy
3 the USA North America
and in GDP - actually, I have the following:
gdpid gdplocationid GDP
1 1 100
2 2 200
3 3 300
After you create a dimension of 'area' and a cube of GDP with a measure of GDP, I tried to view data (after completing step maintenance for the dimension and cube), but there is no visible GDP data in the cube. I have the visible dimensions, but all the graphics and the table cells are empty.
I can post the SQL code generated if this can help, but I was wondering if anyone might know off-the-top-of-their-heads that I had missed?
Thank youWere there rejected records when you have maintained the cube in AWM?
select count(*)
from cube_rejected_records
You have mapped the cube to the correct level of the size of the area (i.e. location instead of country or a continent).
You are able to see all the data in the cube SQL view?
select *
from gdp_view

Maybe you are looking for
-
Leroy douglas said that I could use a link, he sent. I went to this link and was not at the apple store and el capitan there.could I have a suggestion, why it did not work and someone could go to the apple store and see if it is there and if so tell
-
I have lastpass as an extension on google. Firefox uses less memory, has better features, & I want to use it as my only browser, but LastPass login & vault with all my passwords is available only if I use google?
-
How know to what Satellite A200 defective adapter belongs?
Hello I have two toshiba (Satellite A200-*) computers laptops & accessories (the two Portuguese). One of the AC adapter does not work since last week.Flow to ASP.But how do I know which defective laptop that belongs? They look exactly the same (http:
-
The headset sounds distant/quiet/distorted sound
Hello.. I recently had this problem with my laptop Windows XP (service pack 2 is). The sound from my headphones sounds quiet, almost as if the noise comes from far away and a little distorted. I had this problem on another computer and unplug the hea
-
Looking for a registered Converter PDF download site
Previously, I was able to use the "convert to PDF" function on my Dell printer... now all of a sudden he wants to convert to OCF or something...