Graph multiple series line
Hi, I have a chart with two series inside. Both series are of type charts, and each has their own SQL statement to retrieve the appropriate data. The problem is that when the tank is returned, the series are displayed one after the other, not in parallel on the chart.Is there a way to fix this?
Thank you
Beth
Hi Beth
Looks like you have a problem with the categories in your two series.
Turn on debugging and examine the graph generated xml code.
Locate the section.
Each series is defined as a set of points, and these points is defined as a class 'name' and a value 'y' like this... In my example the graphic drawing 3 lines and each line (series) have the same 3 categories. If it is possible to create a simple query like this, then the categories get mush easier to control. / Kenny
select null,
       to_char(o.order_timestamp, 'MON RRRR') label,
       sum (decode(p.category,'Accessories',oi.quantity * oi.unit_price,0)) "Accessories",
       sum (decode(p.category,'Mens',oi.quantity * oi.unit_price,0)) "Mens",
       sum (decode(p.category,'Womens',oi.quantity * oi.unit_price,0)) "Womens"
  from demo_product_info p, demo_order_items oi, demo_orders o
 where oi.product_id = p.product_id
   and o.order_id = oi.order_id
 group by to_char(o.order_timestamp, 'MON RRRR'), to_char(o.order_timestamp, 'RRRR MM')
 order by to_char(o.order_timestamp, 'RRRR MM')
Tags: Database
Similar Questions
-
Multiple series in a chart flash?
How can I have multiple series in a flashchart?
I am putting together a small application for a weight loss contest at the office and I have never used graphics in the apex before... With the help of the wizard that I seem to not get only one series. I want to have one for each competitor where the user can enter his weight daily and a (line 2D) graph that displays the progress of competitors in the same chart.
Do I need a plugin for this licensed or is internal Summit graphic enough?
Could someone give me a hint or point me to code or read it please?
Thank you
AndreasHi Andreas
You can add the series!
See
Region > graphic Flash
under the "series of the chart," click the button "Add Series".
GAson -
low latency multiple series to read
I develop a DAQ series box which reads using the SMU-8130 and labview RT I'm reading multiple series instruments that send packages of short, CR/LF-Close to a rate of about 1 to 4 Hz. Low latency between the arrival of the series data and treatment (timestamp) is a priority.
One of the instruments of series is a GPS timing device, and I checked, during playback of a single instrument in series, can I timestamp with a precision of about 50-100 microseconds.
However, when I add more instruments, or at least more instrument of manipulation loops without connected equipment, these latencies jump at least 10 x. The jump in time of latency seems also tied to the period of waiting time for VISA set up a Serial Port.
In other words, I suspect that the additional instruments may be locking other threads in treatment of the series. I checked the reading series is configured for asynchronous mode.
Can anyone suggest how to approach the issue? The serial ports are supposed to be blocking each and other reads like this?
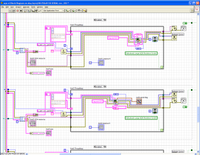
For reference, here's how my VI works:
Here's some of my main VI.
The basic operation is as follows:
- open_aqn_serial opens a VISA resource for each serial port based on the parameters of read_aqn_conf.
- Each serial port is controlled by a body independent while loop. Most of the work in each loop is done by the serial_handler2.vi, described below. Feedback loops are used for the sequence numbering and buffering.
- There are currently about 4 or 5 of these loops series instrument Manager
- In each loop, data from the serial port are timestamped, then sent to a queue that collects the data sets of all instruments.
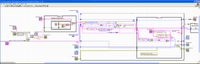
Here's serial_handler2.vi:
- The VI attempts to read either enough bytes for an entire package, or however, the number of bytes is on port, if it is higher. It is also configured to finish reading on the term float.
- The data is immediately stamped and added in a buffer.
- The buffer contains incomplete packages (in the case of a partial reading) until they are complete, then complete passes (or outdated) packets to the queue of the collection.
-
Hey all,.
I am trying to add a series of line to an areaChart (Cartesian actually)
I can easily add the second series via action script or tags.
The problem occurs when I try to update the series online. Each time series of line data are changed the main series of plot runs its animation (slide).
Is it possible to update the series line without enacting the plotseries animation?Solved.
What I did to remove the animation from the series, whenever the line series was created.
Because the data in the chart could change only when a user moves a slide I added animation when the mooused of the user down on the slide.
-
Create multiple vertical lines for waveform graph
Hi all
I use NI 9234 USB vibration of rotating machinery data acquisition. A simple VI was made for this.
The next step is the analysis, signals were well displayed waveform, time, FFT, all important values... and so on.
But I have a problem with multi vertical lines of the waveform graphs, it looks very simple, and I tried many ways but have yet to get it with a good solution.
Vertical lines are used to display the frequency of breakdowns of machines (such as we post 1 X, 2 X, 3 X,... more harmonics).
Does anyone have a solution for this problem?
Thank you very much!!!
Here's a very quick example (LabVIEW 8.2)
-
Line chart multiple series shows the range of points.
I have a 4 line chart series (using the Application Express 3.1.2.00.02 and Anychart 3.3). Data are based on a date range (x-axis). When I try to send back more than a month of a data value, it will only show points for a month (for example, the date range is 01/06/10 - 12/1/10 it will only display data for 6/1 - 7 / 1). Please let me know if you want more details.
Any help is greatly appreciated.
Edited by: cjmartin December 8, 2010 12:14Order what you have in your series on the chart lines maximum .
Jeff
-
Problem with multiple series - CFCHART
Using CF9, trying to create a simple table with two rows. Problem is that when there is no value, CFCHART draws a line, but with values of '0 '.
The first series is a set of values monthly (12) one for each month in 2011. The second series is also the monthly values, but for 2012, CDA (January to may 2012). For all values between 90 and 100, so I have it set to "Scale" in order to see if the year is better or worse.
I'm trying to draw series 1 (2011) on a single line and 2 of the series on a second line. This allows to compare the results of the year on the other. Have two QofQ, one that contains the twelve 2011 values and one that contains the five 2012 monthly values. The x axis values are numbers (1-12 for 2011 and 1-5 for 2012). However, I have re - format the results by using 'CreateDate', so CFCHART can identify a date and format / view only "months" on the graph (e.g., JAN, Feb, Mar... (DEC). This works, because the bottom of the graph shows JAN to DEC.
The chart shows 2011 correctly with 12 points and a line. But for 2012, it shows points 5 (January-May) with their values and then shows Jun - Dec 2012 with values of ZERO. So, on the plot of may 2012, you have this great line that goes from 90% in May to 0% in June, then 0% for the rest of 2012. I want only to draw the line in may 2012.
If you delete the series 2011 of the CFCHART, it appears correctly and displays only 5 months in 2012 (January-May). And if you delete the 2012 series, it appears correctly, with all 12 months in 2011.
I just need it to appear exactly like that, when two CFCHARTSERIES are used. Even if you < CFOUTPUT > the application of 2012, you get 5 points, Jan - may. So don't know why she wants the graphic elements 12 in 2012 with all zeros for June - dec 2012.Appreciate any help/tips on how to get year lines, with 12 data points for 2011 and 2012 5.
Gary
You must disable interpolation. However, there is also a bug in some versions.
https://BugBase.Adobe.com/index.cfm?event=bug&ID=3042868
See here for a workaround:
-
Time-series line in PivotTable
How can I define graph PivotTable to be of type "series of time line?Visit this link,
http://obiee101.blogspot.com/2008/12/OBIEE-using-timeline-graphs-in-pivot.htmlThank you
Vino -
Graph XY no lines, just Points?
Hi all
I want to build a graph of pressure relative to the temperature. It must be a standard XY graph, but I just want to see the scatter point without lines connecting the points. Is it possible to eliminate the lines between points (or make them invisible)?
Thank you!
You can do this in the properties of the graph. Right-click on the chart and select Properties. Go to the locations tab. Select an icon for the point (something other than
) in the third column of icons. Then select the top of the list in the fourth column. It is the symbol with the track of the points, but no lines. This will give you what you want. -
Divide a document into multiple records (lines)
I use ODI to move the data from the source on the target system. Both are Oracle. In the source system, I have a file I need to split into multiple records or lines in the system target according to certain rules. How can I achieve this in ODI. Please explainHello
What a day I understood your example
I have a few questions...
1. you have information about the patient in a table 1 source.
2. How do you identify for patient X you need to create 5 rows. you store this information in the table seprate or how...3. If you have this information in separate tables... a simple cross join in ODI, you should get the result...
Or give additional information with an example... it would be great...
Thank you
-
Management of Multiple exception line in 4.5 and 10 g oracle
Hi all
We are the migration forms 4.5 (oracle database 8) oracle 10 g (10g database). I have a strange doubt, the application works differently in 4,5 and 10 g when several lines are back. For example in a program unit:
Start
Select T1.field1 in var1
table T1
where
< Condition >
exception when too_many_rows then
null;
end;
If the above query is fetch multiple records and then to 4.5 he fetch any value (probably the first record) in the variable var1 but in 10g it only know transfers control to a part of the exception. No value is read into the variable. There is no debug on 4.5 but I have the debugged on 10g, and it behaves as described.
It's a change of default behavior in oracle forms or I do something wrong?
Please put some light on if or let me know if someone else has also faced same question.
Thank you
Ash4.5 the behaviour was incorrect, 10g R2 is good according to the regulations SQL, if you can not ensure that your SQL statement returns only one line and you must randomly select one of the many that are extracted, you can use ROWNUM = 1 in which your condition.
This returns the first line of the SQL result set.
But this isn't the way I personally would, I prefer to make sure my WHERE condition returns only a line.
begin Select T1.field1 into var1 from Table T1 where ROWNUM = 1exception when too_many_rows then null; end; Tony
-
How can I view multiple tab lines?
I have so many tabs I want to display several lines. I can't find an option to do so, but I know that I've done in the past. But I do not remember how I did it. I tried to find this option in TabMix Plus but no luck. Recently I've been using Tree Style Tabs, but it no longer works for me in 42 FF. Help out me?
https://addons.Mozilla.org/en-us/Firefox/addon/tab-mix-plus/
The page will load for me.Start Firefox in Safe Mode {web link} by holding down the < shift >
(Mac options) key and then from Firefox. Is always the problem? -
How to unlock the keyboard on my Tecra R series line
My keyboard is stuck on my other computer of series Tecra R,
I can't access 'e' only to 2 and so on, on the upper keyboard.I did find what I got wrong or how to fix with the keyboard or with windows 7...
No idea what I need to do?
Thank you
Hello
I think that you have accidentally activated the Num Lock
NumLock key is used to convert a portion of the main keyboard to act as a pad instead of the letters.Usually you can find the info in your manual how to toggle NumLock
In my case, I have to press Fn + F11 (in some cases FN + F12) to get that license. -
Blue and dotted on Tecra series lines!
I own a Toshiba Tecra laptop, and I recently got virus through music download.
I was using my laptop this afternoon when it froze all of a sudden, in the image of the screen by turning slightly pink.I rebooted, but the Vista windows startup screen logo with black background were blue, dotted lines vertical across it... and she was never actually starting.
I tried to restore system and repair of starter and whatnot, and nothing worked, so I reformatted. After that, the computer seemed fine for a minute or two.
But when I had to restart the process of reformatting, I had the same problem. After some messing around with the laptop and another tried to repair startup problems, I got the computer back up again.I just restarted for sh * ts and giggles and it worked fine. BUT the blue dotted lines are still there (only on the first screen with the logo)! The computer works well, as I write this with her right now, but I worry about the blue lines, as I read online that this can be a problem with a map graphic or something.
Oh and one thing: my toolbar on the bottom fell out, displaying only the half of it... can not really read time... is the screen shifted down or something? Is it possible to fix this?
Any ideas/suggestions on 1) blue dotted lines or 2) screen being moved slightly down?
Thank you!
Correction... I always have problems starting.
-
I have a wave form field which has a range of the axis y from 0 to 127. It is important that the plot goes from 0 to 127. The problem is normally the device I am able 127 statements for most of the conditions. I currently use a land line to the Base style but as lines go from the top of the list down. Unfortunately there is no apparent way to get a line style to the top.
I have attached my plot. As you can see, I want the lines to go from the top down.
Here is my code to set the style of the waveformPlot (linemode is true):
waveformPlot4.FillBase = XYPlotFillBase.YValue;
waveformPlot4.ToolTipsEnabled = true;
waveformPlot4.DefaultStart = lowerLimit;
waveformPlot4.DefaultIncrement = spacing;
waveformPlot4.YAxis = axis3;waveformPlot4.PointStyle = PointStyle.Cross;
waveformPlot4.PointColor = Color.Yellow;If (! lineMode)
{
waveformPlot4.FillMode = PlotFillMode.None;
waveformPlot4.LineColor = Color.Yellow;
}
on the other
{
waveformPlot4.FillMode = PlotFillMode.Lines;
waveformPlot4.LineColor = Color.Empty;
waveformPlot4.LineToBaseWidth = 1;
waveformPlot4.LineToBaseColor = Color.Yellow;
}Hello-
You're almost there - missing just one line. This should do it for you:
Maybe you are looking for
-
How to open my GMail on Firefox. Using Win XP PRO SP 3.0 32 bit
I use WIN XP PRO SP 3.0, 32-bitHow to access my account GMail using Firefox?I tend to forget all about my GMail, so need to read, a lot of emails, he...Please, I'm a novice user step by step pleaseThank you very muchSylvia
-
I used firefox on Mac computers for years. I am now under Maverick Mac OSX 10.9.1 and have major problems with sizing of text in windows and windows suddenly change size (much smaller) and jump on the left side of my desk. Apple does not support Fire
-
My HP Laserjet 1320 leaves printing several copies of a single document several weeks ago. Yesterday, I uninstalled, reinstalled, turned off the printer, unplugged, it turned on and plugged in. The computer '' recognized '' a new piece of hardware, i
-
I forgot my windows login password on my old laptop. How to replace it?
I want to sell my laptop, so I changed the user accounts and now when I rebooted he asks me a password for windows. I can't remember it.
-
Automatic brightness adjustment is missing (Acer iconia Tab 10 A3-A20HD)
Hello I had an Acer Iconia Tab 10 A3-A20HD. I installed all available (4.4.2) updates and configuration of the tablet. When installing, I recognized that the Auto-brightness Option is missing in the display settings. It is also not possible to activa