How to demodulate a signal?
I need to output a low frequency signal (between 2 and 30 Hz) between the output of a sound card at the entrance of another sound card, between two PC. Sound cards is not designed for frequencies below 30 Hz. That's why I need to use the Modulation of frequency or AM, (or PCM) on the outlet side to create a signal, for example, between 102 and 130Hz. How can I accurately demodulate the signal so I can treat it as the original 2 Hz to 30 Hz signal in my journal? I think since DASYLab support the AM, FM and PCM that it would also support the process reverses. How would I do that?
Although I wasn't able to demodulate the signal, using the FFT, I was able to isolate quickly the frequency since my entry was a pure sinusoidal signal.
Thanks to CJ to work up to an earlier example that brings me down the path to implement the solution!
Tags: NI Products
Similar Questions
-
How to extract the signal from the waveform of my power level designated?
Hi all
How can I extract the signal of the waveform accroding to the power level? I read the Trigger & Gate .vi, but this vi retrieves the signal duration. I want to extract the signal depending on the power level.
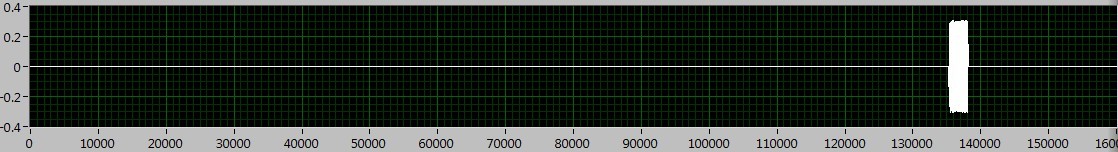
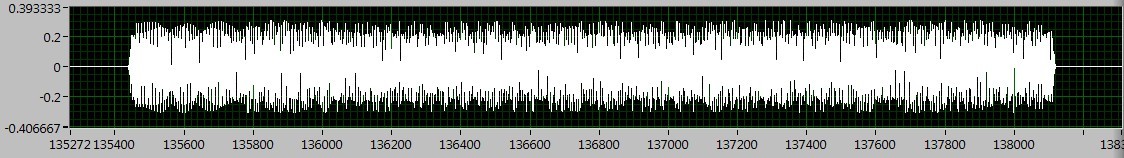
As shown in the following figures, the signal I want to deal with is between 130000 to 140000, if I Zoom, I can see the useful signal is between 135400 to 138200. The question is how to extract the signal in the area?
I tried the sub_NoiseEst_And_Chop_Shell.vi in the example of Packet_based_link also, but this Subvi seems to be a bit slow. Can someone give me the best advice? Thanks in advance!
I'm working on something similar, but have not had time to fully develop.
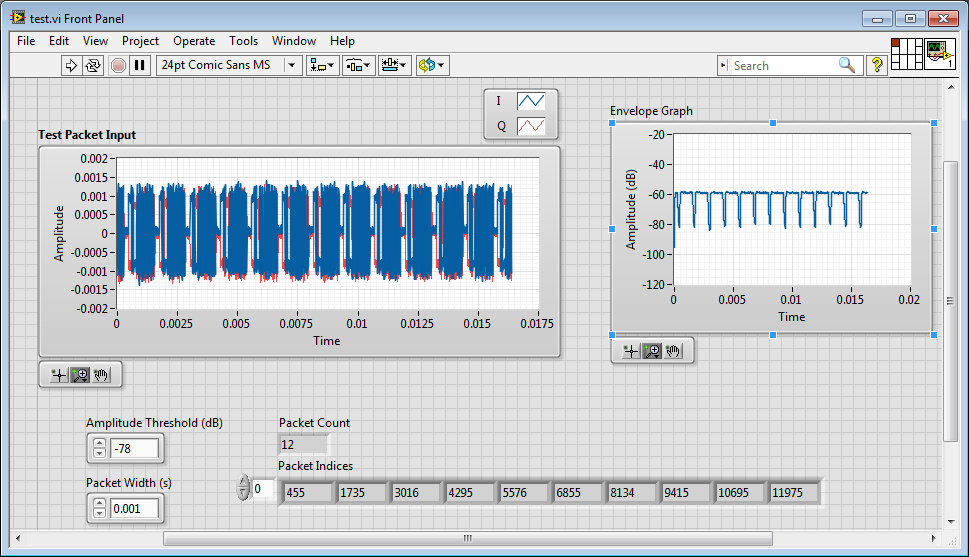
My idea was to use an envelope detector (low pass filter) and then use a detection of energy VI on the envelope.
Here is where I left
-
How to divide 3 signals which are produced by a data acquisition Wizard?
I've only been using LabVIEW for a few months without any type of training, so I don't know what's ridiculous or wrong. I checked the forum and LabVIEW help for something similar to what I want to accomplish, but I use the wrong words, questions or methods in general. No matter what help options or directions.
I expect 3 incoming signals that will be accessible by a DAQ Assistant. A signal is the complete signal, the other two are part of the complete signal. Partial signals each separately multiplied by the full signal. How to separate the signals that are in dynamic data produced by the wizard DAQ in a way that I can apply these processes?
Or, as I have already said, use the Signal from Split.
-
How to test the signal strength of an Airport Express, which extends a network?
I am trying to understand how my Airport Express is actually help to expand my network, and if I should move somewhere different. Any help would be appreciated!
Current situation: my base station is an AirPort Extreme in our apartment computer room; for the internet, which is plugged into the wall. The wifi network is extended in the living room via an AirPort Express (version 7.6.4). There are on the same cabinet as the AirPort Express to Apple TV. The Airport Express has an optical cable connecting to a sound bar (which has an additional HDMI connection to the TV).
I don't really know if the AirPort Express Terminal, he does something useful. The network is set to be extended, best I can tell: Airport Extreme network Mode is "Create a wireless network", and network Mode of the AirPort Express is "extend a wireless network. But still, the wifi on my iPad and iPhone signal strength seem to fall much in the living room. Apple TV usually broadcasts music from my desktop computer (in the computer room) well enough, but if I try to play music from my computer via the Apple Express at the soundbar, the connection is terrible and fall. (Which could be a problem with wifi, or could be an aging Airport Express question, could be a cable problem or might be a sound bar problem...)
An example of what worries me: if I go to the Airport utility on my iPhone and a glance at the Airport Extreme, it has 4 Wireless, including Apple TV clients. But if I look at the AirPort Express, there sometimes a client wireless (iPhone), but never shows the Apple TV: even if the Apple TV is about 30 cm of the Airport Express. It's as if the 30cm distant to the Airport Express connection is weaker than the connection of two-rooms-distant Airport Extreme, but I am probably wrong that.
In any case, is there a way to test what speed is through the AirPort Express, compared to through the extreme? I tried to use applications like CloudCheck on my iOS devices, but those only measure the speed of my network, and it is unclear whether or not he uses the Extreme or Express.
Thanks in advance and all apologies if I used (almost inevitably) 'Express' when I should have used "Extreme", or vice versa, somewhere at the top.
One way to see the strength of the signal is the Alt (option) key while clicking on the WiFi icon in the menu bar.
But you see not directly related to the airport of arrival. Also the Airport utility does not give much information.
You can see a lot more with the free app (Appstore) called "WiFi Scanner".
The problem could be that the place you have chosen for the Airport Express can be better: it should be somewhere in halfway (in force) between the Real and where you sit with the iPad/iPhone.
-
How to calculate the signal / noise from the graph?
In my current project, I read a periphera voltage signal. the signal lead noise even after filtering. So, to identify the necessary data, I averaged the signal.
I have attached the file with an image of graphics. In this graph, the recorded data are drawn black and medium online graph is plotted in red. Now, I have to calculate the ratio of signal to noise to specify with these peak values. How to do?
As the signal passes through zero, be careful in the way you set the signal / noise. For sinusoidal signals, that ratio is defined as the RMS value of the noise (the signal with the desired sinusoidal signal deleted) divided by the effective value of sinusoidal component.
First of all I would like to subtract the average value of the raw signal. The difference is the noise. You can set the signal / noise. A RMS calculation might work. If you have a mathematical model for the desired signal, a fitting for this model can be useful too.
Lynn
-
How to pass a signal between 2 worksheets
I created a signal evaluation sheet and I want to transmit the signal that is to assess a separate spreadsheet that generates the signal. If I use the module generator frequency to generate the signal output so how a calculation sheet and read it as an input in the other worksheet?
Bill,
You can run only one sheet at a time.
How to transfer data from one sheet to the other would be to save the data in a file. DDF is the most flexible for writing and for DASYLab replay DASYLab.
Use of the files, data group of writing and reading data. The file must already exist to configure the module for reading data.
-
How to display any signals in SignalExpress read mode?
Problem: Read showing only 1 block of samples instead of ALL the samples taken when I click 'run '.
Installation program:
Monitor / Record:
DAQmx acquire analog input (Acq Mode: continuous, 1 k samples @ 10 kHz).
Create an analogue Signal (Signal DC 100kS/s, 1000 sample block size),
DAQmx generate analog output (N samples).
Reading: Same steps as monitor / record, except DAQmx generate analog output is continuous samples 1 k samples at 10 kHz.
I dragged my data in the folder of papers according to the Instructions of Documentation Help '5. Read the data.
All data is correctly written to a PDM file and converted to ASCII. How to see the length of reading?
Use: LabVIEW SignalExpress v2.5.1 Lite, NI USB-6221
It is a very requested feature that you can't do in SignalExpress - yet. One solution is to view the log monitoring/recording mode. It is not ideal, because you can only browse the signal not to analyze. Our apologies...
-
How to amplify a signal 10VDC/35mA to a 1. exit 5a?
I want to activate a trigger of solenoid 12VDC current experimental rig with labview. However, the trigger attracts about 1.5 a at 10VDC, and my current installation with Labview can only generate a 35mA 10 VDC (0.035 A) signal to a BNC connector. What are some ways I can boost my signal current to get the current I need (1.5 a) to generate the force necessary to operate the trigger of the solenoid? I've heard suggestions on amplifiers or transistors, but I don't know what these do or how they apply to my signal from BNC connector, because I am familiar with them. Any ideas?
10V is the kind of eccentric tension; I assume that you mentioned this because it's the highest of your DAQ can go.
You mentioned the solenoid is 12v... so use 12v to the switch. At <$20 switching="" regulator="" like=""> this can suck the power to the solenoid. A power supply of 5V relay like the VE5HS-K or G5SB can handle 12V / 1. 5A power supply (30V/5 (a), while the side of the battery can be driven output 5V data acquisition. You will also need a relay as ULN2003A driver down the current of the relay coil.
Some static relays can be plugged in directly to a digital output, some play more enjoyable with the extra current to an output on the analog data acquisition. For the cost/flexibility (normally-open and normally-closed terminals) /isolement of a mechanical relay and control circuit, this is the way that I take.
Then it's just a matter of activating/deactivating the solenoid power by operating a digital line high or low in the software.
-
How to subtract one signal on the other, with the help of an oscilloscope?
I have two chaotic oscillators, which I am trying to sync. There is an oscilloscope, which channels are related to each oscillator. I need remove the signal from the oscillator-B, the oscillator signal - A, using the oscilloscope, so that I can find how much is the error between them. A - B would work very well, but there is only A + b. is it possible to do, without having to add additional circuit elements? If this isn't the case, that I would add, subtract one signal from another?
Edit: I use the classic Multisim 13.0 oscilloscope.
Hello.
You can invert the signal B-
the standard scope 2 ch a reversal for Channel B - there are 4 small buttons on the bottom of the chB instead of only 3 for chA.
Best regards
Michael
-
USB-6008, how to calibrate two signals are equal entry?
HI all, I use NI USB-6008 and evaluation of labview 8.5, using the daq assistant.
1st quarter) to calibrate the two input voltage signals become equal?
Q2) I used the comparison for example function: not equal. When the two entries get value not equal, how to output of 0-5 v output?
If someone need more information to help me, I can provide.
Not sure at all what you mean by "0-5 v output to the output. Want you the difference between the two inputs to output?
In addition, two input signals will probably never equal. It's just not something that exists in the numbers floating point on a computer. You must subtract one from the other and uses in the range and force the function to determine if they are close enough.
-
How to display the signal on a waveform graph in Labview Signal Express?
Hello
I want to display a signal in Signal Express 3.0 in a "waveform table", but don't know how to do it and I think that it may be impossible?
In Labview, there are two ways to view data, a 'waveform table' or a 'waveform graph. The great thing with 'picture of waveform' is that it allows you to set a length of history and you can see the data move to the left (option graphic strip) that samples are recovered. It works perfectly.
In Signal Express I can only select "Graph XY" or "Waveform curve" by doing a right-click of the mouse, but I can't select "table of waveform. Is it really true that it is not possible to view data in a graph of waveform "with Labview? (1 analog signal during streaming, 100 samples to read at the rate of 1 K)
Thank you in advance,
Enrique
Hi Enrique.
You are right that there is currently no graphic waveform in SignalExpress. The thing nearest you can join, is saved data under a log and then he looks one when recording (which I know this isn't quite the same interactive behavior).
For your last comment, you wrote 'waveform curve', but I guess you meant 'picture' here as well.
Sorry about that. We recently received this request, then perhaps in a future version.
Phil
-
How to trace the signal acquired against the clock all the time fixed by using Graph XY?
Hello
My goal is to trace the signal acquired against the clock all the fixed time dynamically. In General, it is like trace the waveform of the signal against the clock in a graph, but don't keep the recent 10 min waveform. My current approach is to get the timestamp by a VI and the express VI to use XY graph to make the plot. The result keep all data in the history which is not what I want. My question is that how to achieve my goal?
Thank you very much
Hao
One way to show the last ten minutes of data is to use a graphic instead of a graph. Set the size of the history of the ranking for the number of samples you acquire in ten minutes.
If you want to use the graph XY, you will need to manipulate the data yourself. If you don't want data from the last ten minutes and you want to throw all the old data, set up a circular buffer sized to hold the ten minutes of data. Once the buffer is full (after the initial ten minute break) adding a data point removes the oldest point. Make the buffer of a 2D with X data table in a line and the data Y in the next line. A queue with loss can be used in recent versions of LV to implement a circular buffer. In older versions, a driving force would be a good choice.
Lynn
-
Hi all!
I received some signals from the device. Also, I had a known standard signal. My problem is: How can I choose one (signal receiceved), which is comparable to a standard signal with the slightest mistake?The picture attached here, the yellow graph in bold is reference (standard). How to make a decision: which other graphics is the closest to the reference curve?
Thanks for all your help!
MC
This is why I post the photo, I have no 7.1 (no more), this response took more time to write code for this new thing ;-)
the mse.vi is located in the section of mathematics-statistics
the rest is digital, table and waveform
PS: the help section and search functions are the tools to look at
Congratulations to welcome
-
How to select the signals from the output of a DAQ assistant
Hello!
I am a new user of Labview 8.5 and I work with a USB-6210. I have two different instruments connected to the same USB device, half of the channels are used for the transducers of pressure where I only need reed and record data, while the other half are associated with TCD detectors where I need to perform an analysis of the signal to get and save the data. I'm in the first stage of construction the block diagram, once I have defined each of the signals that its correspondent of channel using the DAQ assistant, I need to select and separate the signals coming from sensors of pressure from those who come by the TCD detectors, before that I can continue to draw the block diagram. I am using the function select Signal, but I don't know how to do this. Can you get it someone please let me know at least in which manual, I can find a good explanation? I have read the getting started and the LabView user manual, but they have not been very helpful so far.
Thank you!
I fixed it. As you say, I had some mistakes in the thread, but it's working now. Thank you very much for your help! It was very useful.
-
How to read a signal of temperature continuous of a pyrometer via RS - 232
I am currently reading and chart of a pyrometer Pyrofiber Lab that arrives via an RS - 232, a continuous signal cable. As much as I know there is no device driver for this instrument (or any other pyrometers).
If I the pyrometer measures alone I can get these in LabView using the Assistant Instrument i/o, but only as a string reading ABC ' 'value emmisivity' "" "corrected for the temperature" "and not as individual numbers or data that I can use/chart. If I have the pyrometer in high mode baud rate (which is the mode in which I need), I can't read the signal at all. How can I get LabView to read continuous (and save or graphic) of the input signal? And is it possible to analyze the signal when it comes as a string with ""time""emissivity""temperature""fixed temperature "?
I am very new to LabView (and programming in general), so that advice on a good place to start would be appreciated.
You should start by reading the manual of programming. Instruments of series such as this one are unique in how the communication interface is implemented it is quite difficult to give any kind of specific help. I suggest that you start to read/control from a program of emulation of terminal as Hypertermina, Procomm, etc before attempting to write code. Then, you can view examples of shipping communication series to see how you could write the program. Personally, I have never used the Instrument i/o Assistant.
p.s. attaching the manual would go a long way to get more help.
Maybe you are looking for
-
I downloaded iStat, a few hours ago and was surprised to see the GPU clocked at 128°C, especially compared to the other time reasonably cool. I downloaded the demo of TGpro and I get the same result of temp. I restarted the apps, the mac, started fro
-
Brand new Mac. How will I know if something needs to be updated?
-
Make sure that 'tour windows xp' appear again for a specific user
When I create a new account, a little balloon appears in the bottom right of the screen next to the notification area that says 'Windows XP Tour'. After awhile, she disappears. Is it possible to bring it back and make it stay there all the time? How
-
updated windows 10 aftr can I loss my software license
updated windows 10 aftr can I loss my software license please tell me
-
anyone having problems with the junk e-mail filter in hotmail or msn Explorer
anyone having problems with the junk e-mail filter in hotmail or msn Explorer