How to measure/estimate bias of the signal
Dear Sir
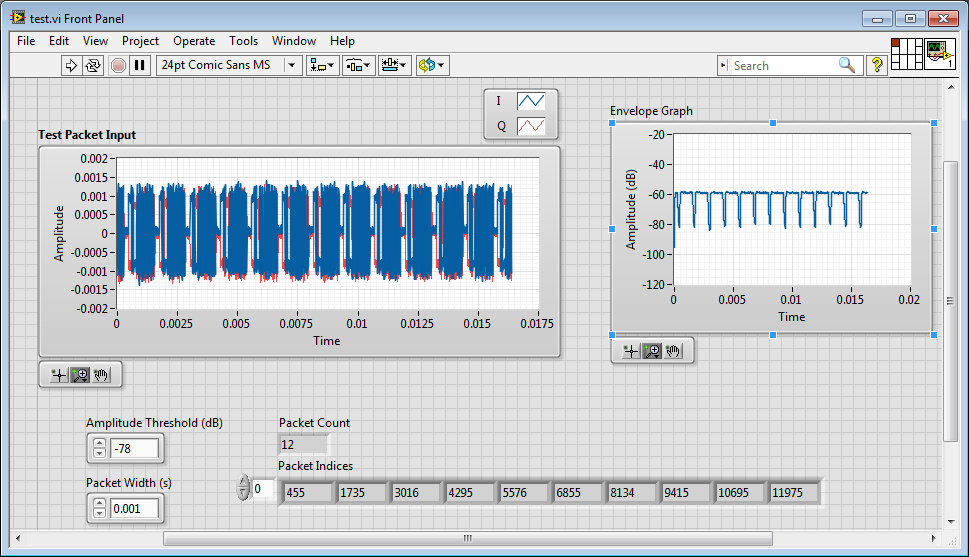
I play the FFT of the signal that collects in real time of the hall effect current tranceducer SCT-013-005. I need to measure/estimate bias of this signal. Can you please guide me how I can do it. (My vi which is developed in LabVIEW 2012 is attached)
I'll be grateful to you for your attention and consideration.
Kind regards
Urfee
Hi tronoh,.
What about using the function 'Basic average DC & RMS' on your periodic signal?
Tags: NI Software
Similar Questions
-
How to generate a pulse with the signal generator?
Hello
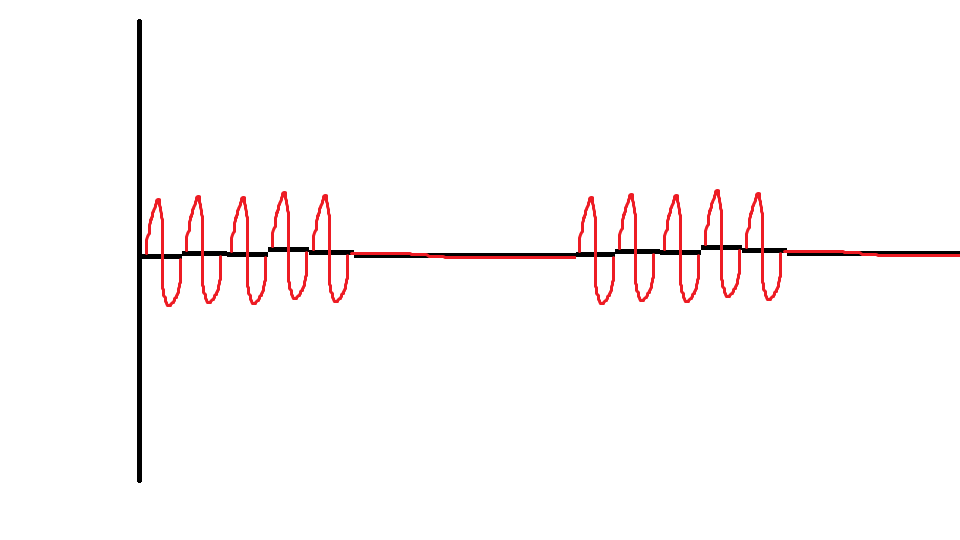
I would like to ask if anyone knows how to use the Elvis platform to generate a regulated pulse wave?
It should look roughly like the picture above. A sine wave with the regulation.
Anyone who can answer my question please respond to my post.
Thank you.
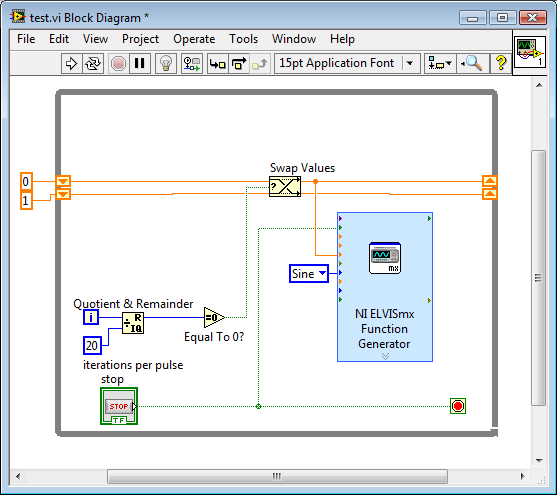
You are using LabVIEW to generate the waveform or using the Soft front panels? In LabVIEW, you can use the express VI generator function and specify the Type as "Sine". Then, simply change the amplitude of the sine wave. During the actual pulse, the amplitude would be what you want (i.e. 1 V) and while the pulse is idle, set the amplitude to 0.
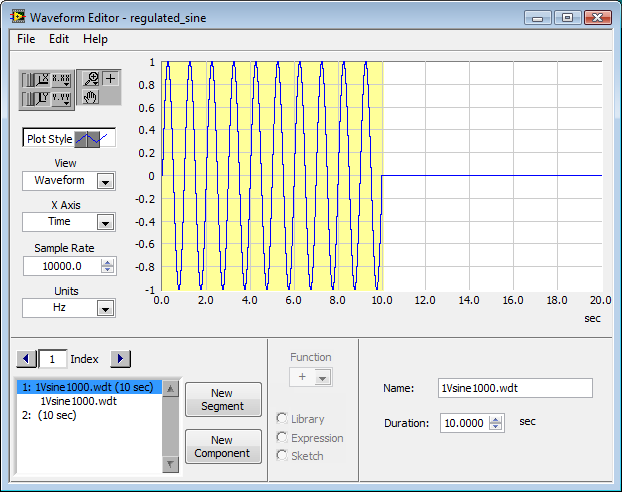
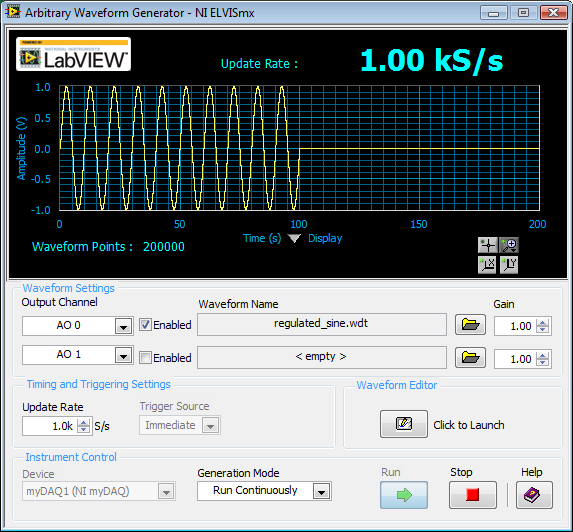
If you use the soft front panels, you can use the Waveform Editor to create a waveform that includes a sine wave for the length of your pulse and then the values of '0' for the rest of the time. Then use this waveform in the flexible front of the arbitrary signal generator. Simply create a component of sine as the first part of the wave and then add another element to a level DC '0' for the rest.
-
How to control each channel of the signals emitted by the generator of digital waveforms?
Generator has digital waveforms of 8 channels. I need to generate two different signals for HSDIO. How to change and control two different ways? In addition, how to translate pinout of the PXI-6541 to channels? I need pin 1,3,29 and 31 control signal individually.
Thank you!!
You need to combine your personal data in a table. The digital waveforms is simply a numeric representation of the binary table. It always boils down to bit 0 of each element of the array will channel 0 (or the first string that you specify in creating dynamic channels). The next bit goes to the next channel. My last post is very clear. To display the table in binary, right-click on a table element, then select the display Format, then select binary. You can also right click on the element, select Visible, then select Radix Show to display the small b before the number. One last thing, in the display Format window, uncheck the box next to the minimum field width to use. Then set the digital just below zone 8. Then select Pad with zeros to the left in the box below.
You should not use waveforms up to what learn you more about how the HSDIO operates on the input data. It is not difficult to combine waveforms, but it is not as clear as it is using an array of U8, U16 or U32.
Trying to explain further. The first number to be written to the HSDIO will have this effect: Bit 0 (LSB) of the number is written to the first HSDIO string you specify. Bit 7 is on channel 8, you specify. If you specify no 8 channels, the bits download ignored. If wiring in a certain number will produce only a single bit on each channel. In other words, the number has already combines the bits of all channels that you specify. Combine you do nothing yourself. Return to my photo on my last post. By wiring in a table, you cause a binary model must be generated.
I hope that is more clear.
-
How to calculate the signal / noise from the graph?
In my current project, I read a periphera voltage signal. the signal lead noise even after filtering. So, to identify the necessary data, I averaged the signal.
I have attached the file with an image of graphics. In this graph, the recorded data are drawn black and medium online graph is plotted in red. Now, I have to calculate the ratio of signal to noise to specify with these peak values. How to do?
As the signal passes through zero, be careful in the way you set the signal / noise. For sinusoidal signals, that ratio is defined as the RMS value of the noise (the signal with the desired sinusoidal signal deleted) divided by the effective value of sinusoidal component.
First of all I would like to subtract the average value of the raw signal. The difference is the noise. You can set the signal / noise. A RMS calculation might work. If you have a mathematical model for the desired signal, a fitting for this model can be useful too.
Lynn
-
How to test the signal strength of an Airport Express, which extends a network?
I am trying to understand how my Airport Express is actually help to expand my network, and if I should move somewhere different. Any help would be appreciated!
Current situation: my base station is an AirPort Extreme in our apartment computer room; for the internet, which is plugged into the wall. The wifi network is extended in the living room via an AirPort Express (version 7.6.4). There are on the same cabinet as the AirPort Express to Apple TV. The Airport Express has an optical cable connecting to a sound bar (which has an additional HDMI connection to the TV).
I don't really know if the AirPort Express Terminal, he does something useful. The network is set to be extended, best I can tell: Airport Extreme network Mode is "Create a wireless network", and network Mode of the AirPort Express is "extend a wireless network. But still, the wifi on my iPad and iPhone signal strength seem to fall much in the living room. Apple TV usually broadcasts music from my desktop computer (in the computer room) well enough, but if I try to play music from my computer via the Apple Express at the soundbar, the connection is terrible and fall. (Which could be a problem with wifi, or could be an aging Airport Express question, could be a cable problem or might be a sound bar problem...)
An example of what worries me: if I go to the Airport utility on my iPhone and a glance at the Airport Extreme, it has 4 Wireless, including Apple TV clients. But if I look at the AirPort Express, there sometimes a client wireless (iPhone), but never shows the Apple TV: even if the Apple TV is about 30 cm of the Airport Express. It's as if the 30cm distant to the Airport Express connection is weaker than the connection of two-rooms-distant Airport Extreme, but I am probably wrong that.
In any case, is there a way to test what speed is through the AirPort Express, compared to through the extreme? I tried to use applications like CloudCheck on my iOS devices, but those only measure the speed of my network, and it is unclear whether or not he uses the Extreme or Express.
Thanks in advance and all apologies if I used (almost inevitably) 'Express' when I should have used "Extreme", or vice versa, somewhere at the top.
One way to see the strength of the signal is the Alt (option) key while clicking on the WiFi icon in the menu bar.
But you see not directly related to the airport of arrival. Also the Airport utility does not give much information.
You can see a lot more with the free app (Appstore) called "WiFi Scanner".
The problem could be that the place you have chosen for the Airport Express can be better: it should be somewhere in halfway (in force) between the Real and where you sit with the iPad/iPhone.
-
measurement of the phase of the signal
Hi all
I'm trying measureme the phase of the sine wave.
I produced sine waveform and give '' measure spectral '' VI express to measure the magnitude and phase. The block of spectral measure gives picture of the spectrum amplitude and phase with the difference in frequency of 1 Hz.
The input signal is 10 Hz sine wave. so I checked the 10th item in the table of phase and amplitude. I'm getting the right size. but I get different values for phase measurement
For example, if the input signal of 0 degrees phase shift, the spectral measure gives as-90 degree. If the input signal has the phase shift of 20 degrees, the measure blocks gives as-70 degrees.
I can't able to find that how to pass this phase-90 degree occurs.
Kindly help to solve. I thank in advance.
with respect,
Renaud V
Renaud V,
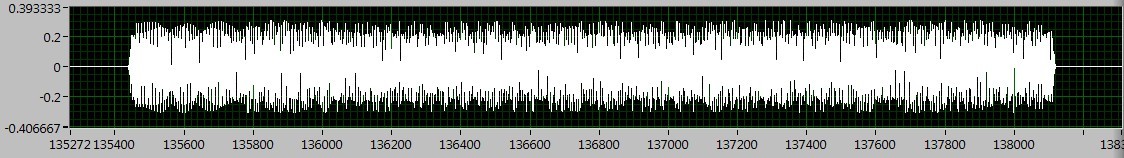
The spectral measurement VI uses the FFT internally. In the detailed help for the FFT, the following definition is displayed:
Note that exp(-j*2*pi*theta) = cos(2*pi*theta) - i * sin(2*pi*theta). This phase shift is defined in respect to the cosine, and non sine, explaining the 90-degree turn.
Lynn
-
How to measure the frequency of a clock using meter in LabVIEW?
Hi guys,.
Someone knows how to measure the frequency of a signal introduced in LabVIEW (in the FPGA PXI-7813R), using a counter in LabVIEW?
Essentially, I want to use this counter as a kind of Logic Analyzer.
Thank you, Anoop
I don't know what you mean by "manual". It is all managed in a housing structure.

-
How to measure the width of pulse with MyRIO
Hello
Sorry in advance if this is not the most appropriate forum. I'm not entirely sure if it's a more general problem of 'software' or the MyRIO-specific. I have searched the forums and found a few related topics but could find no one who help me in this context.
I'm trying to measure the width of a sensor pulse ultrasonic ping. It emits a signal conditioning - the time that it is high directly corelates how far is the object. Being new to LabVIEW I am confused as to how do I calculate the time it remains high.
I read that LabVIEW should not need to 'variables' as in python or C, for what is the best way to measure time, the signal is high? Normally, I'd go (new_time - old_time), but obviously I can't store an old time in LabVIEW as I would in python or C.
Other notes:
I have the sensor correctly ping echoing and I can see the blips on a chart and see a perfectly square wave valid.
To answer your question on how you would in LabVIEW...
While LabVIEW has not stated/named variables that you have in a language based on text, the data is stored on the wires. You can use the nodes as node registers or shift of feedback to store values between iterations of a loop:
(this will keep subtracting y (starting with 0) and store the result for the next time it runs)
LabVIEW also has functions in the range of mathematics/signal processing to make the detection of pulse on a waveform.
-
Cisco Aironet 1131AG and measure access points to the power of the wireless signal?
/ * Style definitions * / table. MsoNormalTable {mso-style-name : « Table Normal » ; mso-tstyle-rowband-taille : 0 ; mso-tstyle-colband-taille : 0 ; mso-style-noshow:yes ; mso-style-priorité : 99 ; mso-style-qformat:yes ; mso-style-parent : » « ;" mso-rembourrage-alt : 0 à 5.4pt 0 à 5.4pt ; mso-para-marge-top : 0 ; mso-para-marge-droit : 0 ; mso-para-marge-bas : 10.0pt ; mso-para-marge-left : 0 ; ligne-hauteur : 115 % ; mso-pagination : widow-orphelin ; police-taille : 11.0pt ; famille de police : « Calibri », « sans-serif » ; mso-ascii-font-family : Calibri ; mso-ascii-theme-font : minor-latin ; mso-hansi-font-family : Calibri ; mso-hansi-theme-font : minor-latin ;}
/ * Style definitions * / table. MsoNormalTable {mso-style-name : « Table Normal » ; mso-tstyle-rowband-taille : 0 ; mso-tstyle-colband-taille : 0 ; mso-style-noshow:yes ; mso-style-priorité : 99 ; mso-style-qformat:yes ; mso-style-parent : » « ;" mso-rembourrage-alt : 0 à 5.4pt 0 à 5.4pt ; mso-para-marge-top : 0 ; mso-para-marge-droit : 0 ; mso-para-marge-bas : 10.0pt ; mso-para-marge-left : 0 ; ligne-hauteur : 115 % ; mso-pagination : widow-orphelin ; police-taille : 11.0pt ; famille de police : « Calibri », « sans-serif » ; mso-ascii-font-family : Calibri ; mso-ascii-theme-font : minor-latin ; mso-hansi-font-family : Calibri ; mso-hansi-theme-font : minor-latin ;}
We have about forty points of access Cisco Aironet 1131AG spread over four floors and they all have a static IP (BVI1) on the same SSID, customers will be on its own virtual local area network (dhcp on 3750 switch) and they use several channels (1,6,11). Cisco Wireless Control System is pending. This wireless network should support roaming for customers (there will be Wi - Fi tags of multiple AeroScout and wireless laptops). To measure the strength of the wireless signal and wireless coverage on each floor. My questions are:
- How to measure the strength of the wireless signal: we must meet at least three APs available with signal excellent (I guess for the WCS needs that will determine the position of the client in the building)? We thought to use NetStumbler and a few laptops with wifi and measure as many points as we can as simpler thing. Or should we use something like Cisco Aironet Client adapters for our mobile phone and then use Cisco Aironet Client Utility (is it worth buying for our analysis and measurement)? Any other idea?
- What signal level should we consider for a good wireless (dBm)?
- That we should propose for authentication, authorization and management accounting? What happens to the roaming wireless? I did not quiteunderstand WCS, WDS and WLC-that should be used for above tasks?
Thanks in advance.
"Use the command on the AP" sh dot11 associations "will give you the clients associated with success. If you add the MAC address of the client at the end of the command, you will get detailed information. Look under "Signal Strength" and "Signal to noise". Under the strength of the Signal, you want a value of-75 dBm or lower (lower values the better). -76 dBm and is bad. Under Signal-noise, you want a value of 25 dBm or more (values higher the better).
To measure the strength of the signal, I use Airmagnet, but you can use Netstumbler or Cisco Wireless Site Survey.
-
Satellite 1800-814: how to measure the temperature of the processor?
I replaced the radiator component on my laptop as it freezes suddenly during the operation. Now everything seems to be better, but still a last question. How to measure the temperature of the processor?
Dominic displays only HDD temp and MBM profile for 1800-224 display cases and the cpu. But if I can use this profile? Any other ideas how to meausre CPU temp?
MBM shows me around 40 to 49 ° C for the cpu. Is this normal or too high just to run windows?
Thanks in advance
Greetings
Jens GriegerHello
See this http://forums.computers.toshiba-europe.com/forums/thread.jspa?threadID=5564&messageID=19417
Maybe the help!
-
How to check the power of the signal to an extended airport
I have 2 Airport extreme. (new 802.11ac versions)
We're at the bottom, connected to a cable modem, and the other is implemented as an extension to the floor.
6.3.6 Airport utility I can click on a base station and place the cursor on a connected client and see the quality of the connection to this computer / iOS device.
I would like to see the quality of the signal to the base station to the floor, so I can move it around to get the best signal.
Is it possible to see this value? The only thing I can think to do is to stop the base station to the floor and move a laptop or iPhone around up there and check it is the strength of the signal and take the strongest spot is the best place to put the Extender.
Thanks for any help.
If you point to a connection, it should show some details. Where mine says excellent.

Of course, the old utility was much more useful. It will give you signals at both ends... and you can start a second screen and put them side by side. Subsequently is not always better in Apple utilities...

If you do a google search 5.6.1 utility yosemite
You will find how to install it... work on el capo as well.
Is it possible to see this value? The only thing I can think to do is to stop the base station to the floor and move a laptop or iPhone around up there and check it is the strength of the signal and take the strongest spot is the best place to put the Extender.
The use of the office phone or laptop running a wifi Analyzer is also a very good way to do it... the signal is not different... in other words the place that is best for one device will be also the best for another... This also gives you a way to attach numbers to signal loss in any particular area.
-
How to extract the signal from the waveform of my power level designated?
Hi all
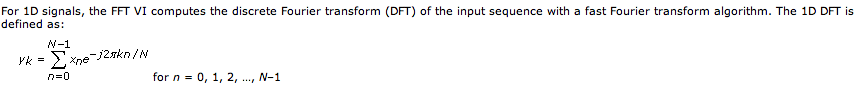
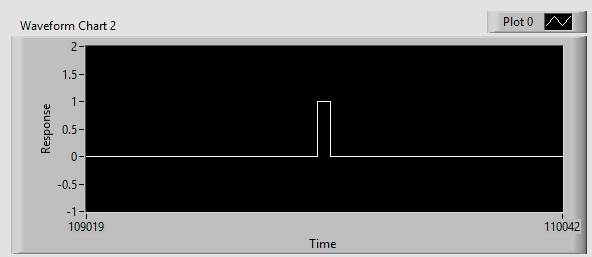
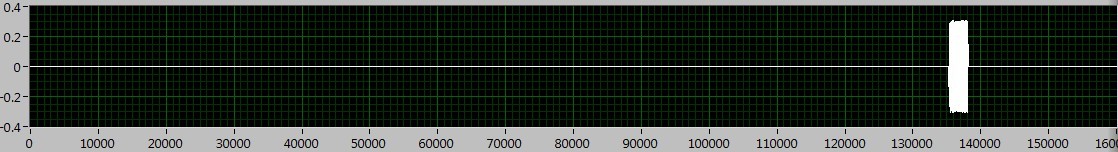
How can I extract the signal of the waveform accroding to the power level? I read the Trigger & Gate .vi, but this vi retrieves the signal duration. I want to extract the signal depending on the power level.
As shown in the following figures, the signal I want to deal with is between 130000 to 140000, if I Zoom, I can see the useful signal is between 135400 to 138200. The question is how to extract the signal in the area?
I tried the sub_NoiseEst_And_Chop_Shell.vi in the example of Packet_based_link also, but this Subvi seems to be a bit slow. Can someone give me the best advice? Thanks in advance!
I'm working on something similar, but have not had time to fully develop.
My idea was to use an envelope detector (low pass filter) and then use a detection of energy VI on the envelope.
Here is where I left
-
How to measure the frequency of NOR-DAQmx RPM tasks
Hello
I'm trying to measure the frequency using the NI DAQmx task and then convert it to a RPM if possible.
I have the following material available to me.
I have a block SCXI-1327 terminal, as well as a 6289 PXI multifunction data acquisition Module SCXI 1126.
I wired in a mag ai7 sensor on my 1126 and then of the passage of an object metal I get a range of 6-8, so I am able to read the mag sensor.
What I'm trying to do is somehow convert this analog measurement a RPM using the NI DAQmx task only.
Any help would be appreciated.
Hi, smooth,
Yes, you would select linear, then put in the result of this calculation of the slope.
The Manual recommends a minimum frequency of at least 15 Hz for setting low range. This card is not really designed to measure the frequency for a single pulse over a long period of time.
The number of LAPS down (assuming one pulse per turn) that we recommend that you measure with the 1126 is so 900 RPM. If you need measure low revs, and you cannot increase the number of impulses per turn, you could consider either read the signal as an analog waveform, or if it's a digital pulse, using a counter to basic task. In this way, you can use any method you want to handle the situation where there is only a single pulse in a long time.
-
How to trace the signal acquired against the clock all the time fixed by using Graph XY?
Hello
My goal is to trace the signal acquired against the clock all the fixed time dynamically. In General, it is like trace the waveform of the signal against the clock in a graph, but don't keep the recent 10 min waveform. My current approach is to get the timestamp by a VI and the express VI to use XY graph to make the plot. The result keep all data in the history which is not what I want. My question is that how to achieve my goal?
Thank you very much
Hao
One way to show the last ten minutes of data is to use a graphic instead of a graph. Set the size of the history of the ranking for the number of samples you acquire in ten minutes.
If you want to use the graph XY, you will need to manipulate the data yourself. If you don't want data from the last ten minutes and you want to throw all the old data, set up a circular buffer sized to hold the ten minutes of data. Once the buffer is full (after the initial ten minute break) adding a data point removes the oldest point. Make the buffer of a 2D with X data table in a line and the data Y in the next line. A queue with loss can be used in recent versions of LV to implement a circular buffer. In older versions, a driving force would be a good choice.
Lynn
-
How to select the signals from the output of a DAQ assistant
Hello!
I am a new user of Labview 8.5 and I work with a USB-6210. I have two different instruments connected to the same USB device, half of the channels are used for the transducers of pressure where I only need reed and record data, while the other half are associated with TCD detectors where I need to perform an analysis of the signal to get and save the data. I'm in the first stage of construction the block diagram, once I have defined each of the signals that its correspondent of channel using the DAQ assistant, I need to select and separate the signals coming from sensors of pressure from those who come by the TCD detectors, before that I can continue to draw the block diagram. I am using the function select Signal, but I don't know how to do this. Can you get it someone please let me know at least in which manual, I can find a good explanation? I have read the getting started and the LabView user manual, but they have not been very helpful so far.
Thank you!
I fixed it. As you say, I had some mistakes in the thread, but it's working now. Thank you very much for your help! It was very useful.


Maybe you are looking for
-
JAVASCRIPT TURNED OFF SUDDENLY. CANNOT BE ENABLED
All of a sudden, I can't get into Facebook. Message says javascript is disabled. When I foillow the instructions on this web site to allow it, told me to go to 'Options', but it isn't here under preferences - content or tools - content. I have reinst
-
How can I add text to photos save to JPEG? The photos have been imported into my computer from a mobile phone
-
System administrator has set policies to prevent this installation for updated Zune softwear
Try installing the latest Zune software and I get a warning that the system administrator has set policies to prevent this installation. How can I find these policies?
-
Connection of 10 x SFP - 10 G-SR-S to an Interface of 1 G
Hello I have a router ISR4451-X, which comes with 4 x 1GE interfaces, and I want to connect it to a switch C4500-X, which comes with 16 x 10 G interfaces. I use SFP - 10 G-SR-S on the C4500 and want to know what SFP module, I need to use on the ISR44
-
Smartphones blackBerry how to cancel auto text?
could not find it... I want to type the words without automatic text Thank you