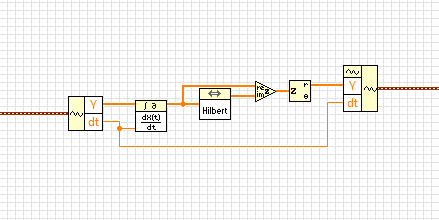
measurement of the phase of the signal
Hi all
I'm trying measureme the phase of the sine wave.
I produced sine waveform and give '' measure spectral '' VI express to measure the magnitude and phase. The block of spectral measure gives picture of the spectrum amplitude and phase with the difference in frequency of 1 Hz.
The input signal is 10 Hz sine wave. so I checked the 10th item in the table of phase and amplitude. I'm getting the right size. but I get different values for phase measurement
For example, if the input signal of 0 degrees phase shift, the spectral measure gives as-90 degree. If the input signal has the phase shift of 20 degrees, the measure blocks gives as-70 degrees.
I can't able to find that how to pass this phase-90 degree occurs.
Kindly help to solve. I thank in advance.
with respect,
Renaud V
Renaud V,
The spectral measurement VI uses the FFT internally. In the detailed help for the FFT, the following definition is displayed:
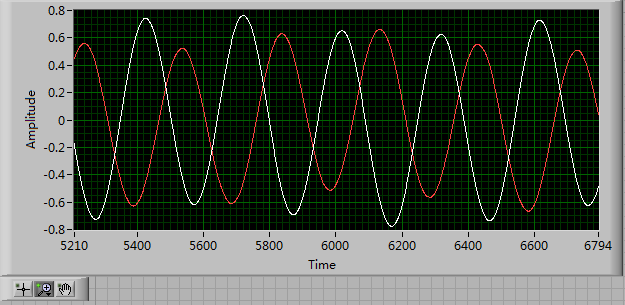
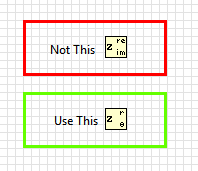
Note that exp(-j*2*pi*theta) = cos(2*pi*theta) - i * sin(2*pi*theta). This phase shift is defined in respect to the cosine, and non sine, explaining the 90-degree turn.
Lynn
Tags: NI Software
Similar Questions
-
Hello world!
First of all, I use a USRP as a transmitter to emit a sine wave (the signal is exp(j2*pi*f*t)), and then I use the external clock to synchronize the two USRPs (Ref as PPS in are connected to the clock) as receivers. Receivers are in sync, and they are at the same distance from the transmitter, I thought that the signal they receive should have a nearly the same phase. However, in practice, the phase shift is big enough, and this problem really confuses me.
It's the received signals of 2 receivers.
Yes. What you observe is expected.
Near the bottof of this document read the area 'alignment Phase vs Phase coherence '.
http://www.NI.com/white-paper/14311/en/
And also, for the alignment phase, see the following 'Angle of arrival detection with NI USRP '.
https://decibel.NI.com/content/docs/doc-25716
Erik
-
Is it possible to predict the shape of the signal at position B by the measure in a position?
Hi, I need to know the shape of signal and position phases B, but I have only a single antenna to a position, which is of the form 1 m B. The signal is a source far away. I think that it is possible to predicte it.
Like this: first transformation the signal received at A time in the field of fourier-domain, then caculation phase changes of the components of frequency between A and B. After that turn it into time domain, it should be the series of signals to frequency B.
I simulation Matlab process, but it seems that he has a problem. What is the problem with this method? Are there methods to achieve this coming? Any response will be appreciaged.

If your antennae are in free space so that you can assume that you have not all paths multiple problems, so it shouldn't be too difficult to predict the relative phase between A and B.
You should know the angle between the line from A to B and the B line to the source. You need to know the wavelength. You need to do a few trigonometry. In the simple case where all three are collinear phase shift is 2 * pi * (spacing of A - B) / wavelength. For the other angles, you will need to calculate the appropriate triangle.
If the signal has a complex modulation, especially if it signals a wideband, there may not be any simple way or simple to calculate the phase shift.
Lynn
-
How to measure/estimate bias of the signal
Dear Sir
I play the FFT of the signal that collects in real time of the hall effect current tranceducer SCT-013-005. I need to measure/estimate bias of this signal. Can you please guide me how I can do it. (My vi which is developed in LabVIEW 2012 is attached)
I'll be grateful to you for your attention and consideration.
Kind regards
Urfee
Hi tronoh,.
What about using the function 'Basic average DC & RMS' on your periodic signal?
-
low Harmonic frequencies in the signal strength
Hi all
I try to know what are the causes of noise in my signal, whether it's a faulty hardware or my lack of knowledge.
The system that I'm actually consist of two engines not to not (parker HV232) that provide the uprising due to frost harmonic + pitch motion with phase shift of 90 degrees (a kind of movement of fish tail beat). I have a load cell 3 - axes attached to the shaft of the motor, pitch, and it measures up, drag and torque on a plateau which oscillates in the tunnel water (oscillation is provided by these two Steps). Tunnel to provide the incoming stream.
Signals of strength are captured through SG-23 + PXI-6221 daq card, I put the gain on the last of them to +/-200 mV for better resolution.
When the engines are turned off, the noise level on the static signal is the threshold of resolution, and nothing strange is not shown in the signal, and its ghosts.
The problems begin when I initialize the motion on the steppers, FFT of the watch signal of the low frequency spikes that are exact multiplies the frequency of oscillation, I have attached a PDF for example.
Disengage amplifier/filter which was suggested by manufacturing, and suspect I have observed could be due to this I'm not sure at 100%. The VI I use filter band-pass data in the 0.2 to 6 Hz, but somehow I can still see noise beyond 6 Hz.
I was wandering perhaps someone has experience with similar issues and can suggest a solution on how to get rid of these harmonics.
Thanks in advance
I'm not an expert in the dynamics of the tunnel, but from what you say, it looks like they can't be noise but components generated due to the rotation of a mechanical Assembly. Normally people refer to these harmonics in the form of 'order', which means that they are a multiple of the frequency of rotation.
So maybe it's the attacker
1. check by an expert (the one that includes the mechanical system that you are using) that to the point where you measure the force will not get the components of the order.
2. understand what exactly is the measurand. What exactly do you want to do with the measured signal (RMS, FFT etc..) Then you will be able to figureout if components of the order may affect your measurement.
Oleks wrote:
Disengage amplifier/filter which was suggested by manufacturing, and suspect I have observed could be due to this I'm not sure at 100%. The VI I use filter band-pass data in the 0.2 to 6 Hz, but somehow I can still see noise beyond 6 Hz.
During filtration, the attenuation in the band determines how fast the signals will be thinning of the hard shoulder.
-
Measurement of the envelope of the AC
Hi guys,.
I have a cDAQ-9188 with a NI9205 analog input module. I am able 3 AC 10 kHz differential signals and two of them are amplitude modulated at a low frequency of<1Hz through="" mechanical="" movement="" of="" a="" rotary="" transformer.="" does="" anyone="" know="" a="" way="" to="" measure="" the="" envelope="" of="" the="" modulated="" signals="" in="" a="" simple="">
I was thinking about sampling to ~ 25 kHz and and calculate RMS values each 500 samples, however, in time, I get the 500 samples the mechanical system moves a few (2) so the data are useless.
The brute force approach would be to sample at 25 kHz for the complete tour of the mechanics, but gives me a large amount of data and my tampons could get cluttered with her. Even with these data, I'd still need to extract the envelope in some way.
I look forward to any entries.
Thanks, Felix
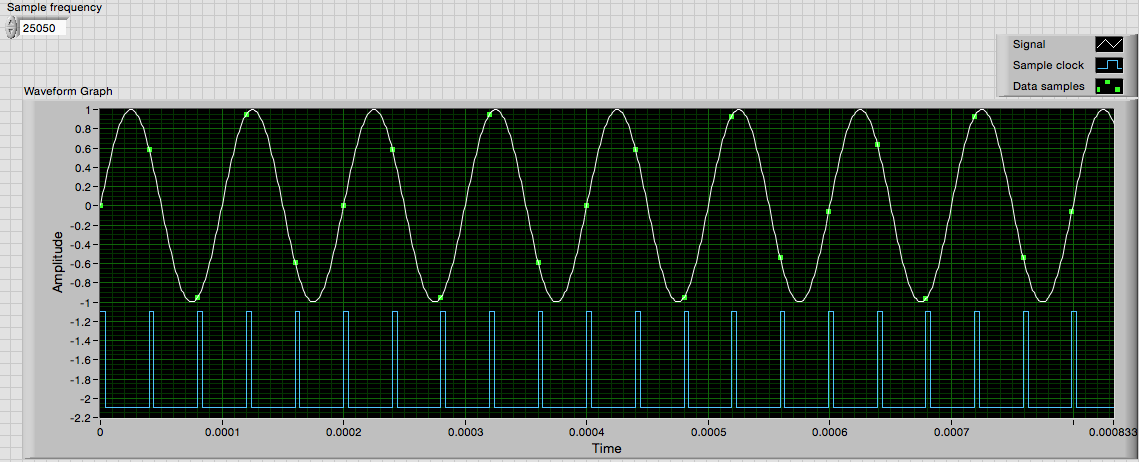
Felix,
Let's look at some numbers: 20 RPM is equivalent to 0.333 tr/s or 1200 (intervals of 0.1 °) / s. So there are 833 US for unit rotation of 0.1 degree. It's time 83 10 kHz signal cycles.
The next question is: Can you get information good range of 83 cycles?
During the sampling of a 10 kHz to 25 kHz signal you get 2.5 samples per cycle, or samples are apartment 144 °. The image below shows that sampled data resembles a 25050 sampling frequency. I adjusted the sampling frequency slightly so that the sampling points are not repeated exactly every cycle, as they do at exactly 10 and 25 kHz. Unless the two signals is derived from the same clock, there will be a slight frequency shifts.
Notice that none of the points shown sample place exactly on the summits.
Extract only your Information.vi accepts an input signal and returns the amplitude, frequency and phase of the signal. I ran some tests to see how much data is needed to get good results. The data displayed in the image above - 21 samples - set Gets the amplitudes with lower to +/-1% error. He treats (simulated) 3 seconds of data in a little more than half a second.
I would like to know what version of LV, you use so I can post an example for you.
Lynn
-
App to determine the "Signal strength" airport
I have 1 Airport Extreme Base Station (5th generation) in my house.
I have a 2nd Airport Extreme Base Station (also 5th generation) in a separate building in my back yard.
The 2nd airport is connected to the airport 1 via an Ethernet Cable that runs through an underground conduit.
I'm sure I used to have an App on my iPhone that would check the 'intensity of the airport Signal' as opposed to the 'speed '.
Maybe it was on my old iPhone 4S & it was never transferred to the iPhone 6 Plus?
Whatever it is, I can't seem to find the app anywhere.
Does anyone have an idea on what this app can have been called or who made it?
Any help would be greatly appreciated.
iOS does not allow access to the wifi signal measures last I checked...
However, I can recommend the app Netspot (PC/Mac friendly) to measure the signal wireless throughout your home.
-
How to test the signal strength of an Airport Express, which extends a network?
I am trying to understand how my Airport Express is actually help to expand my network, and if I should move somewhere different. Any help would be appreciated!
Current situation: my base station is an AirPort Extreme in our apartment computer room; for the internet, which is plugged into the wall. The wifi network is extended in the living room via an AirPort Express (version 7.6.4). There are on the same cabinet as the AirPort Express to Apple TV. The Airport Express has an optical cable connecting to a sound bar (which has an additional HDMI connection to the TV).
I don't really know if the AirPort Express Terminal, he does something useful. The network is set to be extended, best I can tell: Airport Extreme network Mode is "Create a wireless network", and network Mode of the AirPort Express is "extend a wireless network. But still, the wifi on my iPad and iPhone signal strength seem to fall much in the living room. Apple TV usually broadcasts music from my desktop computer (in the computer room) well enough, but if I try to play music from my computer via the Apple Express at the soundbar, the connection is terrible and fall. (Which could be a problem with wifi, or could be an aging Airport Express question, could be a cable problem or might be a sound bar problem...)
An example of what worries me: if I go to the Airport utility on my iPhone and a glance at the Airport Extreme, it has 4 Wireless, including Apple TV clients. But if I look at the AirPort Express, there sometimes a client wireless (iPhone), but never shows the Apple TV: even if the Apple TV is about 30 cm of the Airport Express. It's as if the 30cm distant to the Airport Express connection is weaker than the connection of two-rooms-distant Airport Extreme, but I am probably wrong that.
In any case, is there a way to test what speed is through the AirPort Express, compared to through the extreme? I tried to use applications like CloudCheck on my iOS devices, but those only measure the speed of my network, and it is unclear whether or not he uses the Extreme or Express.
Thanks in advance and all apologies if I used (almost inevitably) 'Express' when I should have used "Extreme", or vice versa, somewhere at the top.
One way to see the strength of the signal is the Alt (option) key while clicking on the WiFi icon in the menu bar.
But you see not directly related to the airport of arrival. Also the Airport utility does not give much information.
You can see a lot more with the free app (Appstore) called "WiFi Scanner".
The problem could be that the place you have chosen for the Airport Express can be better: it should be somewhere in halfway (in force) between the Real and where you sit with the iPad/iPhone.
-
Wrong time file Express with NI9361 medium Freq dynamics of the signal
I have an interesting problem with recoding of the frequency to a file with SignalExpress measures and a NI9361. I was able to find a workaround, but here's the question:
As in the attached SignalExpress project, I'm analog acquisition of voltage using a NI9234. In this case, the module is in place only for the/cDAQsim/I/SampleClock channel exist for my next step to reference. I'm also acquisition of previous frequency with the NI9361 in dynamic mode with an average using the reference to external clock of the analog input stage. Then I have a backup at the ASCII stage where I want to write a file leave ASCII, comma with absolute time.
That's the problem. In this case, I cared only to save the frequency to the file. But, when I did the absolute time would count per second for 100 points, then loop back at once and County place again. (See attached Test01.csv.) This is the same behavior that if I tried to record data using just the NI9361 without an external sample clock.
If instead, the save operation I take FIRST entry then the frequency I will get a file with the correct absolute time as Test02.csv analog, attached. Even if I save the frequency as the first entry and then return to tension the problem at the time scale.
Anyone know why that would happen? Is there a simpler way for the frequency measures stamped recored with the NI9361 and SignalExpress without analog data recording? without using an analog input module at all?
Hello
This question looks better suited for the Signal Express community forum page. Please ask your question here.
Thank you
-
Range of the signal DAQmx outdated?
It could be me not quite understand the works of ADC express signal range.
I use a chassis SCXI-1001, SCXI-1600 USB DAQ and a table of 1520 SCXI and 1314 for measures of constraints. Within daqmx I have my range néc - 500 to 3500 uStrain with an excitement of the factor of 10V and pledge of 2.2. After a recent test, I measured more than 4000 uStrain. Real or not (we think maybe it's a sign of bad) I feel like the ADC must be on track to 3500. What I'm missing here? If the range does not reflect the real max and min then what it means.
The range you define just tells DAQmx range values to cover. With your configuration, you might be able to read much read more than 4000 depending on the configuration. The given info, I just couldn't understand that the device is set on currently, but I'm sure you could dig a little in the specifications with your configuration to find out what Beach is using the card in your computer.
If you feel that the material can act weird, there's a great KB help with measures of constraint in case of problems with your specific hardware.
How can I solve the inaccurate measurements with the SCXI-1314?
http://digital.NI.com/public.nsf/allkb/625E1FE5C6DD2A0C862579600073009E
-Bear
-
cDAQ9184 for the measurement of the angular position...
Hello
It works now... Thanks for the customer support OR. The measure of the angular position uses a signal generated internally by using a counter ("/ cDAQ1/Ctr1InternalOutput").
ARO
Ilkka
-
Digitization and adaptation of impedance of the signal source entries
I'm trying to measure the voltage difference and the time between the two entrances of a USB-5132 digitizer. The switching interval that I try to capture is ~ 150uS and I intend to acquire ~ 25K samples (50MS/s for 500, although it is an overdose of sampling frequency). The digitizer is 1 M ohms entered and I wanted to use the 100 SMA 50 ohm cables to connect to the source of the signals which in addition to several kohm impedance. My knowledge of RF is low and I am concerned about the impedance matching between the digitizer inputs, impedance source and wiring. What kind of considerations to I need to avoid degrading the signal? The switching signal is pulse-like and is rich in harmonics and on a sample of 500K samples/s scope is represented accurately. Should what kind of considerations I do about the impedance?
Hi William,.
There will be some problems if you try to use a source that has an impedance of several kohms. You will probably get the reflections of signals. What is the source of your signal has several kohm impedance? I'd take a peek through the following article Developer area that describes some of the considerations when it comes from impedance matching. Specifically, I would check the last section corresponding resistive. This should give you a better idea of what to worry about your application.
http://zone.NI.com/DevZone/CDA/tut/p/ID/3475#toc4
Here are also a couple more developer area articles that you might be interested in what concerns your situation.
http://zone.NI.com/DevZone/CDA/tut/p/ID/5779
http://zone.NI.com/DevZone/CDA/tut/p/ID/2892
Chris W
-
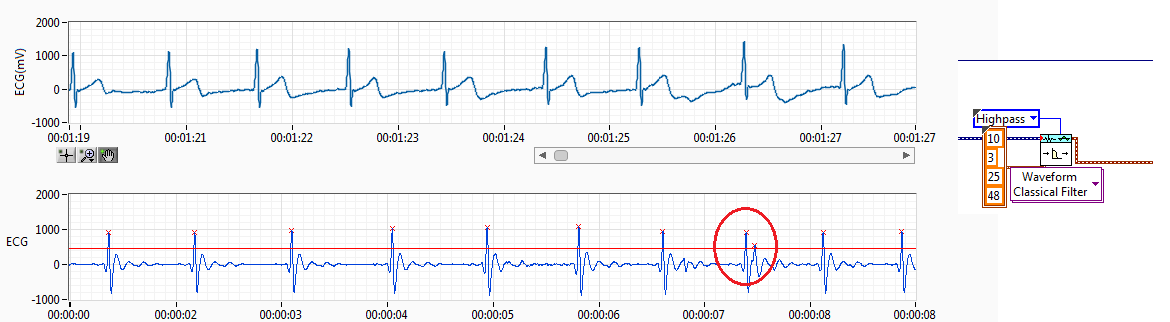
filter the peaks on the signal from ECG pulse!, help!
Hello
I have RCV of the ECG signal. I filtered the ECG signal and get the resource (interval between each pulse of ECG) records.
The source of the signal have noise I use a threshold but sometimes spikes of failure. Like the previous capture. Normally, if you get a pic of fault detected, I'll try to find this index to add to the left or right of the peak, normally I add to the lower value. This works if it has only a bad impulse between 2 good.
The problem come when I have more than a ridge between the two coupons.
Also, when the impulse of R a loss threshold I have trying to find the index and get 2 new reading making division 2 peak value.
I have attached the method I've used to adapt it. I only works if I have 1 Ridge added on real measures of R or pulse 1 loss R, when I have several pics no work.
I would like to hear an idea to make it work better. I don't like the idea of removing the value interval, I have 2 hours of reading and if I remove the values I have lower data outoput is why I tried to summarize or division of values to get the correct reading without losing any data.
Perhaps, there is any better filter for ECG of entry, so I have a R-own pulse and less noise between ECG pulses.
Any advice is welcome.
Best regards, Fred.
Almost. in the last step, you have extracted the real part of the complex waveform. Instead, you must retrieve the extent.
BTW, this idea isn't mine. I got from this article
http://www.ScienceDirect.com/science/article/PII/S0010482501000099
-
Why the signal are seen in the way IQ?
Hello world:
I'm confused on a phenomenon I have seen since a simple demo. The demo is that a sinusoidal signal is transmitted by the USRP by I traced. I have observed sine signal to two I have paths and Q of the signal for the same USRP. Signal path Q is not smooth like the I traced and the amplitude is lower. However, I think that the Q path should not exsist signal. I understand this problem as shown in the figure and the attachment is the demo
The USRP allows Tx and Rx LO are independent with a common reference, allowing you to tune in at two frequencies at the same time. It also means the phase of are of two different LO. This means that the acquired signal scatter energy between I and Q, but will have a common complex amplitude. If the traces on a constellation diagram, what it would look like a rotated constellation.
-
Measurement of the conductivity of the ground
Hi all
I'm trying to measure the conductivity of the ground using the Wenner table method. The attached photo is meant. I have a Board that generates an alternating voltage. The tension is provided in the ground using two socs (a round plate, partially buried in the ground and tied behind a farm tractor). Between these two points, I have an another two plowshares to measure the potential difference between these two points. Regarding the measure, I will need to measure the current voltage power and the potential difference. I use USB-6215. I put a known resistance in series along a leg of the alternating voltage. The idea is to measure the voltage at the terminals of the resistance (and so I can get current) given that USB-6215 is unable to measure current directly.
Now, my question is, in my view, a simple. I got confused on the connection I need to use. I know that I need to use differential measures to measure both the current and potential difference. However, referring to the guidelines for field wiring of NOR have (http://zone.ni.com/devzone/cda/tut/p/id/3344), I do not know if my case is considered updating the Earth or floating signal source.
Tips are appreciated!
Hi Lan 78,
Is based on the signal of your signal.
I therefore recommend differential connection.
However, there are a few things you need to know:
1. ensure that the voltage at the terminals of resistance exceeds 10V.
2. 6215 is a bus isolated, no channel-to-channel isolation. Therefore, if you measure a large voltage on several channels, he probably break down of the device.
3 bus isolated from 6125 is 30Vrms. ensure you that it does not exceed this requirement.
Sincerely, Kate
-
Distortion of the signal caused by the channels # sampled and sampling frequency
I am using an acquisition of data USB-6211 (250 ksps / s) and looking at the sample channels 3s 80kS. (Labview 2012)
When I taste one channel, it looks fine (1 Channel_Sampled First_250kS), but when I add another channel to be sampled, the signal is driven down and that it depends on which channel is sampled (2 channels (Different) _Sampled First_40kS and 2 Channels_Sampled First_30kS). Addition of channel 3, it pulls down even more. I also noticed that the sampling rate also distorts the signal the higher the sampling rate, the more the signal is driven down.
The acquisition of data IS sampling of signals "correctly" when I run my Labview VI my external hardware begins to read in correctly based on the distortion of the signal.
What is the cause and is there a way to fix this?
I have attached the waveform above captures and can post some if necessary.
Thanks in advance,
WBrenneman
That's exactly what ghosts means. The measurement signals later is affected by other signals. It happens usually if you have a high impedance input signal. Adding pads like you can help solve this problem by making the signal to a lower impedance.
Ghosting would probably look worse to the frequency sampling rates higher, just as you said that you had problems, as it provides less time between samples of the amplifier set new voltage level when the multiplexer allows to switch between input signals.
Maybe you are looking for
-
Photos library build stops at 24%
I'm migrating from an old Macbook Pro (10.8.x) to a new MacBook Pro (10.11.x). While the Photos builds my selected library (created in iphoto 11, v.9.x) whenever it stops at 24%. The first 24% is built within 20 min and then stays on 24% for nearly
-
Upgrade windows 7 32 bit to 64 bit
Hello The elitebook 8540p, that I bought at my University did not provide with a disc of windows 7 installation. When I started my laptop BIOS installed itself with a 32-bit version of windows 7. I recently became interested in upgrading my laptop a
-
How to build and use a clock for triggering signal internal.
Hi all Please excuse my ignorance, but I have been assigned to programming a system/operation of data collection for the experience, I'm trying and have no idea where to start. My goal is to generate a clock signal 0 - 5V with a frequency on the fron
-
JDE 6.0 - get error: "__ide_copyfile__.tmp (access is denied).
Hi, when I click on 'Build' in JDE, I get the following error: java.io.FileNotFoundException: C:\Program Files (x 86) \Research In Motion\BlackBerry JDE 6.0.0\simulator\__ide_copyfile__.tmp (access denied) build complete. Accordingly, any changes mad
-
the scanner of my computer has no driver?
my mother has a scan of the computer (canon lide 35 conoscan). She has not used for years, but now she had a new computer, that she had tried to implement when it uses the disc to install the scanner, it is said "there no driver" If someone knows how