Limit the size of the table of waveform graph
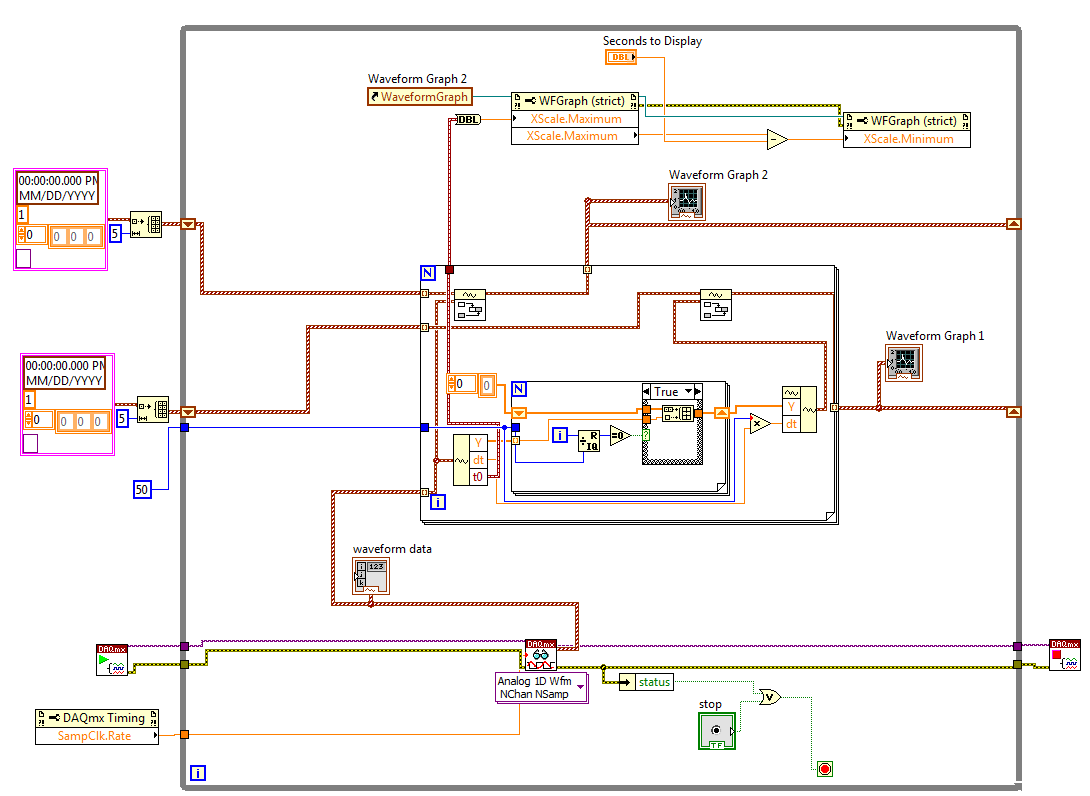
I try to display two graphs to the user in the front panel. Data are data from continuous waveform with 5 channels at 10ksps. Chart 1 displays all of the data wiped out 1 on each slice of 50 samples and Figure 2 each sample but only for the last X seconds of data (adjustable seconds for the display of control).
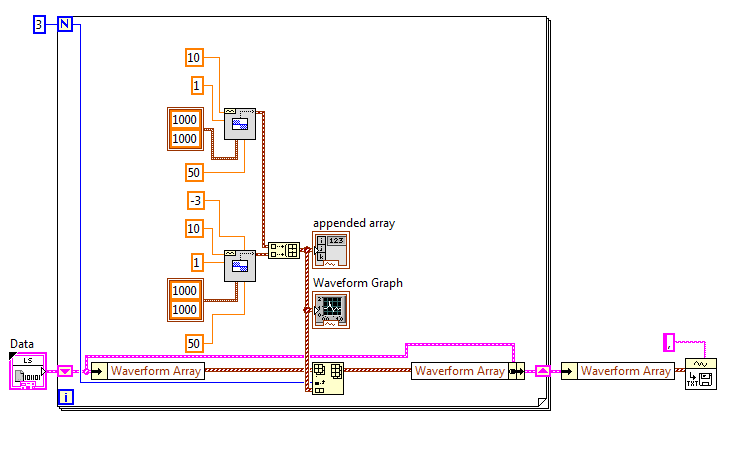
This code works, but it lacks memory very quickly, because in Figure 2 all data is stored although only 10 seconds can be displayed. I have attached an image of a simplified version of the block diagram.
I tried wrong with Replace table subset and turn table 1, D but just may not be quite right. The timestamps are disabled, the timestamp is not incremenent, or the read buffer overflows DAQMX and it crashes. Does anyone have a suggestion on how to create an array of size ended up with something like a FIFO buffer so that will plot the graph 2 correctly? An example VI or the screenshot would be great.
Thank you.
The simple solution is to use the subset of waveform to get the data you want to display in the chart 2, then only write the chart instead of all the data.
As a comment, you may want to max/min decimate things data for chart 1 instead of simple decimation. It will give you a much more accurate chart.
The following message may be useful.
Tags: NI Software
Similar Questions
-
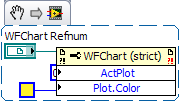
How to determine the strict reference to the table of waveform
Hello
I want to change the properties of a waveform by programming. I used to get all references maps of waveform a function of range in my script VI VI. Then I typecasted references to more specific class (strict-single track) after this trial I was able set properties such as data history. Everything works fine but if I add a graphic that is multiplot, that this approach does not work.
The problem is that in the table of references, there is reference to a graph in multiplot waveform, and this reference is not possible typcast to the more specific category (strict-single parcel).
My question is: how to determine if the reference in the table is matching the proper waveform (single or multiplot) charts.
In the VI attached is a code that demonstrates my problem.
Thanks a lot for the replies
Jan
Thank you for advice. VI point 2 from your answer, I created and it works. The solution is attached.
If I understand it correctly. I need to know the type of chart to come.
My first idea was to create a VI in Drop that initializes all the graphics of VI on chart type independently.
But this solution is fine because I will only use graphics-single plot and multiplot(two elements).
Thank you
Jan
-
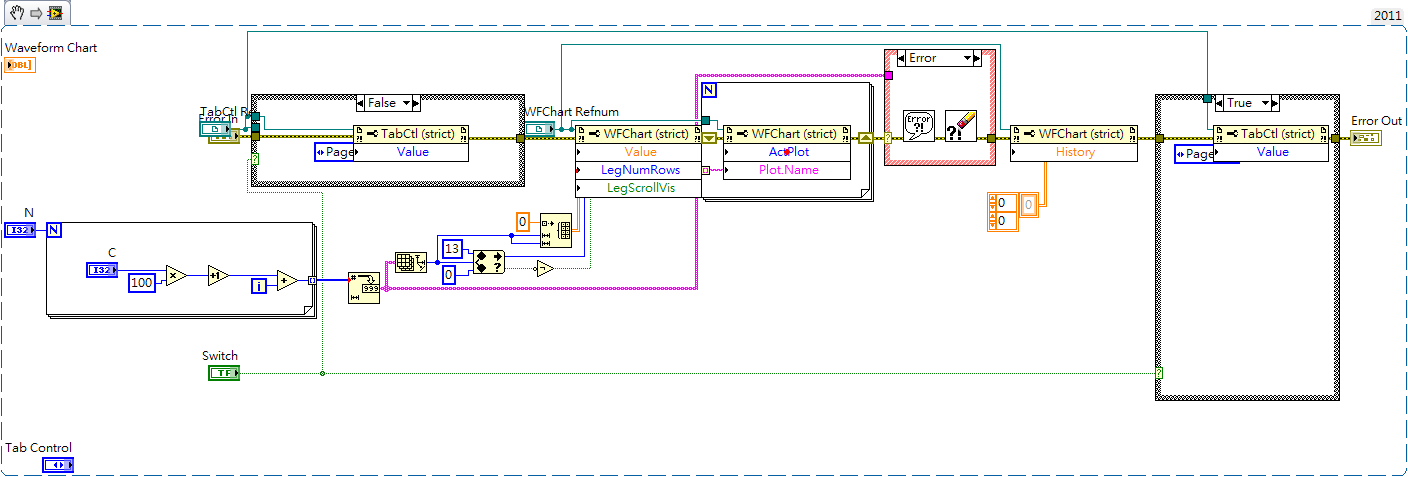
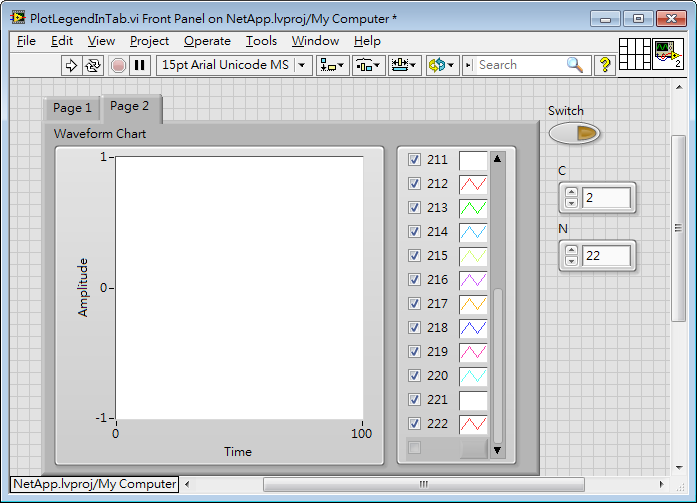
The table of waveform in the tab control
Hello
I would change the parcel number and the name of a waveform graph plotting in a tab control.
First of all, it works fine without a tab control, but I have several cards (such as temperature, pressure, tension...) while I put every chart in the pages of a tab control.
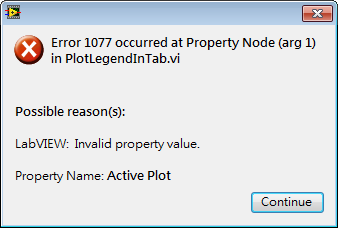
1077 error happened when I "add" the parcel number and change the name of the parcel.
Here is a sample I did to describe this problem.
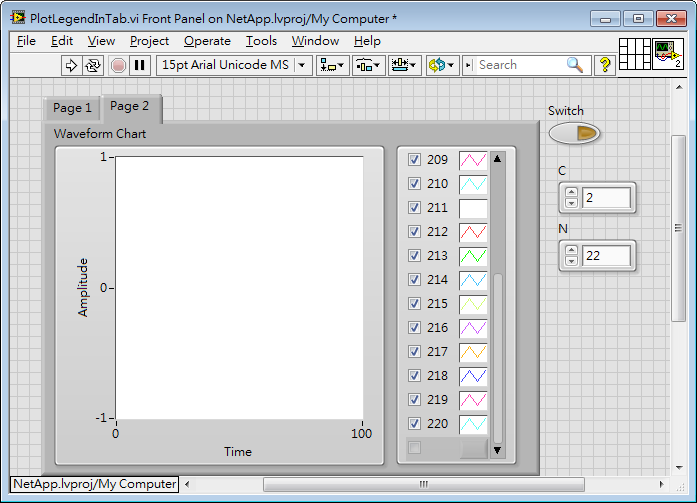
Start, if the number is 20, there are 20 plots in this table on page 2.
t
Do not operate the switch, replace C 3, N-18 and run that and it can be seen that the tab control will pass to page 1.
Switch to page 2 and field names are updated, but left a relic.
Add N 22, replace C 2, and then run it again.
Error 1077 has arrived! Go to page 2 and the parcel number is always 20, and field names are updated at 20.
Run it again and it works fine!
It is very difficult for me.
If I spend first on page 2 and run the program, it works very well also.
(In other words, if the switch is active, then the program works very well.)
The version of LabVIEW mine is 2011.
I don't know I missed or misunderstanded something about this problem.
Is someone can give me any suggestions? Thank you very much

Step 1: Do not use tabs, use sub-panels. You can get the same user experience, but with a much simpler code.
Start here: http://www.notatamelion.com/2015/02/09/building-a-subpanel-based-user-interface/
Mike...
-
How convert the waveform on the table of waveform waving on waveform graph
Please answer now...
Your other post indicates it is a thesis, I consider homework. What did you do? What do you mean? What do you get a waveform graph? You have one, or the plots of 10? If you have a parcel, what you get as the data type for the data in the chart? If you have more than one conspiracy, what do you get? What is the data type that accepts a waveform graph? Have you looked to see how that is defined?
For example, let's say you have a parcel on your chart. When you get the data, you get... a table 1 d of values. It's kind of logic, right? Well, what is the type of waveform data? It consists of a starting point, time delta between points and an array of values. Hmmmm... So, what about using the wave function of build? Just a thought...
-
Insert in the table of waveform
This is a snippet of code that I use in a larger program, but the functionality remains the same. I read two waveforms of an oscilloscope and insert them in my DataSet happening in the world. For some reason, when I do the table insert, no data ever made in this table. What concept am I missing here and how can I remedy this?
Build table is the correct way about 99.9% of the time.
I don't think I've ever actually used insert into the table. It is intended for those situations where you want to Insert and in the middle of a table element, not when you want to build on the table at the beginning or at the end.
Your original mode has not worked because you wired the value of the N terminal in the insertion index in the table. This value is 3. If the next table in the loop is empty, then you cannot insert an element at index 3 because the rest of the table before does not exist.
-
Save the Studio measure waveform graph as a file for reading later
Hello
I would like to know if there is an easier way to record data are rendered on a waveform graph (configured as a graphic of the band) to capture incoming data in the code and send copies of it to a file. It would be nice if there was a method to do this, with all relevant metadata stored in the file (color, etc.). Better yet, the file could then be opened in a labview application (for example, a TDMS file) for later review.
Thank you.
PS. I use VS2010 and MS 2010.
So, it looks like you already have all the data points. For metadata that you mentioned, line color, plot colors, point colors, line styles, etc. are all accessible from the properties so if you wish, you can retrieve all that data.
I think that upon return from t0 is the same compensation history, you can use the ClearData() method.
-
Merge the signals and waveform graph
Hi all
I ask you what follows, because I have little knowledge about labview
I have a function of merging signals which should take 7 signal as input. but I have no idea how to do to see the 7 signal on a waveform graph outputs. I want to show the 7 signals each of them on a waveform graph. (like research in the panet before I would see an array of unique waveform showing the 7 signals).
can you guys help me?
Thank you.
I'm confused for... Please find attached a really simple screw that does the job you want...
Are you tracing the curve of a graph or a chart? My VI control is a chart.
-
View the data in the table on xy graph slowly
Hello
I'm simulating a curve stress/strain running on a xy chart.
I have a chart 2d data to display a graph xy. When I hit the play button, I got on the first show that nothing on the graph and slowly, you can see the curve move upwards firstly from the XYpoints and runs all the way to the end over a period of 10 seconds. How can I do this?
I have attached a vi of what I've done so far. It will immediately draw immediately the entire curve. But I would like to see it curved slowly move upward instead. I tried to add a delay time in the loop but he expects just the length of the delay, and immediately the whole curve is displayed.
Also and if I need to have the empty display XY graph first I noted that if I rerun it, it always shows the curve of the previous run.
Thank you
BP
Try the screenshot
-
Incorrect data that appear on the table of waveform
I have two cards of waveforms in my vi, two current plot or tension. After that I created an array of data points, I send them to the waveform diagrams. The datapoints are completely incorrect when tracing (scale, no points, no autoscaling) Although, when I export my data to excel, it is perfect. All possible solutions on how to fix this? I have attached my vi for reference (sorry if this is a bit messy). I use the tab control and my problem is statement of the case "Ids vs Vgs.
You can cheat and use the graph XY Express or use a couple of dice shift registers of Y and build separate X. There is also the example of the graphic called expedition XY.
-
How can I display only a part of the scale in the waveform graph
This is the first time I try to use the waveform graph, since now, I used the table of waveform.
The reason why I moved to the chart, it's that I need cursors.I have 2 problem
the first: in the diagram, the graph moves when I add a new data and the scale of the x-axis stay the same size, in the right size I always saw the new data. How can I do that with waveform graph?
Second: How do I say Labview to the day I click on the graph, I need that because when move graphic I lose the day, and to make I need to zoom out, I drag the imprecateurs.
All this must be done programmatically. The LabVIEW graphic accepts tabular data, not only as the table and the graph doesn't have the ability to retain the previous points, like the story of a graph. You will need to retain previous values and then continually update the graph with the old and new values to get a shift register "chart as behavior. Cursors should be written programmatically re of each iteration, since you rewrite the entire graph.
-
Table of waveform LabVIEW 2009
I have a problem with the table of waveform in LabVIEW 2009, the chart will not poster on the table after a few iterations. This is a bug that appeared in LabVIEW 2009. The same program worked well with LV 8.6. Does anyone know a work around for this problem? I am currently using Version 9.0f2
See the attached diagram
It's strange...
I checked that save this return to 8.6 does indeed.
If you replace the function Merge signals with a bundle of things function seem to work fine.
There is also something weird happens with the property node. If you start with a pnode for active track, then drag it down to add another element, then change this new element to draw colors, you get an error on the property node.
"Interesting."
Steve
-
How to change tables of waveforms?
Hi, I hope you can help with this.
I read 6 channels of analog data to a USB - 6008 1000 samples/second, 1000 sample blocks in a loop. The data come from DAQMX as an array of 6 waveforms.
I want to (y) scale all data such as 0, 1, 2 channels are divided by 3 (because electronics has an op-amp of gain of 3 x on channels) and channels 3, 4, 5 are divided by 15 (because electronics has a 3 x the gain and there is a resistance of 5 ohms and I'm trying to measure the current).
You might think it's ridiculously easy... but:
(1) to "scale and offset" labview vi only works on waveforms (no tables of waveforms)
(2) insert a node of matlab or matscript me does not work only the tables on waveforms,
(3) with the help of a simple 'divide' VI, it is impossible to define the denominator as just one number... "3" !any ideas? as usual, it is the kind of problem, people have to face all the time
Dave
Hi Dave,.
That's how I'd do it - use the table of values of divisor.
Hope this helps - example in lv 8.6.
Kind regards
-
How to display more than two waveforms on a waveform graph?
Well, I have a question in the basics of waveform graphs. I have to post four waveforms simultaneously in my program. I can see two graphs on it, but when I try to display four waveforms, I get an error:
You have two or more data types of cluster wired together, but clusters have different types or numbers of items.
Cluster (unnamed), a group of 3 elements.
conflicts with graphic waveform cluster, a cluster of 2 elements.Is there anyway that I can change a graphic in waveform to a cluster of 4 elements? Because I borrowed this waveform of a VI example on waveform cards "Charts.vi", so I guess it must have been programmed to be a cluster of 2 elements.
I hope that I have my question clearly.
Thanks in advance
One of the problems that you have is that data from the DAQ assistant has a time stamp from now which is about 3 billion seconds
Data from the simulated signals has a time stamp based on the beginning of the acquisition which is about 0 seconds.
So, the table needs to be stretched early in LabVIEW time now to show all the data.
Change signals simulated so that the timestamp is the result of an absolute time, then you should be able to see all the signals.
-
Hello
I want to trace the temperature change indicated by two thermocouples (that are connected to the analog input Module NI DAQmx) with repsect in time (two curves for thermocouple 1 and 2) on a graph unique waveform. Two thermocouples are connected to two channels separated in the module. Waveform graph must be shown in the before, but also exported to a worksheet.
I have grouped the entry of time and separately two thermocouples temperature readings. and then tried to build a cluster. However, I get an error message. Please see the attached VI helpme to achieve the desired results.
Thank you
Josée Vilas V
-
Programmatically set the size of a table control (not the number of col and lines)
Hi all
I am trying to create a little VI, in which the user selects the number of columns and rows in a table, and after clicking on a button 'OK', the table control is displayed in the control panel (to be filled in by the user). To do this, I use the nodes property to the number of columns and lines. I have no problem with that.
However, I want to "limit" the size of the control table (control of himself, not the dimensions of the table) and make use of vertical and horizontal table, the scroll bars. I want to avoid it is that passes type 100 user and 100 lines and appears a huge table control.
I could tho this by using an array instead of an array, via the node property "size", but I would use an insead table a table.
Thank you very much
Daniel
With a table control, you cannot set the display size to be anything other than a multiple of a complete cell.
If you are limited to a number of lines and columns. If you want to resize with more control you also need to resize the control within the Bay, accessible via the property 'picture Element '.
Another option (but seems huge exaggerated) is to place your table in a secondary and set the size of the secondary to the size you need and enable scrollbars for her. It is not an option that I would choose but if it helps...
Have it, your description of your user interface sounds not very intuitive. How the user knows at any time exactly what cell they access if they have to scroll backwards?

Maybe you are looking for
-
Oldtimer new t5i difficulty backlit
Most of my shots are birds. With my old manual 35 mm slr, I opened the fstops by two notches for a slight overexposure and voila no more black birds or detailless aircraft. With my new fandangled digital rebel t5i looks like I will have great diffic
-
RAID of UN in da Dictionary 1 by backup UN disco
Buongiorno, con ho UN vecchissimo use centos 4.9 e a raid 1 fatto con una PERC 4/SC. ORA wants to upgrade OS a centos 5 operation e e a po rischiosa. Pensavo di UN dal disco by tenerlo raid1 (virtualmente mettendolo offline) dictionary come backup; n
-
BlackBerry Smartphones forgot password blackberry app world and security password
Hello I was wondering if someone could help, I tried to enter my world of app for think centuries now, but not for the life of me what my password is. I don't know what password I filed to the security question. Ive went through all the things that I
-
Impression of the IPad has stopped working
I can not print from my iPad and my daily apps no longer print. Another impression still works. Photosmart 5520 on Windows 8. No message appears.
-
Need information about the Tables in database in Oracle Apps
HelloI am looking for information about the Tables in database in Oracle Apps.Is it possible that we could see the (column name, description of each column, the primary key, foreign key etc.) the table structure in database (e.g. HZ_PARTIES, CS_INCID