Line of best fit / linear regression
I am trying ot get a line to better adapt to a set of data in oracleLet's say I have the following dataset.
Since there are a lot of 0 in the terms I want to ignore these terms
Use only terms that have values for a line of regression.
Any help will be appreciated.
Thank you.
       TERMS            Count
TERM_0801     78
TERM_0802     58
TERM_0803     0
TERM_0804     82
TERM_0805     0
TERM_0806     0
TERM_0807     32
TERM_0808     0
TERM_0901     92
TERM_0902     0
TERM_0903     0
TERM_0904     56
TERM_0905     0
TERM_0906     0
TERM_0907     0
TERM_0908     0
TERM_1001     85
TERM_1002     0
TERM_1003     0
TERM_1004 67Published by: Chloe_19 on July 24, 2012 23:14
Maybe:
with
the_data(terms,count) as
(select 'TERM_0801',78 from dual union all
 select 'TERM_0802',58 from dual union all
 select 'TERM_0803',0 from dual union all
 select 'TERM_0804',82 from dual union all
 select 'TERM_0805',0 from dual union all
 select 'TERM_0806',0 from dual union all
 select 'TERM_0807',32 from dual union all
 select 'TERM_0808',0 from dual union all
 select 'TERM_0901',92 from dual union all
 select 'TERM_0902',0 from dual union all
 select 'TERM_0903',0 from dual union all
 select 'TERM_0904',56 from dual union all
 select 'TERM_0905',0 from dual union all
 select 'TERM_0906',0 from dual union all
 select 'TERM_0907',0 from dual union all
 select 'TERM_0908',0 from dual union all
 select 'TERM_1001',85 from dual union all
 select 'TERM_1002',0 from dual union all
 select 'TERM_1003',0 from dual union all
 select 'TERM_1004',67 from dual
)
select regr_slope(cnt,rn) r_slope,
       regr_intercept(cnt,rn) r_intercept,
       regr_count(cnt,rn) r_count,
       regr_r2(cnt,rn) r_r2,
       regr_avgx(cnt,rn) r_avgx,
       regr_avgy(cnt,rn) r_avgy,
       regr_sxx(cnt,rn) r_sxx,
       regr_syy(cnt,rn) r_syy,
       regr_sxy(cnt,rn) r_sxy
  from (select count cnt,row_number() over (order by terms) rn
          from the_data
       )
 where cnt != 0

 R_SLOPE          | R_INTERCEPT      | R_COUNT | R_R2                | R_AVGX | R_AVGY | R_SXX | R_SYY  | R_SXY
0,241071428571429 | 66,5803571428571 |       8 | 0,00723884549185754 |      9 |  68,75 |   336 | 2697,5 |    81
Concerning
Etbin
Tags: Database
Similar Questions
-
Hello
I need to make a non-linear regression in LabWindows but I don't not eat in order to find a function for that...
I know that there s for linear regression (LinFit) function, but not could find one for non-linear... Is there such function CVI?
Or maybe someone has an algorithm to do this...
Any help is very appreciated!
Thank you
ZZippo
Hi ZZippo,
as long as you have the AdvancedAnalysisLibrary there are three related functions for nonlinear curve fit:
NonLinearFit (-);
NonLinearFitWithMaxIters (, 100);
NonLinearFitWithWeight (, 100);
the last two offer more options than the first.
If you do not have this library (i.e. the full version of the CVI instead of the basic version), you can use the following implementation of Levenberg-Marquardt:http://www.ics.forth.gr/~lourakis/levmar/
-
Is it possible to get the R2 of the nonlinear function made in Labview?
Do corospond "residue" of R2?Use of vi of goodness of the Fit in the curve in advanced editing Palette. The aid must be explicit.
See you soon,.
McDuff
-
First line is repeting while accessing several lines by database fits
Hello
IAM using the card database in the BPEL process to recover data from a remote database. Database adapter, I chose select operation and passing the input parameter.
In fact this adapter should return 10 lines although variable output of this card.
Its lines with 10, but the first line is repeting 10 times.
IAM not able to get 10 rows.only first line is repeting.
Please help me in this.
Thanks in advanceHello
In the DbAdapter Assistant you can see the SQL query with the parameter that you added.
Can you run on your DB and see if you get the required results?
In addition, you defined a primery key?Arik
-
Which of the many Adobe products best fits my idea of greeting card?
Hi all and I apologize in advance if this seems to be a really naïve question, but I'm a complete noob. I have a small online store that sells continental antiques and what I wanted to do was to reproduce and sell old vows or vintage cards. My problem is that I like cards in foreign languages and being old maps are a bit shabby around the edges.
I am looking for a kind of desktop Publishing adobe software that would allow me to a) resize maps, b) slightly change the colors of the cards and c) reprint real greetings in a foreign language, in English, but in the same fonts and finally, c) that would allow me to reset the slightly torn edges and clean foxed in those white lines.
Adode do so many things and some software costs hundreds and hundreds. As a small merchant, I want something good enough to perform the tasks above, without the unnecessary fancy stuff.
Also, can anyone recomment a suitable canon or epson printer that makes the fantastic details and brightly for up to 300 g/m² greeting cards, without costing the Earth
If you guys could give me the benefit of your experience, I would be extremely grateful. Unfortunately, there is a huge amount of deskstop edition of the "stuff" out there, but I'm at a total loss as to how to work what is good for me.
Huge thanks in advance :-)
x
From your description, I understand that the main part has to do with the restoration of the greeting cards. This means that you first need an image editing program. The program should also be able to work with text.
To not make it easier for you: there are many programs that can it needs. You can set with Adobe Elements (in this case, Photoshop CS6 or CC is an overdose) but there are also programs such as The Gimp, which is free to use.
I guess others here on the forum can come up with more appropriate solutions.
The main point is that perhaps you should not opt for an expensive package but rather invest time learning how to use the software for your publishing goals.
-
PLSQL - prediction of linear regression.
Hey, Chaps.
I'm puzzled! I hope you can help...
SQL
WITH tblData AS
(
    SELECT  1 AS known_ys, TO_DATE('01/01/2015', 'DD/MM/YYYY') AS known_xs FROM DUAL UNION ALL
    SELECT  2, TO_DATE('02/01/2015', 'DD/MM/YYYY') FROM DUAL UNION ALL
    SELECT  3, TO_DATE('03/01/2015', 'DD/MM/YYYY') FROM DUAL UNION ALL
    SELECT  4, TO_DATE('04/01/2015', 'DD/MM/YYYY') FROM DUAL
)
    SELECT  *
      FROM  tblData
;
What I'm trying to do, is provide by using my known_ys what happens on 01/05/2015 (known_xs). The answer is of course 5
In Excel, I'd FORECAST ("01/05/2015", known_ys, knownxs) and it spits out 5. Unfortunately my data are so large in Excel (and other stats packages) I need to push the calculation in the Oracle server.
I spent 30 minutes to read the Sub and get more confused -anyone know (and ideally give an example) how to proceed?
Created this just now that works but it is a little "garbage."
WITH tblData AS
(
    SELECT  1 AS known_ys, TO_DATE('01/01/2015', 'DD/MM/YYYY') AS known_xs FROM DUAL UNION ALL
    SELECT  2, TO_DATE('02/01/2015', 'DD/MM/YYYY') FROM DUAL UNION ALL
    SELECT  4, TO_DATE('03/01/2015', 'DD/MM/YYYY') FROM DUAL UNION ALL
    SELECT  8, TO_DATE('04/01/2015', 'DD/MM/YYYY') FROM DUAL
)
    SELECT  last_value,
            REGR_SLOPE(known_ys, (known_xs - SYSDATE)) AS slope,
            last_value + REGR_SLOPE(known_ys, (known_xs - SYSDATE)) AS nxt_value
      FROM  tblData,
            (SELECT FIRST_VALUE(known_ys) OVER (PARTITION BY 1 ORDER BY known_xs DESC) AS last_value FROM tblData)

  GROUP BY  last_value
;
Something like this (no PL/SQL required):
WITH tblData AS
(
SELECT 1 AS known_ys, TO_DATE('01/01/2015', 'DD/MM/YYYY') AS known_xs DE DOUBLE UNION ALL
SELECT 2, TO_DATE (FEBRUARY 1, 2015 ',' DD/MM/YYYY "") OF THE WHOLE UNION DOUBLE
CHOOSE 3, TO_DATE (MARCH 1, 2015 ',' DD/MM/YYYY ') FROM DUAL UNION ALL
SELECT 4, TO_DATE (APRIL 1, 2015 ',' DD/MM/YYYY ') FROM DUAL
)
SELECT REGR_INTERCEPT (known_ys, known_xs - TO_DATE (May 1, 2015 ',' DD/MM/YYYY ')) x
OF tblData
;
SQL > /.
X
----------
5
http://docs.Oracle.com/database/121/SQLRF/functions165.htm#SQLRF00696
REGR_INTERCEPT predicted where the graph will cross the axis, so I subtracted TO_DATE(5/01/2015,'DD/MM/YYYY') get a data type number, 0 being equivalent to the date that I was interested.
REGR_ features * supports window clauses, you can perform calculations on multiple series of data in the same table with a single pass in the data.
-
Is there a way I can get a linear line of best fit for an XY trace.
Thank you
Matt.
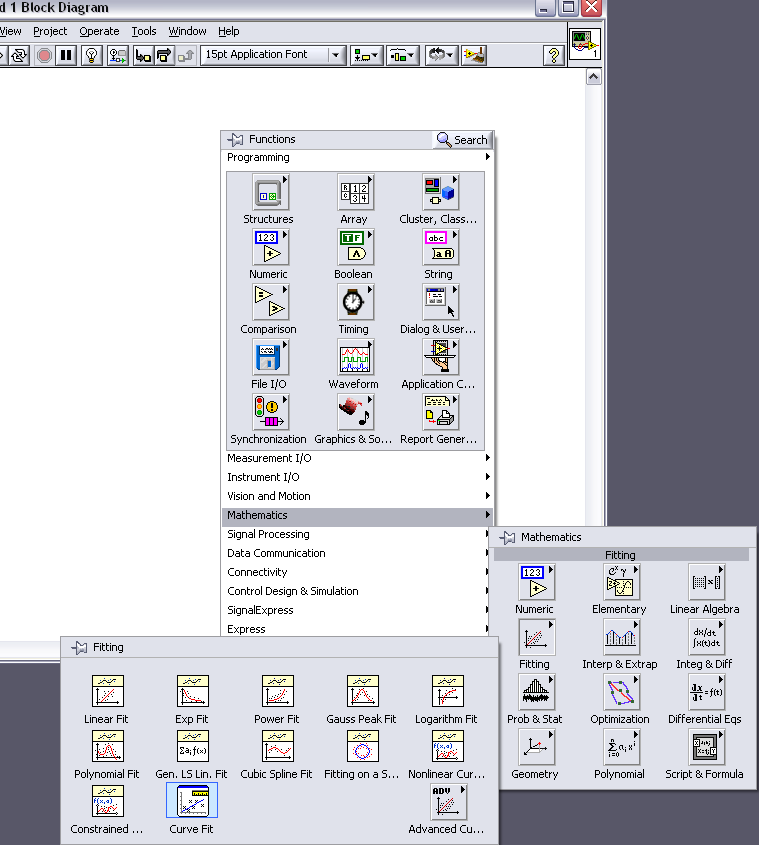
Have you looked at the range of fitting under "math"? You need the system to full development for these tools.
You can take the table linear adjustment of the linear fit.vi and this thread in your chart as a subplot.
-
How to activate a chart like LINEST
In Excel for MAC, I select the area of the table. In the open left corner, I write the LINEST. After this, hay, press shift + command + entry and displays the result in the cell. How can I do the same in NUMBER?
I suggest reviewing built-in browser information. When you type the sing equal in a cel, in mode 'formula' and browser features appear on the right:

Enter the function in question in the search field.
The short of it is...
= INDEX (LINEST (a2: A6, B2: B6, 1, 0), 2) returns about 0.0342960288808646, which is b.
Therefore, integrate the function of lines in a call to index() in order to access the elements of the array.
I'm sticking with linest here:
The LINEST function returns a table of statistics for a straight line that best fits the data using the method of least squares.
- LINEST (known y - values, values-x-known, different from zero-ordinate at the origin of other stats)
- known y values: a collection that contains the values of are known. known y values must contain numeric values. If there is only a collection of known x-values, the known y values can be any size. If there is more than a collection of known x-values, known y values can be either a column containing the values or a line containing the values, but not both.
- values-x-known: an optional collection containing the known x-values. known x-values must contain values of number. If omitted, it will be supposed to be a game of the same size as known y - valuesbeginning with 1 - for example, 1, 2, 3 if there are three values are known. If there is only one set of known x-values, values known-x, if specified, should be the same size as the values are known. If there is more than one set of known x-values, each row/column of known x-values is considered to be a game and the size of each row/column must be the same as the size of the row/column of values known there.
- different from zero-y-intercept: a modal value specifying how the intercept (constant (b) must be calculated.
- normal (1, TRUE or is omitted): the value of the intercept (constant (b) should be calculated normally.
- force the value 0 (0, FALSE): the value of the intercept (constant (b) should be forced to 0.
- more stats: an optional modal value specifying if the additional statistical information should be returned.
- no stats additional (0, FALSE or omitted): do not return the additional regression statistics in the table returned.
- additional statistics (1, TRUE): Returns the additional regression statistics in the returned array.
Notes
- The values returned by the function are contained in a table. A method for reading values in the table is to use the INDEX function. You can wrap the LINEST function within the function INDEX: = INDEX (LINEST (known y - values, values-x-known, ordered originally, other stats), y, x) where y and x are the index line and column of the desired value. If the additional regression statistics are not returned (more-stats is FALSE), the returned array is a deep line. The number of columns is equal the number of sets of known x-values + 1. It contains tracks from the line (a value for each row/column of x-values) in reverse order (the first value refers to the last row/column of x-values), then the value of b, the y-intercept. If the additional regression statistics are returned (more-stats is TRUE), the table contains five lines. See more information on this table immediately following the examples.
Examples Given the following picture of known-x-values(cells A2:A6) and known y values (cells B2: B6): A B 1 X THERE 2 0 -1 3 8 10 4 9 12 5 4 5 6 1 3 = INDEX (LINEST (a2: A6, B2: B6, 1, 0), 1) returns approximately 0.752707581227437 for a normal given (1) non-zero-ordinate at the origin. This is the slope of the best-fit line because we said that we wanted the first value of the array returned by INDEX and we have specified that one set of known x-values. = INDEX (LINEST (a2: A6, B2: B6, 1, 0), 2) returns about 0.0342960288808646, which is b, the point of intersection of the best-fit line. The intercept was originally returned because we said that we wanted the second value in the array returned by INDEX, which would be the second value because we have only specified a set of known x-values. Content of the additional statisticsLINEST table may include additional statistical information in the table returned by the function. For the purposes of the following discussion, assume that there are five sets of x values known, in addition to the values of y known. Suppose further that the known x-values are in five rows in the table or five columns of the table. On this basis, the array returned by LINEST contains the following values.
1 2 3 4 5 6 1 S5 S4 S3 S2 S1 b 2 SE5 SE4 SE3 SE2 SE1 SEb 3 C SE's 4 F DF 5 R1 R2 Row 1, column 1 contains S5 (the slope for the fifth set of known x-values) continuing until the 5 column, containing S1(the slope for the first set of known x-values). Note that the slope related to each set of known x-values are returned in reverse order. The last cell in row 1 contains b, the y for x values known. In our example, this would be row 1 column 6. row 2, column 1 contains SE5 (the standard error for the associated coefficient to the fifth set of known x-values) continuing until the 5 column, containing SE1(coefficient of standard deviation for the first set of known x-values). These values are returned in reverse order; in other words, if there are five sets of known value x, value for the fifth set is first returned in the array. It is the same way the slope values are returned. The last cell in row 2 contains SEb, the standard deviation associated with the value of the y-intercept (b). In our example, it would be the line 2, column 6. row 3, column 1 contains C, the coefficient of determination. This statistic compares the values are estimated and actual. If it is 1, there is no difference between the value is estimated and real value there. This is known as perfect correlation. If the coefficient of determination is 0, there is no correlation, and the particular regression equation is not useful to predict a value y. line 3, column 2 contains SE's, the standard deviation associated with estimating the value y. line 4, column 1 contains F, F observed value. The observed F value can be used to help determine if the observed relationship between the dependent and independent variables occurs by chance. Line 4, column 2 contains degrees of freedom, DF. Use the statistics of degrees of freedom to help determine a confidence level. Line 5, column 1 contains1, the sum of squares regression R. Line 5, column 2 contains R2, the residual sum of squares. Here are some things to keep in mind about the additional regression statistics table:
- It does not matter if the known x-values and known values are in rows or columns. In both cases, the returned array is ordered by lines, as shown in the table.
- The example assumes that five sets of known x-values. If there is more or less than 5 years, the number of columns in the table returned change accordingly (it is always equal the number of sets of known values x + 1), but the number of lines would remain constant.
- If the additional regression statistics are not specified in the arguments to LINEST, the returned array is equal to the first line only.
- LINEST (known y - values, values-x-known, different from zero-ordinate at the origin of other stats)
-
Puzzled by changing the size of the array of Bell Curve (or made gaussien)
I use an instrument which entered a table 1 d signal. When you draw the it, it looks a lot like a Gaussian function (it looks very good too).
What I want to do is to change the size of the array of this input function (basically I want to increase the size of table).
For example, when you look at the picture attached, you will see that the size of the curve in the picture on the left, which is the GROSS ENTRY, 70 =.
What I want to do is to change this size to a number of interest (for example, let's say 80)...
So basically I want to insert 10 new numbers in the table (in random places), but I want these 10 numbers to fit on the best-fit-the signal line (like you see in the image to the right).
So I tried to use Gaussian worthy, and cubic spline worthy... etc but none of these features allow me to change the size of the table of the output to adapt.
Any of them do not give you the equation of the line of best - fit either... so I can't solve Y for a known X.
It is very important for me to continue my project.
Thank you very much
Look at the palette under Interpolation in the math palette. You can find something that will work for you. It will not add points on the equation, but should allow you to get more points along your curve.
Lynn
-
Best Poly Fit Coefficients do not match the best Poly Fit 2
Hello
I have dataset with 9 points and want to adapt or to solve linear equations with coefficient 9. The model - equation is then
Z = a0 + a1 * x + y * a2 + a3 * x ^ 2 + a4 * x * y * + a5 * y ^ 2 + a6 * x ^ 7 * x + 2 * y * y ^ 2 + a8 * x ^ 2 * y ^ 2; coefficient 9 total EQ.
When I create the matrix H and send data to 'General linear Fit' it returns coeffcients and the best fit. Better adapt works well but I don't know how to interpret a coeficients.
All the math of it works well when the function is second order polynom, for example, when there coefficient a0 to a5.
Thanks in advance.

Sasa
You're right, it works!
I fix error of 11 to 1, but also the algorithm must be "acquired" and then match.
Thank you!!!
-
How to choose between a linear and logistic model in the regression of the glm?
Hello
documentation, I learned that the algorithm of glm for the linear regression model supports linear and logistic regression. However, I can't find any switch or parameter that selects one or the other. How can I tell ODM what kind of regression I want?
Thanks in advance!
Hi Bernd,
Here are some additional tips.
Hope this is what you are looking for.
THX, mark
If you specify a classification, it is logistics. If you specify the regression, linear regression. Logistic regression only we offer is the variance and binary logistic regression canonical link. If you have a target with values in [0,..., 100] and you want to use logistic regression of glm, and then create a view that selects a share point, for example, 50. There is no parameter variation algorithm.
Create view bin_v as
to select which target< 50="" then="" 0="" else="" 1="" end="">
var1, var2,... varn my_data.
Otherwise if you want linear regression, specify regression and let the data it is.
-
Hi all
I have a series of X, Y coordinates that describe parallel lines n (3 parallel lines at the moment but can grow). Y at - it an easy way to get the best fit of these parallel lines, that is to say the slopes of the lines are the same and only the point of intersection is different. MATLAB has a routine called aoctool that can be adapted to parallel lines, is an analogue in LabVIEW? By using LabVIEW 8.2 full development version.
Kind regards
Leeser.
You can use the general linear Fit.vi LS to implement this. Take a look at the VI attached and see if it works for you.
The first column of the matrix H is the concatenation of all the X values for all lines. The rest of the columns are just 1 for these values of X in this line and 0 for values of X that are not part of the line.-Jim
-
My Clickfree automatic backup drive I had for many years stopped working with my iMac, what is the best replacement to use with Time Machine.
I can't even reformat the drive to try to start over, then think its time I invested in a high today but don't know where start looking so any advise would be a great help.
Thank you guys
A lot of users on these forums recommend OWC (www.macsales.com) Mercury Elite Pro series JEP due to their durability, affordability and quality of construction. I have about 6 of them connected to my iMac and have never had a speaker to fail. When a hard drive fails, substitute is a 5-minute process to re - use the box. To help you get started, you can find the line to: https://eshop.macsales.com/shop/firewire/1394/USB/EliteAL/eSATA_FW800_FW400_USB
You can find them in various ways and with a variety of configurations of connection so you can find the one that best fits your needs.
Good luck!
-
'Power' and 'Exponential' trend lines does not
I have a diagram of dispersion (pictured below) that I'm trying to find a best fit line for, but when I try to select either power or exponential disappears from the trendline, just like the R ^ 2 and equation. The amount of data in the cloud of points is very large; is there a reason that the numbers should not be able to calculate a power or an exponential trendline for this land? Thank you.

try to draw half the data until it works.
-
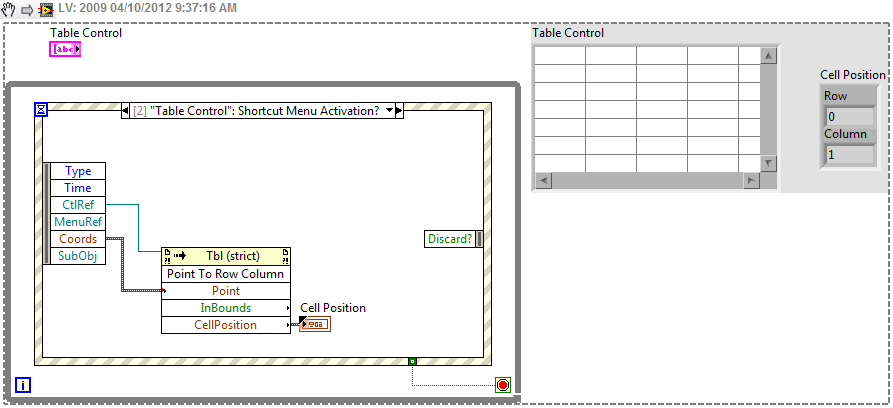
How to determine a specific line in the table clicked on
Hello-
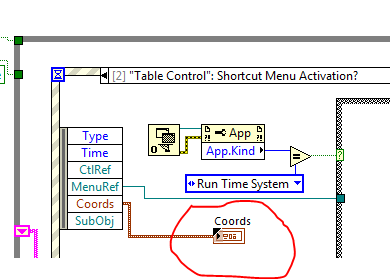
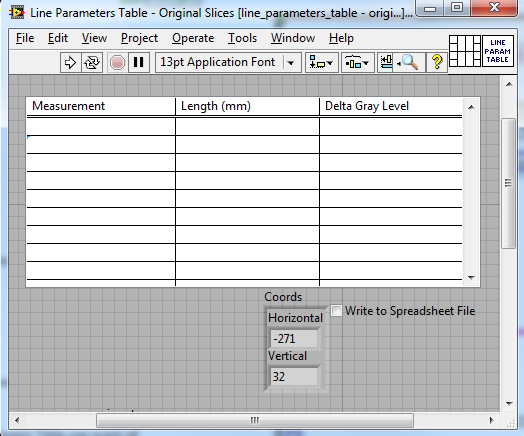
I need to determine the specific line of a table control that is right-mouse-clicking. I think that this is possible by using the context Menu Activation? event for the control of the table and get the vertical coordinate in the Coords filter options.
He is performing experiments to determine the vertical amplitude of each row in the table, or maybe in determining the width of a line and using a linear relationship to determine the possible range of the following lines. Do you feel it is the best strategy or is it maybe an another easier way to get this information?
Thank you
Don
You can use the CtlRef with the Point in the array to the method line for the information.
Ben64
I was too slow to respond...


Maybe you are looking for
-
How can I remove the front fan on a Mac Pro 3.1 the previous owner fitted an SSD in the DVD compartment but the wires disappear under the fan. Thank you
-
Hello After manually delete older backups on my time Machine that is placed on a network drive with the cli command "delete... tmutil." I wanted to reclaim the free space using hdiutil compact (...). sparsebundle. But hdiutil always fails with the er
-
HP psc photosmart 2410: I want to print only black
I am constantly running out of color ink and I was wondering if I can get my printer to print black ink only I lost my manual so any help would be appreciated Thank you
-
Re-Installation of security KB2644615 update failed
KB2644615 has been successfully installed on January 11, 2012... about 2 weeks later, quite separately, my Vista Home Prem SP2 is become unstable so restored to a point of date before Jan 11... Since this update of security refused to install properl
-
About 4 or 5 days ago sounds for incoming messages (text) stopped working and no so notifications in the taskbar from top left of the page. Checked the settings and made sure that it is at full volume. The only way I know that something happened is t