My library is locked
I was doing a project in final cut pro until my program stopped responding so I force quit it if I could restart it. After restarting the program, it wouldn't start so I restarted my mac just. After restart my mac, I get this message saying: "the 'Library Edition' document could not be opened. You do not have the permission. ». I was very confused because I expected to have all the permissions to open it because I created. Now I can't access anything in the library and I can not change within this library. I can't change the permissions for the library, as it is said, "you have personalized access". I need assistance in effect changing the permissions for the library, or something that will give me the opportunity to continue to use this library. I had many important projects that I can't just simply get rid of. Help me please!
Quit final cut PRO X.
Select the library in the Finder and press command-I to open the window read the information.
To change permissions, click on the padlock at the bottom and enter your password.

If the permissions appear to be correct, but you are still unable to open this library:
(1) delete FCP X preferences.
(2) run the disk utility and repair the drive containing your library.
Tags: Professional Applications
Similar Questions
-
IPhoto library is locked and 'force quit' or restarting solves the problem. Any ideas?
iPhoto has error message: library is locked. clicking on repair or force quit or restart has not resolved. How can I get the app to restart?
Can you give us the exact error message? Generally, the most common one said something on a disclock. Is your library on an external? If so, what format is it?
Also, what version of iPhoto?
Assuming that is not on an external, try to download iPhoto Library Manager and use the rebuild feature. (In early versions of the Library Manager, this is the file-> control Rebuild. In versions later it is under the menu library.)
This will create a completely new library. It will then copy (or try) your photos and all associated metadata and versions to this library and as close as possible to what you had in the damaged library fix it. It does this based on the information it finds in the iPhoto sharing mechanism - but it means that things not shared won't be there, so no slide shows, books or calendars, for example - but it should recover all your events, albums and keywords, faces and places.
Because this process creates a completely new library and does not change your old, it is non-destructive, and if you are not satisfied with the result, you can simply go back to your old.
-
Library Cache lock when re-register a XSD
Oracle Database 11g Enterprise Edition Release 11.2.0.3.0 - 64bit Production
PL/SQL Release 11.2.0.3.0 - Production
CORE    11.2.0.3.0      Production
TNS for Linux: Version 11.2.0.3.0 - Production
NLSRTL Version 11.2.0.3.0 - Production
If I 'use' a xsd in a single session, and then if I try to re - register the xsd in another session, the session of re - record indefinitely waiting on a library cache lock:
"use" the xsd is one session:

create or replace procedure sp_schema_validate_xml(pi_xml IN XMLType,
                                                   pi_xml_schema IN VARCHAR2)
is
  v_count number;
  v_err_msg varchar2(4000);
  v_xml xmltype;
begin
      --do level 1 schema validation
      if pi_xml.isSchemaValid(pi_xml_schema) = 0 then --level 1 vldtn failed. do level 2

        begin --do level 2 vldtn
          v_xml := pi_xml.createSchemaBasedXML(pi_xml_schema);

          v_xml.schemaValidate();

        end;

      end if;

end sp_schema_validate_xml;
/


create or replace directory pipedoc as '/home/oracle/testfiles/HUD/ERS_HUD_VM01/PIPE';

begin
  sp_schema_validate_xml(pi_xml => xmltype(bfilename('PIPEDOC', 'DecryptedFile-36805759.xml'),0),
                         pi_xml_schema => 'PIPE/Power/V4.0/PIPEDocument.xsd'
                        );
end;
/

Now try to re-register the XSD in another session:

create or replace directory XSD as '/home/oracle/testfiles/HUD/ERS_HUD_VM01/PIPE/XSDs/Power';

create or replace function f_exists_xsd(pi_list_item IN varchar2) return boolean
  is
    v_count pls_integer;
  begin

    select count(1) into v_count
    from user_xml_schemas
    where schema_url = pi_list_item;

    if v_count = 0 then
      return false;
    else
      return true;
    end if;

  end f_exists_xsd;
/


declare
  v_xsd varchar2(100) := 'PIPE/Power/V4.0/PIPEDocument.xsd';
begin
  if f_exists_xsd(v_xsd) = true then
     dbms_xmlschema.deleteschema(v_xsd,
                                     dbms_xmlschema.DELETE_CASCADE_FORCE);
  end if;

  dbms_xmlschema.registerSchema(schemaURL => v_xsd,
                                   schemaDoc => xmltype(bfilename('XSD', 'PIPEDocument.xsd'), 0),
                                   local => TRUE,
                                   genTypes => FALSE,
                                   genbean => FALSE,
                                   genTables => FALSE,
                                   force => FALSE,
                                   owner => user);
end;
/

The session which is trying to re-register the XSD will wait indefinitely with a "library cache lock", regardless of whether the other session issues a commit or not. The lock only gets released when the other session disconnects.

I consider this to be an Oracle product defect but of course we'll have to workaround this because Oracle Support hasn't been forthcoming with help recently.
I found a query previously that helped identify the blocking session so that we can complete the process:
select
distinct
   ses.ksusenum sid, ses.ksuseser serial#, ses.ksuudlna username,KSUSEMNM module,
   ob.kglnaown obj_owner, ob.kglnaobj obj_name
   ,lk.kgllkcnt lck_cnt, lk.kgllkmod lock_mode, lk.kgllkreq lock_req
   , w.state, w.event, w.wait_Time, w.seconds_in_Wait
from
 x$kgllk lk, x$kglob ob,x$ksuse ses
  , v$session_wait w
where lk.kgllkhdl in
(select kgllkhdl from x$kgllk where kgllkreq >0 )
and ob.kglhdadr = lk.kgllkhdl
and lk.kgllkuse = ses.addr
and w.sid = ses.indx
order by seconds_in_wait desc
My question is twofold:
- The query above works only on instances that had put 10 gr 2 and not on those that have been built in charges on 11 GR 2 as apparently tit x$ kgllk view and related synonyms are removed in 11G (see Oracle support Doc ID 878623.1).
- Even if I can find other views to use, I don't like the thought of my deployment/upgrade script, through "blindly" to kill a session in order to succeed in restoring the XSD.
How can I do for correctly locking and releasing the XSD to avoid library cache lock? If not, is it possible to clear the cache of library?
Hmm - I think I myself have solved taking into account something that Odie_63 or Marco Gralike had mentioned earlier...
I modified my diagram procedure to release all resources to validate and I no longer get the library cache lock:
create or replace procedure sp_schema_validate_xml(pi_xml IN XMLType, pi_xml_schema IN VARCHAR2) is v_count number; v_err_msg varchar2(4000); v_xml xmltype; begin --do level 1 schema validation if pi_xml.isSchemaValid(pi_xml_schema) = 0 then --level 1 vldtn failed. do level 2 begin --do level 2 vldtn v_xml := pi_xml.createSchemaBasedXML(pi_xml_schema); v_xml.schemaValidate(); end; end if; dbms_session.modify_package_state(dbms_session.free_all_resources); end sp_schema_validate_xml; / -
Snapper shows (Oracle 11.2.0.2 on Linux SLES)
Currently a lot of statements (sql_id 6k5p0akvc7b42) run in several parallel sessions@snapper ash 5 1 all Sampling SID all with interval 5 seconds, taking 1 snapshots... -- Session Snapper v3.52 by Tanel Poder @ E2SN ( http://tech.e2sn.com ) ----------------------------------------------------------------------- Active% | SQL_ID | EVENT | WAIT_CLASS ----------------------------------------------------------------------- 849% | 6k5p0akvc7b42 | library cache lock | Concurrency 100% | 6k5p0akvc7b42 | ON CPU | ON CPU 93% | 2byjh4h8u2xz0 | ON CPU | ON CPU 73% | 2qn7pc3c09cyr | ON CPU | ON CPU 24% | 9k3y572frxzys | db file scattered read | User I/O 17% | b698xf4hs173p | ON CPU | ON CPU 7% | | ON CPU | ON CPU 7% | 6k5p0akvc7b42 | cursor: pin S wait on X | Concurrency 5% | 6k5p0akvc7b42 | kksfbc child completion | Other 5% | bxud62qj6yjx1 | db file scattered read | User I/O -- End of ASH snap 1, end=2012-03-07 09:40:58, seconds=5, samples_taken=41
INSERT INTO xxx (...)
(SELECT...
Of yyy)
Now I wonder how to reduce library cache locks
Can be more (currentyl 50) session_cached_cursors approach?Hello
Please share us with AWR report for 1 h. frequency and show us the load for this profile.
Also check
SQL > show parameter cursor_sharing
SQL > show parameter sessio_cached_cursor
SQL > show parameter optimizerIt looks like not to suffer from analysis which is originally high library cache lock event. Yes sometimes increase session_cached_cursor helps us to reduce the soft analysis. But you need to check if its soft or hard analysis.
See also
Troubleshooting Cache library: lock, PIN and load Lock [ID 444560.1]
Library Cache lock Held for a long time for queries involving too much Lie [ID 1315929.1]bottom
-
Hello
In our 11.2.0.1, database of production that we get an error ORA-00060 deadlock detected every day;
I know that the application must be tuned to solve this problem, but I want to troubleshoot errors using the app guys. When you look in the error in trace files,
I see it; LIBRARY OBJECT LOCK and the object is a sequence, an idea what is the cause of this?
SO: 0x5f3b460e8, type: 74, owner: 0x5fe7216e8, flag: INIT/-/-/0x00 if: 0x3 c: 0x3
       proc=0x5ea473d38, name=LIBRARY OBJECT LOCK, file=kgl.h LINE:8349 ID:, pg=0

      LibraryObjectLock:  Address=f3b460e8 Handle=f5d8bd30 Mode=N CanBeBrokenCount=1 Incarnation=1 ExecutionCount=1

        User=fe7216e8 Session=fe7216e8 ReferenceCount=1 Flags=[0000] SavepointNum=4e244349
      LibraryHandle:  Address=f5d8bd30 Hash=e3516ae5 LockMode=N PinMode=0 LoadLockMode=0 Status=VALD
        ObjectName:  Name=        SELECT SQ_MON_08877.NEXTVAL FROM DUAL

          FullHashValue=62542638cb895b30579930c3e3516ae5 Namespace=SQL AREA(00) Type=CURSOR(00) Identifier=3813763813 OwnerIdn=51
        Statistics:  InvalidationCount=0 ExecutionCount=41554 LoadCount=2 ActiveLocks=7 TotalLockCount=16369 TotalPinCount=1
        Counters:  BrokenCount=1 RevocablePointer=1 KeepDependency=1 KeepHandle=1 BucketInUse=0 HandleInUse=0
        Concurrency:  DependencyMutex=f5d8bde0(0, 1, 0, 0) Mutex=f5d8be58(0, 68797, 0, 0)
        Flags=RON/PIN/TIM/PN0/DBN/[10012841]
        WaitersLists:
          Lock=f5d8bdc0[f5d8bdc0,f5d8bdc0]
OK, so, the deadlock graph shows event you have two sessions involved in the deadlock on TX enqueues, each inmate to 'X' mode and waiting on ' mode.
Now, every session executes an insert statement:
INSERT INTO DeviceVariable VALUES(:1, :2, :3);Then, because it's an INSERT statement, it can be a wait ITL. The only other possibility is a dead end due to cumulative values PK or UK. So what happens, is that each session trying to insert some values that the other session has already been inserted but not yet committed.
The solution is to return to the application logic.
Hope that helps,
-Mark
-
Event of LabVIEW transformation in an external library (DLL) :-(locks
Yes, I tested this solution and got to work.

I see why Labview creates its own queue for events in such a way that callback events are not processed within the DLL code is
 and are waiting to return in Labview.
And when I call the DLL inside another function that executes another asynchronous process (enumeration) this way active queue processing in the application.
It's a strange and not obvious situation.
I only discovered that all of a sudden this possibility during debugging.
I don't see other solutions and cancel this topic.
Best regards
Anatoly
-
Using script - library locked when you try to add the file to it
Hello
I'm just a simple script that I can run with my engines of the action, so if I add new enum values I can create new wrappers quickly. I am able to create a new VI on disk, but when I try to add the the VI to the library, I get "error 1562: library, or the specified project is locked." Just before adding the article, I tried to adjust the State of the library "Not locked", but has not been the tower.
Directions to see the error:
Open attached zip file
Open 'Engine.lvlib Action '.
Run "Script - Create Wrapper.vi.
Please let me know how to get around this, I thank you,
Gregory
There are two reasons at least a library locks: 1) something he possesses is running, 2) is open in two or more instances of the application. (This applies to classes too.)
I started a project and took your scripts out of the library (to avoid the #1) and then open your Library Reference by path in your script, be sure to include the reference of the application (to avoid the #2).
Works now. (With the exception of the Init.vi but you mentioned earlier that you knew about it. But point 1 and 2 of article work fine.)
-
Library lock contention - A Cautionary Tale
We recently encountered a library lock contention problem with our application apex (v3.1.2 on v10.2.0.5 RDBMS) on a site of great volume (800 + users) and I thought it was interesting to share what we found
users reported a serious degradation of performance under load, and a quick look at the top wait events have shown that the contention on the library cache latch is to blame
Top 5 timed events
Event waits time Avg Wait (ms) % Total call time wait class
latch: cache 788 755 106 096 135 15.2 Concurrency Library
free latch 1 599 072 70 099 44 10.0 other
Time CPU 62 604 9.0
DB file sequential read 5 063 905 43 760 9 6.3 user IO
latch: cache library lock 288 246 41 931 145 6.0 Concurrency
We needed to know what was causing the claim, which was where the script excellent tanel poder latchprof.sql (http://blog.tanelpoder.com/) has proven to be invaluable: he showed that there was a special SQL that was causing the problem
SQL > @latchprof name, sqlid % 'library cache"10000;
NAME SQLID Held gets inmate Held ms Avg % hold ms
library cache lock 4dqasqjrvudqn 7880 3548 78,80 allocation 17367,520 4,895
allocation of 6472 3034 64,72 library cache lock 14264,288 4,701
allocation of pine library cache 408 373 4.08 899,232 2.411
turns out it was the call dbms_session.reset_package which is called every request made to the apex DAD
This was also one of the best pieces of SQL by CPU in the database so clearly something was wrong
cut a long story short, the customer has implemented
session_cached_cursors = 75
which at first glance does not seem unreasonable
but since we know that apex almost never reuses the sliders (because he calls reset_package on each request) it seemed too high
the normal recommendation for our apex application is to stick with the default value (20)
the theory being that caching too many cursors just give the call to reset_package too much to do when its being called so often
(on this site, we can see on 50 000 executions per hour on reset_package)
the site has removed the parameter and performance has since returned to normal - and lock contention disappeared
SQL > @latchprof name, sqlid % 'library cache"10000;
NAME SQLID Held gets inmate Held ms Avg % hold ms
3yxpcvrnkzfvd cache library 406 383 4.06 613.466 1,602
Library cache lock allocation 4dqasqjrvudqn 320 320 3.20 483.520 1,511
allocation of cache library 201 201 locking 2.01 303.711 1,511
I hope all of this info can be useful to anyone who is in a similar situation :)Steve-
Cool post. One thing, I thought that maybe worth mentioning is that the default value is 50 for 11.2, which seems to be different from the default 20 you mentioned for 10.2.
-
Shared lock library pool - Cache lock
Hello
I have a blocking session has worked 100% of the CPU for a long time.
Session blocking is latch: shared pool
The other session = Library Cache lock
Module DBMS_SCHEDULER
Action UTL_RECOMP_SLAVE_2
Forward class is Concerrency.
SQL = TEXT
BEGIN

dbms_utility.validate(:1, :2, :3);

END;
select spid from v$process where addr = (select paddr from v$session where sid =) Concerning
-
Unable to repair the permissions of the library!
Hello
I'm pulling my hair out trying to restore access to my library of Photos...
My photo library is located on a Synology NAS. After update macOS Sierra, I would lose permanently the connection to my NAS. Someone on another thread said to use SMB instead of the AFP for file transfer services. I did, and the connection has remained stable; However, since any attempt to open the pictures gives me an error message "repair permissions Library" and wrote "this library is locked or you don't have permissions to make changes. Photos can try to repair the permissions'.» I try to repair the library, and after about 20 minutes, I get "error repair permissions.
Finally, I opened the console to see what was going on, and that's what I saw when the error occurred:
Library Permission repair failed: error Domain = RKRepairLibraryPermissions Code = UserInfo '(null)' 3 = {NSUnderlyingError = 0x61800025ecf0 {error Code Domain = com.apple.library - repair.error = 4 "(null)"}}
If anyone can decode this to give me a clue as to what is happening and how to fix it? Or is there any other suggestions?
I would appreciate any info at all...
See you soon,.
Chris
Vancouver, BC
My photo library is located on a Synology NAS
Photos is not compatible with the NAS volumes. Photos libraries need to be located on an OS X Extended (journaled) formatted volume.
So, copy the library on a volume formatted correctly and open it with Photos. You may need to repair the library by launching it with the command and Option keys.

-
Help me set the permission for the folder/Library/Preferenses
I installed Adobe InDesign CC, but when the program starts. It says: "error. Cannot launch Adobe InDesign that you do not have sufficient permissions to access the preferences folders. Be sure that you have appropriate permissions and restart Adobe InDesign". I found a reason here https://forums.adobe.com/thread/1314214?start=0 & tstart = 0 but I can not add the Admin and showing all users and permission change for all users and admin in read/write. System says that I have enough rights to do this. I am the only user of my MacBook Pro late 2013. I have only one user - admin. My OS is El Capitan 10.11.4. Help please.
Root library is locked by the integrity of the system of Protection (SIP).
However, this isn't the record say these instructions change. You are supposed to change the permissions on your user Library/Preferences, it's what the ~ / means. If you follow the steps precisely, you will reach your user preferences folder. You can get to your library by holding down the Option key and select library from the menu go to the Finder.
Adobe has not yet understood how to properly encode their software for OS X permissions. I don't know why other developers may seem to do, but Adobe cannot.
Change the permissions on the files of Adobe should be all that is necessary. Change the permissions on ~/Library/Permissions and each subfolder is horribly inappropriate.
I would try just add additional access to the Adobe folders located in each specified locations.
-
Two users, a Mac with shared library
Hello
I have problems with the library shared on my mac.
Context:
I have a Mac that marry and I use both, but we both log in as different users.
I have an external hard drive where we have an iPhoto library and iTunes library.
I am registered as an administrator
What I'm doing:
I would like that the wife and I to be able to connect to our separate user accounts, but be able to access the same library, iPhoto and iTunes
What is going on:
When I log into my account, I can access all accounts iPhoto and iTunes without any problems.
When the wife logs on his account it cannot display the iTunes library and the iPhoto library gives a message in the sense of "the iPhoto Library is locked, or on a locked disk...". ».
What I tried:
problem of iPhoto library. If I click on repair, a few minutes later she can see all the photos, however, when I log into my account and open the library, I get the same message and I have to fix it again.
iTunes library issue, I tried to change the preferences and pointing to the location of the folder iTunes media to the hard disk, but it does nothing.
Someone out there who can help you?
Thank you, Tom.
I have an external hard drive where we have an iPhoto library and iTunes library.
How is formatted the external hard drive? It MUST be formatted OS X Extended (journaled) with the property set to ignore that this screenshot:

Then, how the EHD are formatted?

-
Hello
I can't use my photo library - messages that appear are:
1. the iPhoto library is locked on a locked disk or you are not allowed to make changes. iPhoto can try to repair the permissions.
AND
2. "the iPhoto library is locked on a locked disk or you are not allowed to make changes."
You can help someone?
Thank you very much
Dimitar
Where your iPhoto library that Library stored? In your pictures folder, or on an external drive? If on an external drive, how the drive is connected, and what is the file system on the disk?
What happened, until you got the error message? IPhoto crashed? Did you move the iphoto Libraryss
Have you tried to open the library of another user account?
-
DB 9.2.0.8 high library cache latch
We have AIX 5 L (5.3) server with 8 power 6 CORES 4200 MHz (hyperthreading enabled, so 16 CPU virtual) and database Oracle 9.2.0.8 (migration to 11 GR 2 will next year occur). Database is part of the configuration of dataguard with 1 expectation of maximum availability mode database.
Our night work (use to run in 30 parallel sessions in PL/SQL) suffers a statement cache large library (11% free, but sometimes he goes over 20%, then divide by two locking latches are cache library and library cache pins). Database and SQL, we have resolved several times, we have reduced the random disk operations, events, affirmation of channels cache buffer, removed waiting buffer busy but after each issue of optimization of the library cache locks grew (we just found another bottleneck). DB used to analyze the 3 500-4500 per second during this work (due to a bug SYS_CONTEXT), now it's just 45 per second, so we have reduced the number of library cache searches, too.
In the following report statspack (I na not paste entire file, just gerenal information, wait events, statistics, locks and TOP SQL by analysis of calls) we have:
< li > analysis count (total) 117 058
< Li > TOP SQL by parsed (this is recursive SQL, hv = 3286148528) 70 187
In fact, more than 70% of searches of library cache are caused by recursive 2 SQL (like many, I know, recursive SQL is still ignoring session_cached_cursors). I have 8 physical CŒURS, Oracle has created in 9i 17 latches cache library at the start of the instance. I thought most waits on research of library cache were caused by a lock child (because of SQL hv = 3286148528), but I was definitely wrong. Snapshot of v$ latch_children, I've done every 3 minutes and wait were evenly distributed between all the 17 locks .
I don't understand why I expected "library cache" upper 3times then "pine cache library" (WHERE kglupc: child and kglpnc: child). In most our databases (with research in lc low and high run count), we have the two latches at the same level. . Any ideas would be appreciated
It is also good to mention that srver is 0 inactive when the job is running (but our goal is to complete the process as soon as possible). There are no other database on the server, of course.
Pavol Babel
Oracle Certified Master
Published by: Pavol Babel June 21, 2011 23:29STATSPACK report for DB Name DB Id Instance Inst Num Release Cluster Host ------------ ----------- ------------ -------- ----------- ------- ------------ CTP 3761805420 CTPO 1 9.2.0.8.0 NO sd3test Snap Id Snap Time Sessions Curs/Sess Comment --------- ------------------ -------- --------- ------------------- Begin Snap: 196615 18-Jun-11 22:43:43 130 93.2 End Snap: 196622 18-Jun-11 23:26:56 129 112.8 Elapsed: 43.22 (mins) Cache Sizes (end) ~~~~~~~~~~~~~~~~~ Buffer Cache: 3,072M Std Block Size: 8K Shared Pool Size: 1,200M Log Buffer: 16,384K Load Profile ~~~~~~~~~~~~ Per Second Per Transaction --------------- --------------- Redo size: 3,312,111.10 23,670.00 Logical reads: 233,724.40 1,670.31 Block changes: 18,297.28 130.76 Physical reads: 1,102.05 7.88 Physical writes: 1,716.01 12.26 User calls: 27.51 0.20 Parses: 45.14 0.32 Hard parses: 0.13 0.00 Sorts: 3,665.77 26.20 Logons: 0.10 0.00 Executes: 42,748.58 305.50 Transactions: 139.93 % Blocks changed per Read: 7.83 Recursive Call %: 99.97 Rollback per transaction %: 1.42 Rows per Sort: 2.85 Instance Efficiency Percentages (Target 100%) ~~~~~~~~~~~~~~~~~~~~~~~~~~~~~~~~~~~~~~~~~~~~~ Buffer Nowait %: 99.94 Redo NoWait %: 100.00 Buffer Hit %: 99.57 In-memory Sort %: 100.00 Library Hit %: 100.04 Soft Parse %: 99.71 Execute to Parse %: 99.89 Latch Hit %: 99.53 Parse CPU to Parse Elapsd %: 2.90 % Non-Parse CPU: 99.99 Shared Pool Statistics Begin End ------ ------ Memory Usage %: 18.46 18.92 % SQL with executions>1: 84.52 84.58 % Memory for SQL w/exec>1: 74.23 74.95 Top 5 Timed Events ~~~~~~~~~~~~~~~~~~ % Total Event Waits Time (s) Ela Time -------------------------------------------- ------------ ----------- -------- CPU time 15,869 32.09 db file sequential read 2,255,519 10,374 20.98 PL/SQL lock timer 13,010 10,085 20.39 latch free 261,042 5,591 11.31 buffer busy waits 381,101 2,244 4.54 ------------------------------------------------------------- Wait Events for DB: CTP Instance: CTPO Snaps: 196615 -196622 -> s - second -> cs - centisecond - 100th of a second -> ms - millisecond - 1000th of a second -> us - microsecond - 1000000th of a second -> ordered by wait time desc, waits desc (idle events last) Avg Total Wait wait Waits Event Waits Timeouts Time (s) (ms) /txn ---------------------------- ------------ ---------- ---------- ------ -------- db file sequential read 2,255,519 0 10,374 5 6.2 PL/SQL lock timer 13,010 13,003 10,085 775 0.0 latch free 261,042 55,202 5,591 21 0.7 buffer busy waits 381,101 0 2,244 6 1.1 db file parallel write 703,144 0 1,142 2 1.9 LGWR wait on LNS 1,943,337 3,507 984 1 5.4 LGWR-LNS wait on channel 795,292 3,506 981 1 2.2 LNS wait on SENDREQ 352,719 0 832 2 1.0 direct path read 89,263 0 351 4 0.2 log file sync 26,078 2 301 12 0.1 LGWR wait for redo copy 225,228 457 250 1 0.6 enqueue 9,742 0 64 7 0.0 db file scattered read 54,410 0 60 1 0.1 library cache pin 529 0 59 111 0.0 inactive session 60 60 59 977 0.0 log file sequential read 8,505 0 50 6 0.0 async disk IO 17,970 0 41 2 0.0 log file switch completion 973 0 39 40 0.0 control file sequential read 59,062 0 35 1 0.2 library cache load lock 114 0 10 84 0.0 log file parallel write 352,205 0 9 0 1.0 LNS wait on LGWR 2,619,701 0 8 0 7.2 control file parallel write 4,431 0 5 1 0.0 log buffer space 11 0 3 300 0.0 db file parallel read 239 0 2 8 0.0 process startup 37 0 1 24 0.0 wait list latch free 52 0 1 13 0.0 buffer deadlock 206 206 0 1 0.0 ARCH wait on SENDREQ 43 0 0 5 0.0 direct path write 10,377 0 0 0 0.0 library cache lock 1 0 0 179 0.0 row cache lock 6 0 0 16 0.0 log file single write 34 0 0 2 0.0 SQL*Net more data to client 2,265 0 0 0 0.0 local write wait 1 0 0 21 0.0 SQL*Net break/reset to clien 25 0 0 1 0.0 db file single write 3 0 0 3 0.0 SQL*Net message from client 57,311 0 165,393 2886 0.2 pipe get 91,560 2,334 7,523 82 0.3 jobq slave wait 782 770 2,280 2915 0.0 SQL*Net message to client 57,343 0 0 0 0.2 SQL*Net more data from clien 255 0 0 0 0.0 ------------------------------------------------------------- Background Wait Events for DB: CTP Instance: CTPO Snaps: 196615 -196622 -> ordered by wait time desc, waits desc (idle events last) Avg Total Wait wait Waits Event Waits Timeouts Time (s) (ms) /txn ---------------------------- ------------ ---------- ---------- ------ -------- db file parallel write 703,148 0 1,142 2 1.9 LGWR wait on LNS 1,943,340 3,507 984 1 5.4 LGWR-LNS wait on channel 795,293 3,506 981 1 2.2 LNS wait on SENDREQ 352,720 0 832 2 1.0 LGWR wait for redo copy 225,228 457 250 1 0.6 log file sequential read 8,505 0 50 6 0.0 async disk IO 16,789 0 38 2 0.0 latch free 2,655 85 26 10 0.0 log file parallel write 352,206 0 9 0 1.0 LNS wait on LGWR 2,619,702 0 8 0 7.2 control file sequential read 12,133 0 7 1 0.0 control file parallel write 4,425 0 5 1 0.0 db file scattered read 307 0 3 10 0.0 db file sequential read 274 0 1 2 0.0 direct path read 24,738 0 0 0 0.1 ARCH wait on SENDREQ 43 0 0 5 0.0 enqueue 45 0 0 2 0.0 log file single write 34 0 0 2 0.0 rdbms ipc reply 129 0 0 0 0.0 direct path write 10,258 0 0 0 0.0 wait list latch free 3 0 0 10 0.0 buffer busy waits 2 0 0 0 0.0 rdbms ipc message 2,173,078 2,976 30,391 14 6.0 pmon timer 868 862 2,528 2913 0.0 smon timer 64 0 2,461 38446 0.0 ------------------------------------------------------------- SQL ordered by Gets for DB: CTP Instance: CTPO Snaps: 196615 -196622 -> End Buffer Gets Threshold: 10000 -> Note that resources reported for PL/SQL includes the resources used by all SQL statements called within the PL/SQL code. As individual SQL statements are also reported, it is possible and valid for the summed total % to exceed 100 . . . . SQL ordered by Parse Calls for DB: CTP Instance: CTPO Snaps: 196615 -196622 -> End Parse Calls Threshold: 1000 % Total Parse Calls Executions Parses Hash Value ------------ ------------ -------- ---------- 70,187 70,186 59.96 3286148528 select c.name, u.name from con$ c, cdef$ cd, user$ u where c.co n# = cd.con# and cd.enabled = :1 and c.owner# = u.user# 8,686 8,686 7.42 3716207873 update seq$ set increment$=:2,minvalue=:3,maxvalue=:4,cycle#=:5, order$=:6,cache=:7,highwater=:8,audit$=:9,flags=:10 where obj#=: 1
Published by: Pavol Babel June 21, 2011 23:37
Published by: Pavol Babel June 21, 2011 23:46
Published by: Pavol Babel on June 22, 2011 17:22Pavol Babel wrote:
We have AIX 5 L (5.3) server with 8 power 6 CORES 4200 MHz (hyperthreading enabled, so 16 CPU virtual) and database Oracle 9.2.0.8 (migration to 11 GR 2 will next year occur). Database is part of the configuration of dataguard with 1 expectation of maximum availability mode database.In the following report statspack (I na not paste entire file, just gerenal information, wait events, statistics, locks and TOP SQL by analysis of calls) we have:
- analysis count (total) 117 058
- TOP SQL by parsed (this is recursive SQL, hv = 3286148528) 70 187
Load Profile ~~~~~~~~~~~~ Per Second Per Transaction --------------- --------------- Redo size: 3,312,111.10 23,670.00 Logical reads: 233,724.40 1,670.31 Block changes: 18,297.28 130.76 Physical reads: 1,102.05 7.88 Physical writes: 1,716.01 12.26 User calls: 27.51 0.20 Parses: 45.14 0.32 Hard parses: 0.13 0.00 Sorts: 3,665.77 26.20 Logons: 0.10 0.00 Executes: 42,748.58 305.50 Transactions: 139.93 - analysis count (total) 117 058
-
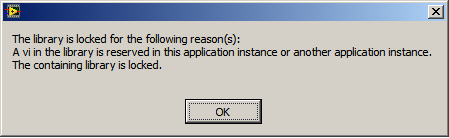
How to edit an xControl when placed in a vi?
I hope that it is a beginners question:
I am to evaluate the use of xContols in an application I'm developing.
As soon as I place an xControl on a façade, it locks the xControl so that I can change is no longer any of the properties.
Y at - it a menu/button option that I choose to allow me to develop its features?
I get this Panel when I'm like "Why this library is locked" - and it's just on the example of the thermometer to double!
At this point, to change the functionality, I need to remove the control from my test application, change the xcontrol and then put it back in. - not Cool!
In the window XControl (project), the XControl and choose "open Library for Editing. Make your changes, then go back and apply the changes to the authorities.


Your library cache issue relates to your 42 000 executions per second, not your 45 analysis per second.
Looks like you need to find a way to keep some run very frequently statements in a pinned - what is in your Top SQL by executions, and state how it is called the pl/SQL? I wouldn't hire me what anyone at the moment, but cursor_space_for_time setting to true may be relevant to your case.
Concerning
Jonathan Lewis
Maybe you are looking for
-
shortcut keys are available for the calendar and tasks features. The buttons should be removable via customize like any other icon on the toolbar.
-
Using my Bluetooth of Plantronics 340 headset as headphones pc VOIP.
I try to use my bluetooth headset from plantronics with my computer, such as a microphone/earphone combination, with the popular game software of VOIP Teamspeak. I have a laptop from a different manufacture under XP SP3. My Bluetooth stack is an a To
-
How to use your printer as a memory card reader
Have you ever wanted to open the files in the memory card reader, on the printer, with the (Windows) computer? Is the printer connected via Ethernet or wireless? * If the answer to both of these questions is YES, then this is the solution for you. Fi
-
How do I access the system restore from the bios my 32-bit vista starts up?
I have vista home basic 32 bit and recently uninstalled a program I have used barley I used uninstall programs. It then prompted me pourredemarrer my computer after doing so, I am nowunable to pass the 'lights', he goes to Jordi screen w / mouse enab
-
How can I install AotoCad 2007 in Windows Vista Home Premium please?
I just installed AutoCad 2007 on my laptop running on Windows Vista Edition Home Premium, only to discover that they are not compatible with each other. Is there a solution to the problem please? Thanks in advance. Karl