non-linear system
I use nD system no single linear solution.vi trying to solve two equations in two unknowns. I know how to do this.
But the question is how can I add a variable (that I don't want to evaluate non-linear system ND unique solution.vi) for example 'c' I want at the entrance of another VI. Similar to the way used in a formula node.vi, where you can add an entry.
One way to do this is to use the substitute Variables.vi. I have modified your VI to take the name of the parameter as an input ('c') and converted the numeric value to a string to create a substitution rule.
Tags: NI Software
Similar Questions
-
non-linear system Solver more equations than unknowns
Is it possible to solve a nonlinear system with more equations than unknowns in LabView. I do a triangulation and data from several sensors, so I'm able to write 6 equations in order to get the 3 coordinates (x, y, z) as a solution. In LabView, I was able only to solve a system of 3 equations with this 3 unknowns, but I would use the set of 6 equations in order to obtain a more accurate solution, given that some measures can be noisy.
Thanks in advance
You can use the non-linear curve code to solve this problem. Consider the following system:
3XY + y - z = 12
yx + x ^ 2 + z = 12
x - y - z = - 2
Arrange to get 0 right side. x, y and z are the paramneters to be in shape. The entrance to the curved Fti.vi Y non linear will be an array of three zeros. Initial settings will be an array of three values, for example [1 1 1]. An example is attached.
-Jim
-
apply restrictions for the non-linear curve fit
Hello Forum users,.
I am currently working on a VI control which is supposed to create a specific model of pressure inside a hollow tube to provide a test environment for pressure sensors. The details are many and complicated, so let's say I am sure that my formula to calculate this profile according to the pressures inside the hollow rings around this tube will work.
To find the correct pressure for each ring values, I've linked to a model VI containing this form to Lev. - Mar algorithm (the non-linear curve adjustment) and let it run.
Technically, there is no problem and Lev - Mar find values to adjust the function for the values (not perfectly sure, but close enough).
The problem is, however, that, since the device, once suitable values for the positioning and size of the rings are found, must be built, the simulated pressure rings perhaps intersect not between them. To apply this rule, I added a check to my VI of model and if the values passed to Lev - Mar breaking the rules, the VI model gives a matrix of zeros to follow him (I tried an empty array, but that only leads to error messages).
This solution did not work. Lev - Mar seems to ignore these cases always looks for values that break my rules (and if I put these values through my model VI, I get a matrix of zeros, as expected, so the audit seems to work).
Perhaps I misunderstood the algorithm of Lev - Mar and it does not actually check each possible defined coefficients of finds.
Is it possible to adapt to any function of a set of values while keeping the predefined boundary conditions?
Oh, before I forget:
I use LabVIEW version 8.2 in the Institute, because the workshop systems is not installed 8.5 for some reason any.
Thanks in advance
Thaliur
Hi Thaliur,
Thanks for posting on our forums.
I understand your request you expect the algorithm to ignore a case to all zeros in the table. However, it is not implemented like this.
Good news is, its source code can be edited and you could save your own personalized version of the algorithm of screws it is to you that you just add a check for a matrix of zeros or simply pass another parameter which indicates only a case of "broken rules". Then you would not have to continue the calculation.
If I misunderstood your question, please clarify this. You can also post a code for further explanation, if you wish.
Good luck with the project!
Peter
-
The non-linear curve fit lev mar problem
Hi, I have a set of 10000 readings recorded every second. My goal to draw these vs time readings (1-10000 s) in logarithmic scale and adjust the exponential curve that results with my model equation: a1 * exp (t * b1) + a2 * exp (t * b2) + a3 * exp (t * b3) + a4 * exp (t * b4) and get the values of the coefficients (a1 to a4, b1 - b4). I changed the non-linear adjustment of lev - mar.vi according to my model. However, I ran into a problem. I get the following: error-20041 occurred at LM.vi:5 to get on the curve of the NI_Gmath.lvlib:Nonlinear Possible reason (s): the system of equations can be solved because the input matrix is singular. I can't work on why I get this error. I enclose 3 files: the data file (values of Y), X = 1-10000; coating not get my model and vi vi.
I'm using Labview 8
I would appreciate your help and suggestions! Thank you very much in advance. ANU
Hello
@Jim-thank you very much... ur modified vi helped a lot... but a strange thing on the adjustment is that it depends a lot on the estimation of the coefficients... my model should have values of 'a' coeffs in the order of 10 ^-7 and 'b' should be higher around 10 ^-1. The initial proposal is amended the best coefficients made vary accordingly.
I don't really know if this can b fixed... I enclose my vi.
VI: - non - linear adjustment model, exponential branch.
data - pol.txt
I appreciate you all!
-
Hi guys!
I'm working with electrical circuits and I need to know how to solve a linear system with more than 03 variables, such as a 5 x 5 systema.
How can I solve it?
Hi!, @Jucimar_C:
Try, if they serve, the Spanish language, the following examples video...
FIRST HP: RESPOND TO SISTEMAS ECUACIONES...YouTube app -
Satellite Pro 4200: ACPI BIOS non-compliant system - NTLDR is missing
Toshiba Satellite Pro 4200 series, ACPI BIOS non-compliant system
I have an old Toshiba Satellite Pro 4200 series, I tried to install win98 2000 and xp, but it never completes the whole upward, I get these messages;
ACPI BIOS non-compliant system
and
NTLDR is missingI have looked for a bios update but can't find one for the 4200, can anyone help?
Thank you
Hello
Have you tried to reinstall the OS using the Toshiba Recovery CD?
"I found the troubleshooting of Microsoft on the NTLDR is missing ' error message.Please check this:
http://support.Microsoft.com/kb/318728 -
Hi all
How can I get the slope of a particular point in the non-linear curve? I use Lev - Mar curve fitting is not linear. The slope is to determine the dynamic resistance of the current-voltage curve of diode if dynamic resistance = 1/slope. Kindly help...
-
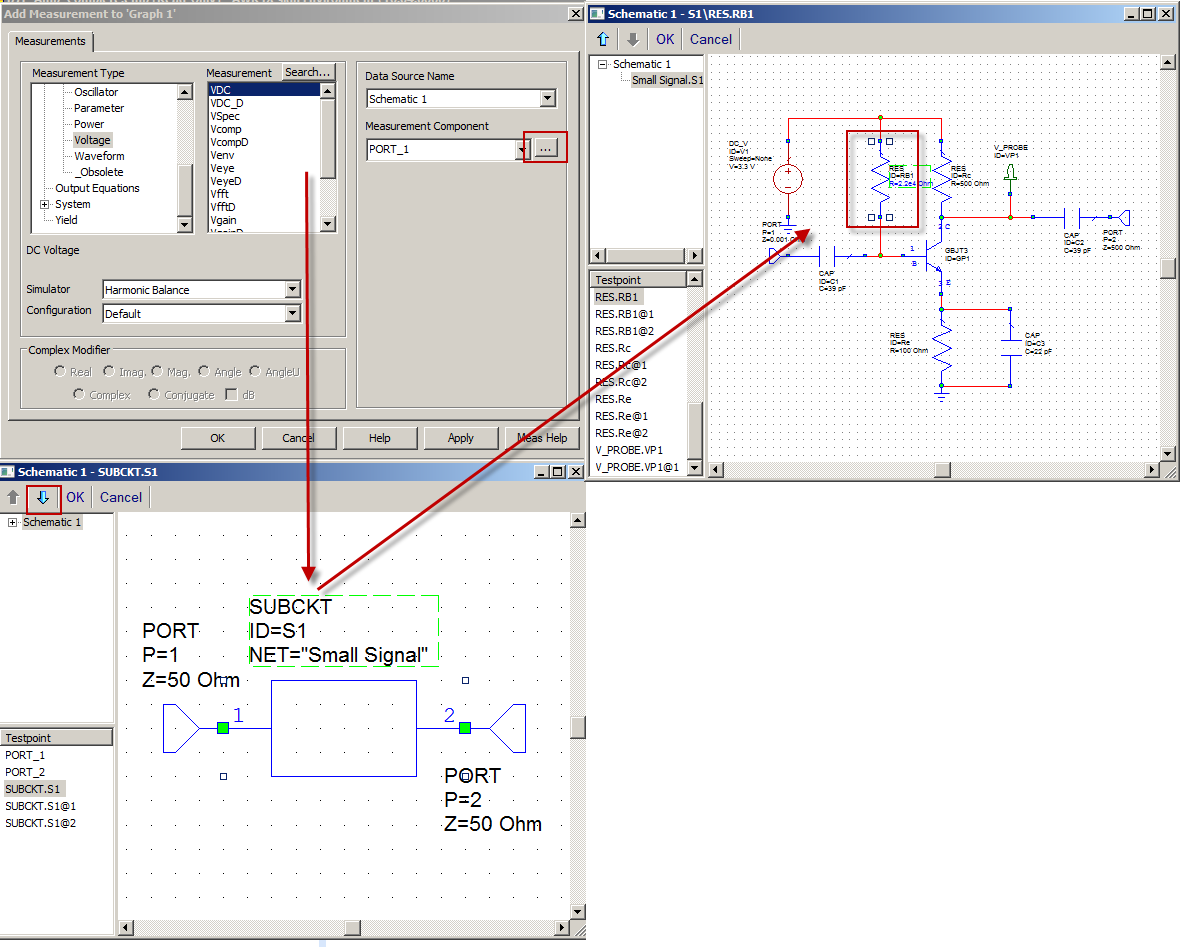
How can I make measurements on a node or a non-linear element in a subckt
I'm trying to do non-linear measures (especially the voltage) on the various elements that are in a secondary circuit of my high level design. Is there anyway that I can select a particular node to perform these measurements on?
Hello
You can do in the measure dialog. Once you have the winodw dialogue measure, there will be three dots next to the measuring element right and then you can click on it and a new window opens. In the new window, click on your desired sub-channel and click on the button on the top and then select the node you want to your measurement to make. I've attached a photo showing the three steps that we discussed.
I hope that helps!
-
How to calculate the equation of dataset using 'Fitting VI' (non-linear or polynomial fit)?
I have the datasheet of a NTC (thermistor negative Coefficient) and I want to calculate the most approximate equation
that describes its behavior. The table has values of temperature and resistance. If the resistance of the NTC varies according to the temperature it detects. I tried the following:
-Excel: polynomial adjustment
-Maple: polynomial adjustment
-LabVIEW: Polynomial Fit.vi
I've been doing equations with a not very good approximate parameteres. I suspect that this method 'Polynomial FIT' it is not the best method for this type of data/equation (being a non-linear equation).
So is - that someone has used the non-linear Fit.vi matching the behavior of a dataset object? If so, can you explain how this VI... I would really appreciate it.
Thanks in advance and I will wait for your reply.
-
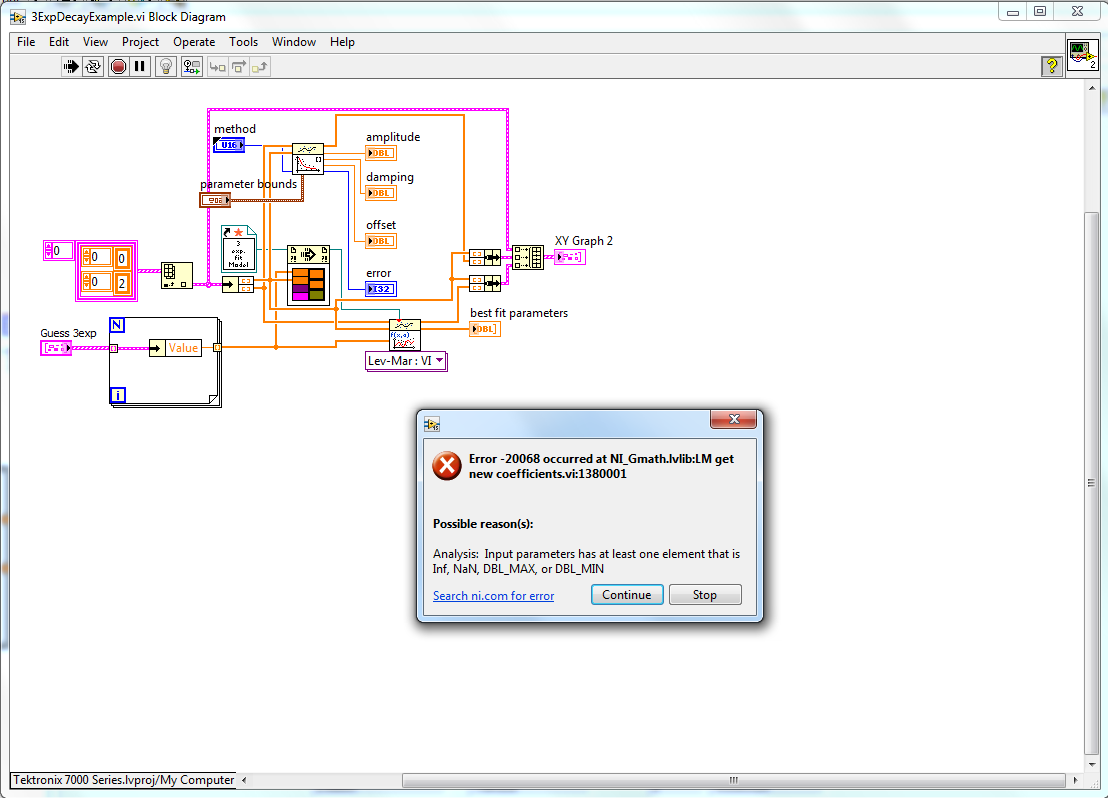
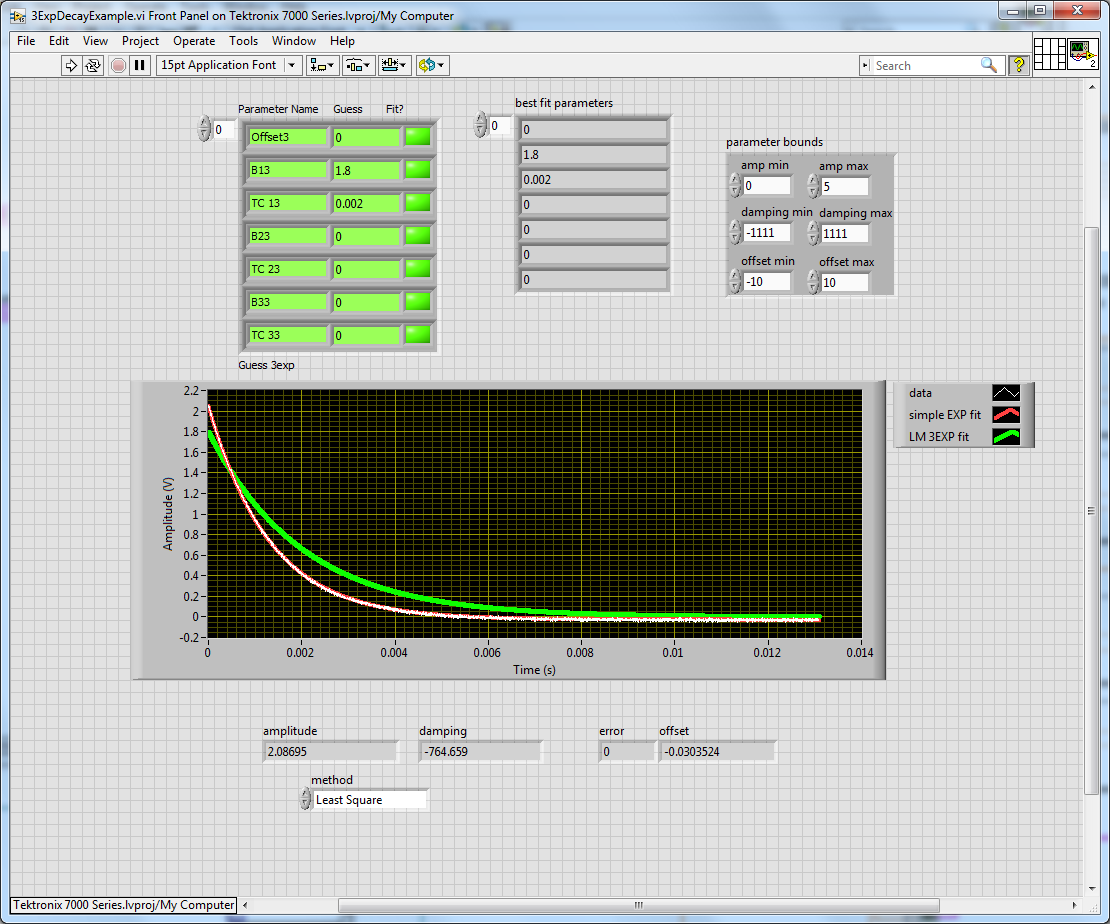
Non-linear curve Fit error 20068?
Trying to do a simple 3-exponential decay curve nonlinear. I have a copy of this work in the other screws, but it doesn't seem to work in this VI. I use "Scalablemultiexponentialdecay" of Altenbach as a VI/template model. Data that I'm trying to adapt are a series simple decomposition RC, yes I realize that should not have 3 exponential components, it's just the model data. I am able to adapt with the Fit exponential function built in to the Math palette, but which only works if the input bounds parameter is wired and with rational constraints. However, I get an error on the adjustment of the non-linear curve that I understand not (photo attached) indicating that an INF or NaN is done in the settings. I don't see where this is going...
Any questions or help is appreciated.
I thought so, only 0 s for the 2nd two exponentials. But, if I replace all the guess seededes with the same as the simple exponential Installer, it converges without error. I guess I didn't know it was that sensitive. Thank you.
-
Non-linear curve fit the model of reference file
Hello.
I use the VI of the non-linear curve adjustment in order to adapt the data. The reference to the fitting VI model I use is included in the attachment. You can see that I have a few constant wireline, like 4, 2500 and 1. I want to do this constant variables I'll change before each curve corresponds, because actually in my problem this variables I know before the adjustment and they are constantly changing, and for the moment this made VI just to test.
The problem I have is that I can't enter the values of this variable to my main VI, where I also call the VI was nonlinear. The scheme of connection of refernce VI made must be changed in order to be recognized by the VI was nonlinear. I tried to use a table to transfer variables, but if I use one, it recognizes the variables as parameters of editing and he's trying to install as well in the adjustment process, and it gives me erroneous results.
Any ideas how I can add the values of variables?
Thank you very much.
Kind regards
Nikola comedy
To provide additional data randomly in VI of model, you must use the entrance of 'data' (it is a variant and so can contain anything you want!). Just create any type of data you want (generally a cluster if there are several values of different data types) that contains all the values, convert them to a Variant in the main VI and the variant of wire to crimp her. In the model, you convert the variant return to data, to the constant help of cluster, such as defined in the main as VI 'type' (simply right click cluster in the main VI... wire Create constant... move the constant in VI of model). Now, to unbundle the different values and use them anywhere inside your model.
-
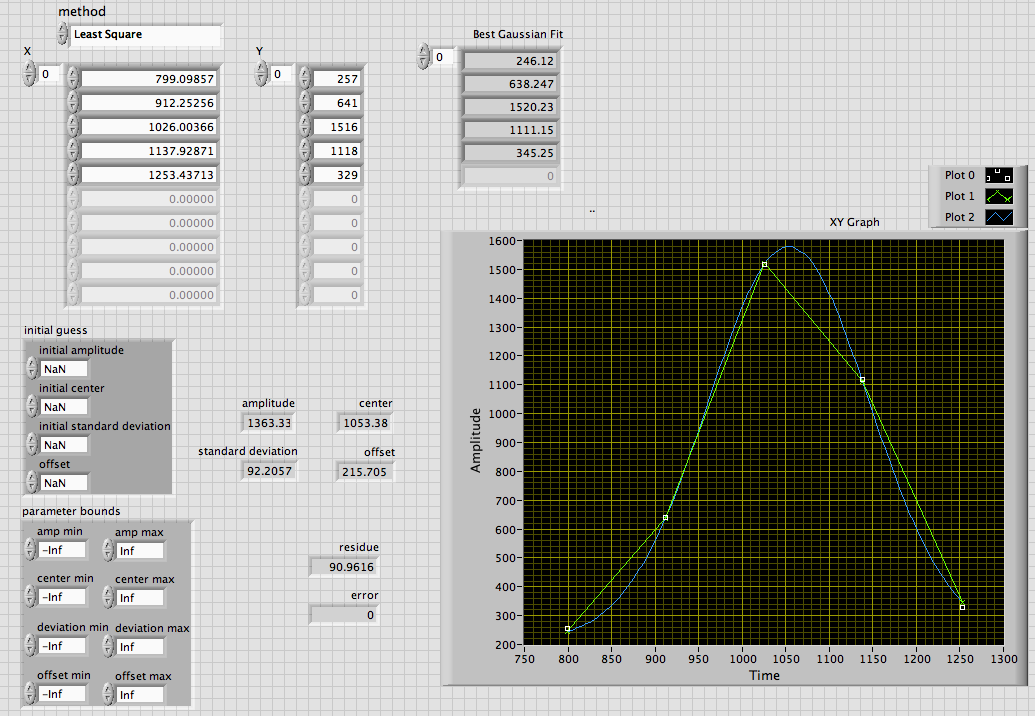
Fit Gaussian Peak and non-linear curve Fit on small data differ from the PEAK of origin made
Hi all
I'm developing a program in which I have to adjust the curve of Gauss on only 4 or 5 data points. When I use the Gaussian Ridge Fit or adjustment of the curve non-linear, it connects linearly all the points so that other editing software like origin's curve fitting of Gauss on the same set of data that I have attached two images is LabVIEW with Fit Gaussian of Peak and nonlinear adjustment and other is original.
The data are
X Y
799.09857 257
912.25256 6411026.00366 1516
1137.92871 1118
1253.43713 329Interesting.
The initial default values assume all are NaN, which causes the LV calculate conjecture. The default values for the parameter Bounds +/-Inf with the exception of the offset that are both zero. This, of course, forces the output zero offset. It seems a strange fault, but they may have a good reason for it.
Change the limits of compensation to something else translates the output being offset ~ 215 and the Center moves to ~ 1053. These correspond the original result to 5 significant digits.
Lynn
-
Adjustment of the non-linear curve - maximum iterations exceeded (error-23026)
Hello
In my application, I use the curve non-linear adjustment VI (Levenberg-Marquardt) to adapt the data acquired continuously using a task DAQmx. Often in the course of the implementation of the instrument, the curves are not yet "adaptable" and max iterations set in the parameters of expiration is reached.
It's OK but the problem is that it generates an error (-23026) that stops the execution of the VI.
How can I ignore this error and continue to run the VI until the termination is controlled by the setting of tolerance?
Kind regards
Bernard
Hi Bernard,.
Need to wire the error output and handle the error programmatically.
-
Non-linear curve shape VI don't, get error-20068
Hi, I have a problem of raw data to a formula of mounting. The formula is f (x) = - ax + b + c (x/d) ^ e. I use the non-linear curve Fit VI, Lev - Mar: the formula string. I'm able to calculate 4 5 parameters (a, b, c and d). I can't calculate, but it should be around 10. When you run the VI, it gives me "error-20068 occurred at NI_Gmath.lvib:LM get new coefficients.vi:1. " "Analysis: input parameters has at least one element that is Inf, NaN, DBL_MAX or DBL_MIN"
It is tracing the equation based on the initial settings without actually finding the best adjustment of the parameters. I also tried using the VI version to create the formula, but it gives me the same error. What can I do to avoid this error? I have attached the vi and a data file.
Some of your top X values are negative. Remove them and things will work fine.
(You get a negative signal for the exponentiation, which is allowed if the entry is complex or the exponent is an integer. This isn't the case here, where the exponent is not an integer. The exponent is an integer in the first function call, but not more once, trying to calculate the partial derivatives of the model. Try with a hypothesis of 9.9 instead of 10, and it will fail immediately)
-
Introduction to the tutorial of curve fitting - curve example of non-linear editing
As stated in my first question, I asked yesterday I'm new to labview and I always work in the curve editing tutorial, but I am now up to the non-linear section (although I jumped the polynomial stuff for now). So my question now to do the with the vi illustrated in Figure 14 of the Introduction to the tutorial Curve Fitting.
My problem this time has do with graphic design for data non-linear Gaussian and adapt. Looks like it gets its data from a cluster of some sort which is itself drawn to clusters separate construction. The problem is that I can't find the appropriate function of cluster, which will result in the production of a graph. I had a test using a variety of different cluster functions and also have a look to try to use a matrix function and none of them work. Now, an assumption that I did is also that the graph is of the form XY (and not a waveform graph).
Note that I am aware that part of the problem could be my lack of experience in coding using labview, as I've attached the vi that I worked on.
I'm using labview 8.6.
Thanks again for any help.
Do not use the function you are using. Use the cluster on each plort bundle, then build the table of these 2 groups.
To the Subvi, you right-click the entry that caused the broken arrow and choose create constant.
Whenever you have a problem trying to find the right data type into a Subvi. Do a right click, create constant. Now, you will have a default constant of the correct data type that you can modify as needed.


Maybe you are looking for
-
Printer Wi - Fi doesn't work anymore?
Long story short, disconnected all the plugs and surge protector to move to a new office. My Canon PIXMA MX490 printer wireless connected & work until April 7, 2016, but when I tried to print something the next day I got this: "Support the Code 300 p
-
Online banking, sign in - cannot see the whole box with random code form
I tried several times to log on my site of banking in line, but even if I use the format of mobile banking and I'm in landscape mode, I can't visualze the whole box that contains the random code and therefore it cannot open a session. I can do on my
-
During the scan, the half of the page is black
All of a sudden happened during the scan I get half of the color of black (dark grey) page. Page is cut vertically. Please can someone help. Shud I go to service. I tray to change to the USB cable is no difference. Any help? MIKI
-
Can I use view Lab for agent based modeling?
Dear all, I have a project to do, it is the optimization of the costs associated with the management of the maintenance in a particular type of contract.I'm looking to take an agent based modeling for the project. I just started using Labview and I d
-
I get a blue screen almost every day
Hello I need help. I get the blue screen almost every day. Here are 4 last minidumps. Thank you JB ==================================================Dump file: Mini090510 - 01.dmpCrash time: 05/09/2010 15:00:51Bug Check String: KERNEL_MODE_EXCEPTIO