Norma 4000 waveform measurement
Hello
I have 4000 Norma connected via rs232 and I want to get the waveform of voltage in labview. Something like DSO. I can do this in NORMA View (which is developed in labview), but when I try to do in labview with lnopa01 v09 pilots it doesent work. When I try to make measures it's ok, but when I try to save in memory and read then it returns error.
trigger memory was missing... case closed
Tags: NI Software
Similar Questions
-
NI9225 waveform measurement of network 230VAC
Hi all
I measure the waveform complete (time of the voltage signal) the local power grid with a voltage of 230V L1 - N with a NI9225 module.
Peak values (RMS) 230VAC * 1 414 = 325V pic.I can't to scale greater than + 300V M.A.X parameters entered.
In the statement indicates that the module can measure 240V electric networks.
Can directly measure the shape of wave or shoul, I use a 01:10 for measures voltage divider?
Thanks in advance
Regards Christof
Text of the Manual:
The NI 9225 300 module input analog Vrms C Series has been designed for the waveform of signals measures high voltage. The Vrms 300 range allows line-neutral as a line of measures of electrical of 110 V and grids of the 240 line-neutral networks V. Three NI 9225 channels make the ideal module for a three-phase system. Measures voltage waveform are required to follow events like sag, swell, transient power quality and harmonics. Combine the 9225 OR with the NI 9239 (10 V) and a current transducer to create customizable power quality monitor or a power measurement system.
Die Skalierung as AC measurement wenn ich die richtig Spec understand habe ist.
BIS + / 425VDC ist der range sogar in der Spec angegeben.
Also im bereich messen und deine Wfrms bekommst 300V 240VAC mit schönen Sinus...
No vote was now a screw also as Poweranalyse Schön mitkommt, aber your über etwa 15 Perioden so sicher detection...
10:1 Tastkopf kann nicht schaden, if abgeglichen.
Offenbach... VDE?
-
Need a little help to understand the features of measure or-scope
Hi taurna,
The Stats.vi measure will take a measure through the complete waveform acquired in that particular record. Help on the Fetch Multi steps Stats.vi:
The waveform on the digitizer calculates waveform measurement is to
an acquisition that you launched previously.But according to the measure of the positive width, you see only the first pulse width. The definition of the measure can be found below (note the use of 'first two mi'):
Positive width
C/C++ equivalent: NISCOPE_VAL_WIDTH_POS
The time difference in seconds between the first two mid reference
crossings, where the slopes are positive and negative respectively. A
Digital hysteresis is used to find the points.Help on the num in the statistics section:
Num in stats returns the
number of measurements to calculate the statistics.Saying "1" here, he did a single measure on your single purchase you took, since the while loop was taken out of your code. If you want several measures to make, you need several acquisitions.
-
Harmonic distortion VI Analyzer
Hi all
I am analysis of data from the ADC with some of the waveform measurement palette live. The "Harmonic Distortion Analyzer vi' seems that all useful but gives me heard sometime. I compared the amplitude fundamental and harmonic signal in two ways: from a FFT and by converting the amplitudes dBV (I'm able Volts). The two emerged from the same vi, but there is a gap of about 3 dB between the two. Am I missing something basic?
Hope you could help me with this.
Amir
Hey Amir,
I tried to reproduce what you call, and I am able to see a small gap (about 3 dB) between my two outputs. That's when the FFT Ridge to Ridge, with Hanning window (which is default for the VI of harmonic distortion Analyzer).
This discrepancy disappears when TFF going to RMS, which indicates that the VI Analyzer of harmonic distortion output of RMS amplitudes. To make sure that it is correct, try to change the settings of your FFT and see if the gap disappears.
If this isn't the case, please go ahead and post a sample of your procedure VI, as Anna suggested, so that we can solve this further.
Thank you
-
Hi all
Currently, I measured distance of a piston of my TEST machine running with out LVDT (analog voltage to a data acquisition card). How to measure speed, because I see no way to measure the piston travel time! I use LV 8.5.
Thank you
How absorbing data now you? What is point single acquisition or a waveform measurement? If you take the derivative of the waveform, which would give you the velocity.
-
Hello.
In my application, there is a system which makes the measures.
Then these measurements in a table and in a file.
I want to create a button that when you press new window opens and graphic waveform measurement is displayed here.
I understand that I need a Subvi, but how to open in a new window?
Thank you
Go-> VI properties-> select 'window appearance' the traction of categories in the menu dropdown-> file and click on the button customize and set the checkmarks as showom in the figure below. This will launch the vi with the visible façade
-
LeCroy Waverunner TCP/IP error 85 code in Labview
Hello
I tried to contact LeCroy Waverunner 64Xi via ethernet. I read the other posts on how to set up the connection and I thin it is not working properly as it responds well when tested through the Measurement & Automation Explorer.
The name of source VISA looks like this.
The question that is on all Labview codes, if I get an error:
"Error 85 has occurred to the channel Scan (arg 1) in lcwave wait to purchase Complete.vi-> lcwave single Waveform.vi of reading."Error 85 has occurred to the channel Scan (arg 1) in lcwave wait to purchase Complete.vi.
"Error 85 has occurred to the channel Scan (arg 1) in lcwave reading (Px) .vi waveform measurement.
the reason given is-> Scan failed. The input string does not contain data in the expected format.
I'm guessing it's because the code itself is not configured for TCP/IP connection? Help
Nevermind, I found another component that can help with this problem
-
Max and Min of successive summits with a different amplitude
Hello
I have a signal having different successive Max and Minima.ie each pic + / is having a different value.
I wanted to get successive + / maximum values of the. CSV file.
I'm done with the chart from .csv file, but I am not able to get values of crete please help.
What function can I use?
How about waveform peaks?
Check it out. Heres where it is:
Programming > Waveform > Analog Waveform > waveform measures > waveform monitoringThis is peaks and valleys (maxs and mn).
It will then display locations (x-value) and amplitue (value y) point.
-
Read file measure to XY Chart of waveform
Something pretty simple that gives me a hell of a time right now.
I have a .lvm here who was rescued from an acquisition of data and has a column of numbers from 0.0000 - 27.0000 to very small no. The next column is the amplitude of the signal at the point. Now this file LVM I'm starting a new vi and I want to read those values x and Y and get them on a waveform graph. Now, I tried hanging 'Reading a file measure' and tried to "Build the Table", but who do not want to connect on a chart. Rather the file directly on a chart causes two very different lines is displayed but is no where near what I'm looking for.
Some tips on how to complete it?
Tasty,.
More often than otherwise, I find screw Express to be more trouble than they are worth. Here is an example of reading data tab delimited in a .txt and tracing the values of are against X a value on a chart. It will be useful.
Andrew
-
static/digital waveform output and low frequency measurement of voltage - SMU-6358
Hello
1. I have an attached VI [digital_voltage_output] who must generate a logical true or false static state in the output of the device/port0/line1 Word to say. When the VI works I click the button several times, but nothing happens to the port0/lines1.
2 such a thing [digital_voltage_waveform_output_square] if I'm trying to generate a digital waveform to pin the same with the waveform generating VI. If I connect a waveform chart to the output of the generator function VI, then the chart will show me the good waveform I want, but still nothing is written to the text file.
3. I have read the manual for the X series cards, but it remains unclear for me a little how to things of the road in LV I have a measure of the frequency measurement VI low frequency that I downloaded. It offers me the ports for the supply frequency - ctr0, 1, 2, etc. As far as I'm concerned the PFI ports are responsible for these types of actions. How can I find out the LV that I want to connect say ctr0 and pfi0? »
I use LV 8.6.
Thank you
Kriváň
Hi Kriváň,
The problem you had with the choice of a specific digital line as a physical channel, is that the control that was previously used in this example was created for a data acquisition task that uses a whole port rather than a specific line. I was able to overcome this problem by removing the control and recreate. The control now gives you the option to choose the specific digital lines e.g. port0/PXI1Slot2/$line0.
I was also able to overcome the error of-200802 you mentioned. I was able to do this in a real constant of wiring at the entrance to auto-start the VI DAQmx writing then remove the DAQmx beginning the subsequent code VI. The modified code is attached.
I hope this helps.
Best regards
Christian Hartshorne
NIUK
-
Detection of the contours of a measured waveform
Hello
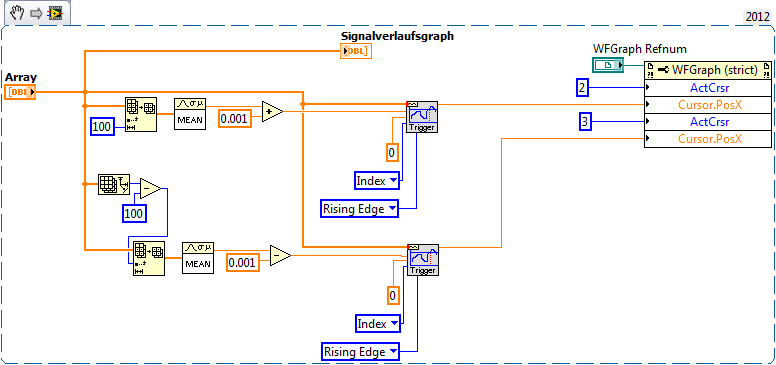
I'm trying to detect the edges of a measured waveform. My ideas using peak detection or threshold has failed. Attached is an example of a waveform. I try to find edges, marked of a cursor.
I would be very happy if someone has a good idea.
Thank you very much.
Best regards
Michael
You can change the enum to the VI edge detector to detect the rising or falling edges. You have only to increase edges in your current signal, so you might find the signal low medium and medium high signal and find where the data that passes through in both places. I moved the thresholds of 0.001, but you would need to define an arbitrary passing threshold so that it is not triggered by the noise.
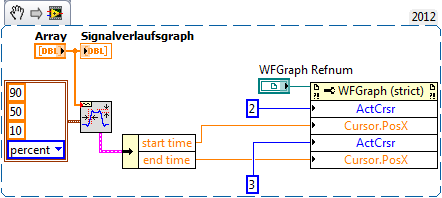
You can also use the VI transitional measures in waveform > Analog Wfm > measurements. This VI allows to specify thresholds in percentage of the transition (or absolute value) and find the start time and the end time of the transition.
Again, be careful with the effect of noise in States of high/low if you try to measure the transition points near the levels down.
-
Continuously measure and write waveform using PDM
Hi all
I'm doing my thesis by using Labview 2010 (since this is the only version currently available in University
 ). I need to read and save data from the microphone (currently to simulate a signal because I need to make the program work first) then save and analise IT (has not reached this point yet). I tried to use the structure of the event in order to record and then play tdms files. But unfortunately it saves only a small piece, then I inserted while loop, so it will record continuously but the program is not responding after registration, I push and I can only manually close the toolbar it. Please does someone could help me or suggest that something since I'm not very good for Labview and any comment is welcome. Here's what I've done so now. I tried searching forums for a similar solution but did not find anything useful (some had a much newer version so I could not open). Thank you.
Hi and welcome to the forums,
The reason why you can not stop the waveform recording or exit the application is because you have the case of the events set to "lock the table until the end of the matter for this event" (in edition events). This means that LabVIEW will not respond to the user until the end of this structure of the event, but because you have the option to press the while loop stop to complete the structure of the event means that you have a blockage and abandon the VI.
The architecture of your application is not ideal - I highly recommend everything that takes a long time to execute within the structure of your event for the above reason (obviously you can uncheck lock as a quick fix Panel). I think I have a look at the design of producer/consumer model (events) (new... > model > frameworks) because it would be more appropriate for your application. You can manage your button presses in the structure of the event and have a state machine in the loop at the bottom for starting, running and stopping of your data acquisition.
The idea is that you don't do very little inside the event structure so it frees up the façade, but the messages (e.g. power acquisition data, quit the application) are managed by another loop.
I don't know if it comes in LabVIEW 2010, but there are examples of projects that include a project in 2012/2013 "continuous measurement and logging" which may be suitable for your application. There are also examples of the State machines and managers of messages queued.
-
Save the Studio measure waveform graph as a file for reading later
Hello
I would like to know if there is an easier way to record data are rendered on a waveform graph (configured as a graphic of the band) to capture incoming data in the code and send copies of it to a file. It would be nice if there was a method to do this, with all relevant metadata stored in the file (color, etc.). Better yet, the file could then be opened in a labview application (for example, a TDMS file) for later review.
Thank you.
PS. I use VS2010 and MS 2010.
So, it looks like you already have all the data points. For metadata that you mentioned, line color, plot colors, point colors, line styles, etc. are all accessible from the properties so if you wish, you can retrieve all that data.
I think that upon return from t0 is the same compensation history, you can use the ClearData() method.
-
How to take the measurement time of waveform.
Hello
I faked a square signal I need to measure the period of time without interruption... automatic measurement of the time for one cycle...
For example, I have square wave, and I need to measure the period of time and display it without attributing all outside sliders... I need automatic measurement of it...
is that what you want?
(I just added the period detect your VI)
-
Measurement of frequency triggered? NEITHER 6259
I'm trying to work out how to implement a measure of frequency (of a pulse train) which will be triggered by another external pulse to a different channel.
I have an encoder that is attached to a rotating shaft, that generates square pulses 5V on two different channels: the first string gives one pulse per revolution of the shaft (my planned trigger pulse), the second string gives a pulse all the 1/2500th of a revolution (IE all 0.144º)
Seeing a pulse of "channel one" (the pulse of a time-by-rev), I want the system to begin to measure the frequency of the pulses on the 'two way '. This isn't the average frequency during the ENTIRE revolution I'm after: what I'm shooting looks more like an angle vs revolution frequency waveform graph, for a ride (IE with 2500 data points).
It does not matter if the processing time means that the system of "lack" an impulse to start on the next revolution, because it can always wait for the next. The most important thing is that the beginning of the frequency measurement is triggered at the right time.
So far, I have used L'Express VI/DAQ Assistant to implement a measure of the frequency of the pulse 0.144º: I'm wiring these impulses to PFI9/CTR0 of Council 6259. I used a continuous acquisition of 2500 measures. The expected frequency range is about 40 to 200 kHz (2500 pulses per rev at between 1000 and 4000 RPM.)
That works very well, and I can establish a curve of angle vs. frequency of revolution, BUT... For now the beginning of the acquisition is completely arbitrary; That is, it starts when I type 'run '. I can't understand the best way to trigger the acquisition of the OTHER channel impulse.
There is no external trigger options in the DAQ assistant page, so I wonder if this is still possible using an express VI - do I have to use lower level stuff?
I am convinced that this should be easy!
Thanks in advance
Theo
Rico, Brad,
Thank you very much for your comments, I'm pleased to say that we have sorted in the end.
The first question concerned the fact that the Board I was using (PXI-6133) is not able to make a measure of frequency of trigger in this way.
It was a big problem because even if the LabView code was right it works always, leading me to doubt the code and become even more confused! However, using the same code on a Board 6259 worked like a charm.
I used the DAQmx blocks to set up a channel to measure frequency and a trigger, set the shutter button using the property with an arm.start node as in your example.
Thanks again for your help!
Theo
Maybe you are looking for
-
Streaming video from copmputer
I want to model 23-059 all-in-one with HDMI output. How to stream videos from my all in one to my LG TV with a hdmi cable?
-
Windows does not recognize the Publisher or publisher certificate (Norton)
I tried to install an update to Norton (360.5) and windows did not recognize Norton/publisher certificate. Norton contacted and they spent about 3 hours trying to install the update and concluded that it was a windows problem and said I should check
-
Error IRQL_NOT_LESS_OR_EQUAL in Vista blue screen
Hello At the start of my laptop, Vista restarts, it temporarily running and displays Blue error as follows: IRQL_NOT_LESS_OR_EQUAL Technical information: STOP: 0X0000000A (0X00000002, 0X00000001, 0X00000000, 0X81E577E0) I have try several methods, st
-
I do not understand how a w/l flash works on a6000 sony... the built-in flash works as a controller or I need some external hardware
-
Is there anyway I can cancel my subscription and cancel the huge tax?
I tried to cancel my subscription because I barely use the software and I'm not even going to be a student again, above all that its quite expensive. I would be very well pay the next episode, either, as long as I can cancel it. But for some reason,