Pie chart does not
Hello
I have a file of class LoadXML his does not work can someone help me in that.
package
{
import flash.display.MovieClip;
import fl.transitions.Tween;
import fl.transitions.easing.Strong;
import flash.display.Sprite;
import flash.text.TextField;
import flash.text.TextFormat;
import flash.text.TextFieldAutoSize;
import flash.net.URLLoader;
import flash.net.URLRequest;
import flash.events.Event;
import flash.filters.DropShadowFilter;
public class PieChart extends MovieClip
{
private var piechart:MovieClip = new MovieClip();
private var titles:Array = new Array();
private var values:Array = new Array();
private var xmlFile:XML;
private var pie:Number;
private var radiansSoFar:Number = 0;
private var urlLoader:URLLoader = new URLLoader();
private var tween:Tween;
private var format:TextFormat = new TextFormat();
public function PieChart():void
{
/*Text Format*/
format.color = 132744;
format.align = "left";
format.font = "Century Gothic";
format.size = 11;
LoadXML();
buildPieChart(xmlData);
}
private function LoadXML(file:String = "pie.xml"):void
{
urlLoader.load(new URLRequest(file));
urlLoader.addEventListener(Event.COMPLETE, parseXML);
}
private function parseXML(e:Event):void
{
xmlFile = new XML(e.target.data);
//trace(xmlFile);
pie = xmlFile.children().length;
//trace(pie);
buildPieChart(xmlData);
}
private function buildPieChart(xmlData:XML):void
{
var titleList:XMLList = xmlFile.item.title;
var valueList:XMLList = xmlFile.item.value;
for each (var titleElement:XML in titleList)
{
titles.push(titleElement);
}
for each (var valueElement:XML in valueList)
{
values.push(valueElement);
}
var colors:Array = new Array();
colors.push(0x990000);
colors.push(0x000066);
colors.push(0x990099);
colors.push(0xFFFF99);
colors.push(0x336699);
colors.push(0x330000);
colors.push(0x99CC00);
colors.push(0x000033);
colors.push(0x663366);
colors.push(0x333300);
colors.push(0x330033);
var radians:Array = new Array();
var totalValue:Number = 0;
for(var i:int = 0; i < values.length; i++)
{
totalValue = totalValue + Number(values[i]);
}
for(i =0; i < values.length; i++)
{
radians.push(Number(values[i])/totalValue*2);
}
drawlines(250, 250, 200, radians);
function drawlines(centerx, centery, radius, radians)
{
var colorkey:Number = 0;
var coloralpha:Number = 1;
var shadow:DropShadowFilter = new DropShadowFilter();
shadow.distance = 2;
shadow.angle = 45;
shadow.color =0x000000;
for(var i:int = 0; i < radians.length; i++)
{
piechart.graphics.beginFill(colors[colorkey], coloralpha);
piechart.graphics.moveTo(0,0);
piechart.graphics.lineTo(Math.sin(radiansSoFar*Math.PI)*radius, Math.cos(radiansSoFar*Math.PI)*radius);
piechart.graphics.lineTo(0,0);
piechart.graphics.endFill();
piechart.filters = [shadow];
piechart.x = stage.stageWidth/2;
piechart.y = stage.stageHeight/2;
for(var n:Number = 0; n <= radians[i]; n += .0001)
{
piechart.graphics.lineTo(Math.sin((radiansSoFar+n)*Math.PI)*radius, Math.cos((radiansSoFar+n)*Math.PI)*radius);
}
radiansSoFar += radians[i];
stage.addChild(piechart);
addLabel(radians[i], titles[i], radiansSoFar, radius, colors[colorkey], coloralpha);
if(colorkey == colors.length-1)
{
colorkey = 0;
coloralpha -= .25;
}
else
{
colorkey += 1;
}
}
}
function addLabel(radians, itemtitle, radiansSoFar:Number, radius:Number, color, coloralpha)
{
var format:TextFormat = new TextFormat();
format.align = "left";
format.font = "Century Gothic";
format.size = 11;
//format.bold = true;
var label:TextField = new TextField();
label.width = 1;
label.height = 1;
label.autoSize = "left";
label.antiAliasType = "advanced";
label.text = itemtitle + "( "+ Math.round((radians/2*100)).toString() + "%)";
label.border = false;
label.setTextFormat(format);
var textRadians:Number = radiansSoFar-(radians/2);
label.x = (stage.stageWidth/2)+Math.sin(textRadians*Math.PI)*radius;
label.y = (stage.stageHeight/2)+Math.cos(textRadians*Math.PI)*radius;
if(textRadians > 0 && textRadians < .5)
{
label.y -= label.height/2;
label.y += 10;
label.x += 10;
}
if(textRadians > .5 && textRadians < 1)
{
label.y -= label.height/2;
label.x += 10;
label.y -= 10;
}
if(textRadians > 1 && textRadians < 1.5)
{
label.y -= label.height/2;
label.x -= label.width;
label.x -= 10;
label.y -= 10;
}
if(textRadians > 1.5 && textRadians <= 2)
{
label.y -= label.height/2;
label.x -= label.width;
label.x -= 10;
label.y += 10;
}
if(textRadians == 0 || textRadians == 2)
{
label.y += 10+label.height/2;
}
if(textRadians == .5)
{
label.x += 10+label.width/2;
}
if(textRadians == 1)
{
label.y -= 10+label.height/2;
}
if(textRadians == 1.5)
{
label.x -= 10+label.width/2;
}
stage.addChild(label);
}
}
}
}
Here's the XML file
<? XML version = "1.0? Encoding = "utf-8? >
elements <>
< item >
< title > < /title >
< value > 26 < / value >
< / point >
< item >
b < title > < /title >
< value > 14 < / value >
< / point >
< item >
c < title > < /title >
< value > 9 < / value >
< / point >
< item >
d < title > < /title >
< value > 6 < / value >
< / point >
< item >
e < title > < /title >
< value > 3 < / value >
< / point >
< item >
f < title > < /title >
< value > 3 < / value >
< / point >
< item >
g < title > < /title >
< value > 2 < / value >
< / point >
< item >
h < title > < /title >
< value > 1 < / value >
< / point >
< item >
TV < title > < /title >
< value > 36 < / value >
< / point >
< / object >
You are welcome. Please mark the thread as answered if you can.
AS3 Alpha is 0 to 1, not 0 to 100
Tags: Adobe Animate
Similar Questions
-
Chart does not display not when No data Message found
Apex workspace version: 4.2.0.00.27
Internet Explorer 9
Flash graphic
Oracle Database 11 g Enterprise Edition Release 11.2.0.3.0 - 64 bit Production
I have developed a standard 2-d column chart that works very well when there are data. I created the graph with the property "When no. found data Message" as "No data Found".
But this message does not appear when there is no data. The entire table is completely empty. I do not use a custom xml part. It is a simple, standard 2-d column chart. I could see the message "Waiting for data" briefly for a second, then the table renders as white space. I just want the "No data found" message appears every time the data source group is empty.
I tried to create a diagram of the test in a virtual space that is running on the 4.2.3.00.008 apex version. Whenever the source dataset contains zero return to recording, the message "No data found" seems in good condition.Any ideas or suggestions?
I'm sorry. The question above was going on because my source dataset returned some NULL records even when there was no valid data. (inner left join instead of join). This is the reason why the chart didn't show a message "no data found". It's a coding problem, not a problem of the apex. I apologise for the confusion.
-
Order of the data rows of Gantt chart does not match the order of the lines in the timeline
Hello
I have a project with tasks parent and child gantt chart. It works fine except that the order of the rows in the datagrid control does not always match the order of the lines in the timeline. If it should not match? In addition, in the timeline, in some cases the period of the child does not appear directly under the parent period. Is this a bug or am I missing something? How to get the lines in the correct order?
Tiina
Published by: Tiina on 11.11.2010 01:08Tiina salvation,
Thank you update data, which solved one of the questions. Now for the actual order of the elements in the timeline - if you take a look at the order of the data in the XML table, calendar entries are just that reflects the order in which the data was returned by the query. So although I suggested using an ORDER BY ID condition on your request, you are actually better off using a START WITH... CONNECT BY clause for resultset hierarchical of output.
I created 2 page in your application (a copy of page 1), where you can compare the difference between the paintings pages 1 & 2, in terms of appearance and also the order of the tasks in the XML file.
I hope this helps.
Kind regards
Hilary -
CC of Dreamweaver (2015) - color chart does not spell insert or an RGB value in the CSS file?
When I use the color picker Eyedropper to retrieve a color from a CSS file screen, by clicking on the color closes the dialog box but does not insert the color.
Suggestions?
It sounds as if you use the selector of color in Code view. In Code view, Dreamweaver expects you can enter the value manually. Use the pipette from the creator of CSS.
-
chart does not appear when published
I have a slide which was imported from the PP that contains a background graphic. It shows in captivate 6, but when published the bottom part does not show.
Any ideas?
It's good to hear. Please mark this thread as answered so that other users will not have to scroll down to find the post that contained the solution.
-
Chart does not take into account the parameters
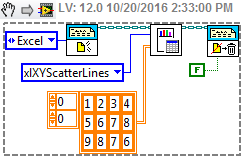
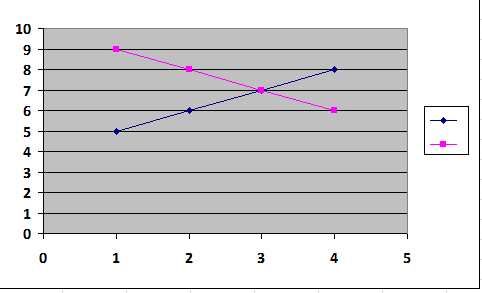
Hi all
I have a small question: I would like to create a special GUI similar to the user interface of an oscilloscope. So I have a table 1 d with a lot of points and I would like to be able to zoom in for example of data. It sounds easy enough, but see the attached VI that illustrates my problem:
I use the chart properties to programmatically configure the axes of x. All right, if you move the control "Horizontal Scale / DIV" to "10". Min and max of the x-scale values are calculated to be 0 and 100, the main graduations appear in the position as good and correct the look of minor ticks (5 minor ticks by main graduations). The problem starts already if you change the control to "9". Min and Max are still ok, but the gap between the main graduations should be 9, not 5 (where he gets 5?).
Also, if you enter the horizontal offset as '5' and put the "horizontal scale / DIV ' to '10', LabVIEW pulls a main graduations every 10 5 and are not all as it should be.
Did someone knows if there is that an option on here which replaces somehow my settings?
Thanks for the help.
Dennis greetings
Try to set XScale.Increment after setting the XScale.Maximum and XScale.Minimum.
-
Pie chart is not visible in IE 8
Hello
I use jdev 11.1.1.5.
I use dvt:piegraph to view my result. The graphic is loaded properly on firefox. But its not visible in ie8.
< dvt:pieGraph id = "pieGraph2".
value = "#{bindings." RiskGraph1.graphModel}.
Subtype = 'PIE' threeDEffect = 'true '.
"partialTriggers =": tt1: sor3.
inlineStyle = "width: 250px;" "height: 250px.
contentDelivery = "immediate".
dynamicResize = "DYNAMIC_SIZE" >
< dvt:background >
< dvt:specialEffects / >
< / dvt:background >
< dvt:graphPieFrame / >
< dvt:seriesSet >
< dvt:series / >
< / dvt:seriesSet >
< dvt:sliceLabel autoPrecision "off" = >
< af:convertNumber minFractionDigits = '1 '.
maxFractionDigits = "1" / >
< / dvt:sliceLabel >
< rendered dvt:pieLabel = "false" / >
< dvt:legendArea automaticPlacement = "AP_NEVER".
position = "LAP_BOTTOM."
scrolling = "asNeeded" / >
< / dvt:pieGraph >
Thanks Frank for the answer. OK, I'm going to use the new version of ie and jdev and see if it persists.
For now, I found a solution, I've used ImageFormat = "PNG" by default, it took FLASH.
Concerning
Shubham
-
Chart does not not with BI Publisher
Just started with BI Publisher, now I'm trying to get the Barchart job with that. Right now I use the word template and xml file manually feeding it.
That's what said the BI Documentation
But when I add, I do not see the Web tab.Right-click the image to open the Format Picture palette and select the Web tab. Use the Alternative text entry box to enter the code to define the chart characteristics and data definition for the chart.
Sincerely, JessicaYou can take a look at the demo of http://www.oracle.com/ocom/groups/public/@otn/documents/digitalasset/176430.swf for a better understanding
-
Word chart does not display correctly
Hello everyone,
I'm writing a chart in word as a line graph and it is constantly as a bubble chart or a graph group.
I have attached a picture of the part of my code, where the graphical representation occurs. Is there a problem here, or what is the format of the data? (1st row x all other values of y lines)
In addition, it displays error - 214... the strange thing that happens sometimes with ActiveX. Can it be fixed by dragging the graph to quit at close report after?
Thank you
Anthony
Copy the following code:
This graph product
-
With the help of former RoboHelp 4.1
When I generate a main layout of my project and then access some topics graphics do not appear.
If I have access to the other sections of the graphics are there. If I look at a subject that do not present graphics and then return to this topic the graphics do not appear.
I can only close and reopen to get some graphics to show up.
Probably not the best way to ask, but ask me and I will answer you.Hello ChatMatt,
I'm not sure I quite understand the problem you are having, but I hope that I can be useful in any case. Try to look at the properties of the image in the browser to see if it points to the correct location. In Internet Explorer, follow these steps:
(1) right click on the placeholder image.
(2) select Properties.
(3) check that the URL is correct.Other things you can check:
* Can you open this image in a browser manually (file > open > Browse to the image)?
* Is this image a valid web image? By this, I mean the jpeg or gif format RGB (not CMYK) colors. If you are using Photoshop, you can open the image and use the backup of the levels of Web feature to make sure that you're out a valid web image format.I hope this helps.
Thank you
Bobby W
Adobe customer service -
the color chart "load" command does not in InDesign 2014 and 2015
The "load the color chart" command in the Panel color chart does not in InDesign 2014 and 2015. Cannot click the Pantone or any other collection, they are all faded. I have already trashed the Preferences folder and restarted ID and Mac. It started only once I have updated to the latest version of CC, but now it affects 2014 and 2015. Don't know what to do, I don't like reinstalling one or the other. Tried to go back to the CS6. All solutions anyone? Thank you!

Color chart of load control is for loading samples from other documents or a swatch file.
Use the new swatch command to add a color.
-
setCurrentRowWithKeyValue in the Gantt chart project ADF does not work. ?
@
Im trying to Create, Updat and delete tasks in Gantt Project chart. Create works very well. But when I try to Delete or Update, its doing the update and delete operations of the first entry on the chart. Its been not to delete and update for the selection of task Im. ?
I don't know what's wrong. I tried to setCurrentRowWithKeyValue, by the operationBinding, its still does not...
@
My bean Code:
{} public void handleDataChanged (DataChangeEvent dataChangeEvent)
BindingContainer links is BindingContext.getCurrent () .getCurrentBindingsEntry ();.
_Type int = dataChangeEvent.getActionType ();
If (_type is DataChangeEvent.DELETE)
{
DCBindingContainer bindings1 = (DCBindingContainer) BindingContext.getCurrent () .getCurrentBindingsEntry ();
DCIteratorBinding iter = bindings1.findIteratorBinding("projectTask1Iterator");
Line r = dcIteratorBindings.getCurrentRow ();
OperationBinding operationBinding = bindings.getOperationBinding ("Delete");
Map params = operationBinding.getParamsMap (); -> First of all here its not not getting the value, I don't know why. I tried to print Im getting printed here NULL values
params.put ("rowKey", dataChangeEvent.getTaskId ());
-> Values no. here too...
operationBinding.execute ();
}
ElseIf (_type == DataChangeEvent.UPDATE)
{
OperationBinding operationBinding = bindings.getOperationBinding("setCurrentRowWithKeyValue");
Map params = operationBinding.getParamsMap (); -> First of all here its not not getting the value, I don't know why. I tried to print Im getting printed here NULL values
params.put ("rowKey", dataChangeEvent.getTaskId ());
-> Values no. here too...
operationBinding.execute ();
DCBindingContainer bindings1 = (DCBindingContainer) BindingContext.getCurrent () .getCurrentBindingsEntry ();
DCIteratorBinding iter = bindings1.findIteratorBinding("MyIterator");
Line r = dcIteratorBindings.getCurrentRow ();
createTaskPopup (null);
}
-To call createTaskPopup method-
{} public void createTaskPopup (PopupFetchEvent popupFetchEvent)
System.out.println ("Popup");
UIComponent base = JSFUtils.findComponentInRoot ("f1");
Popup RichPopup = (RichPopup) JSFUtils.findComponent (base, "p1");
AdfFacesContext.getCurrentInstance () .addPartialTarget (popup).
FacesContext facesContext = FacesContext.getCurrentInstance ();
ExtendedRenderKitService service is Service.getRenderKitService (facesContext, ExtendedRenderKitService.class);.
service.addScript (facesContext, "var AdfPage.PAGE.findComponent = popup (\" "+)")
popup.getClientId (facesContext) + "\"); Popup.Show ();");
ADFContext.getCurrent () .getPageFlowScope () .put ("forceActivate", "true");
}
}
Can someone help me solve this problem please.
Why isn't deleting or updating Im a selection. ? dvohra21 470275 Bob Rhubart-Oracle
It worked for me...
If (_type is DataChangeEvent.DELETE)
{
OperationBinding opBinding = bindings.getOperationBinding("DeleteProjectTask");
Key = dcIteratorBindings.getCurrentRow () .getKey ();
System.out.println (Key);
dcIteratorBindings.setCurrentRowWithKeyValue (projectTaskId);
opBinding.execute ();
}
ElseIf (_type == DataChangeEvent.UPDATE)
{
Key = dcIteratorBindings.getCurrentRow () .getKey ();
System.out.println (Key);
dcIteratorBindings.setCurrentRowWithKeyValue (projectTaskId);
createTaskPopup (null);
}
{} public void getTaskId (TaskSelectionEvent taskSelectionEvent)
Add the code in the event here...
This code gives all the tasks selected by the user
String s = taskSelectionEvent.getTask (m:System.NET.SocketAddress.ToString ());
String [] arr = s.split("");
System.out.println (Arrays.ToString (arr));
projectTaskId = arr [0];
}
{} public void popupDialogListener (DialogEvent dialogEvent)
If (dialogEvent.getOutcome () .equals (DialogEvent.Outcome.yes)) {}
OperationBinding opBinding = bindings.getOperationBinding("CommitProjectTask");
opBinding.execute ();
}
ElseIf (dialogEvent.getOutcome () .equals (DialogEvent.Outcome.no)) {}
OperationBinding opBinding = bindings.getOperationBinding("RollbackProjectTask");
opBinding.execute ();
}
}
{} public void createTaskPopup (PopupFetchEvent popupFetchEvent)
System.out.println ("Popup");
UIComponent base = JSFUtils.findComponentInRoot ("g1");
Popup RichPopup = (RichPopup) JSFUtils.findComponent (base, "p1");
now find component IDS of the region
UIComponent partTable = JSFUtils.findComponent (base, "p1");
dial the PPR on your component found
AdfFacesContext.getCurrentInstance () .addPartialTarget (popup).
FacesContext facesContext = FacesContext.getCurrentInstance ();
ExtendedRenderKitService service is Service.getRenderKitService (facesContext, ExtendedRenderKitService.class);.
service.addScript (facesContext, "var AdfPage.PAGE.findComponent = popup (\" "+)")
popup.getClientId (facesContext) + "\"); Popup.Show ();");
ADFContext.getCurrent () .getPageFlowScope () .put ("forceActivate", "true");
}
}
-
Graphical tool to sectors: a tiny sector does not appear in the whole pie
I have a pie chart that I made which contains several sectors. Two of the slices are. 1%.
 (With numbers):
A slice (the yellow one) can easily be seen while the other seems to be incredibly small - you need to place the slices in the way to see it.

This is what the data looks like (the first line includes quotes to force numbers appear in the wedges of pie):

The two have chosen filling colors and both have the value 'Transparent' race What would cause a slice to appear much smaller than the other? The only thing I can think is that I turn the pie at a time given, but I don't see how this would have caused a tiny slice of change because I shot the whole pie, not only a slice.
There is no preferences GPU or improve fine lines for CS6. You will need to edit the chart in the future? If not, then just copy and paste a copy of the other small on the top where it should be.
-
PANTONE + does not match the previous Pantone spot color chart. I have several customers who are using spot colors in logos etc and now these colors are a mess. Can I get and use the old color for Illustrator books?
Well, the spot color has not changed, but the way they were simulated four-color changed, they now use color management to get to the nearest ink possible task.
Here is some info:
-
First off I would like to say that the code works on the other two (dev) PCs; but by operating on my clients PC - when the lance the façade program seems to load correctly except where the 3D graphical indicator is the area still shows everything on the monitor before (ie the place never gets repainted). All three PCs are Win7 and running LV12
If this is not a problem of LabVIEW, but something with PC graphics? or video settings?
Just thought that maybe this is a common thing with graphs (?) 3D and maybe someone can direct me in the right direction to a solution.
Thanx
lmd2
Ah, an ATI/AMD card. Would that maybe this problem has been corrected in sp2 LV2012?
365679 Optimization of 3D image of LabVIEW does not work with the AMD video card drivers.
BR,
/ Roger


Maybe you are looking for
-
I have a report created from visual basic 6. Is it possible that I can send it as e-mail out of visual basic without using another program or database. One has code to do this. I tried in vain.
-
Original title: applesyncnotifer has stopped working pop-up that said, apple syncnotifer.exe cannot locate the component. This application has failed to start because corefoundation.dll was not found. Re - install the app may fix the problem.
-
Cannot open the files on the laptop Gateway
Original title: Hello ppl Hello! my name is isabel. and im trying to fix my gateway labtop. Im having openning problems my files, which will be sucjest guys I do.
-
Shredder.msi - where can I get it back?
My setup requires this file and will not continue without it. There is no shredder.msi on my laptop Acer Aspire under Win 7. Where can I get shredder.msi?
-
A bit off topic-Virtual Hosting
About ready to download my first site via FTP.Through the registration of my domain name, they asked me to get out of the virtual hosting.Have no idea what it means so in terms real simple anyone could explain to me what it is.