Response value of NaN. Yokogawa dl9040 oscilloscope
Hello
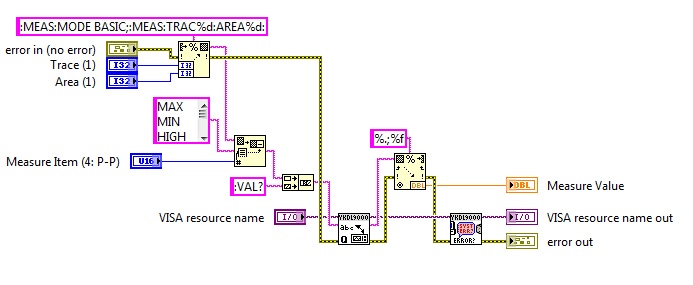
I'm controlling an oscilloscope via GPIB. The oscilloscope is the company of Yokogawa DL9040. I use the supplied driver of NOR and it works properly. With the driver, I can communicate with the instrument without problems (acquire signals, save image). However, I have a problem, try to measure certain parameters of the shape of wave frequency, duty cycle, and others.
My problem is that the response of the oscilloscope to any query is NaN. For example, if I want to measure the frequency of track 1 (channel 1 wavefrom) I must write the followign command:
: MEAS:TRACE1:AREA1:FREQ:VAL?
And unfortunately, the answer is Nope. I do not understand this, because if I measure the frequency manually with the keys of the instrument the frequency is 10 kHz.I do not know what is wrong or what the things that I have to configure. I must also say that this happens with any measurement parameter (burst, Maximum, MInimum...).
I have attached the VI that I used to measure parameters.
Any help is appreciated.
Thank you.
I mean time between commands that are sent. You may need to configure the measurement, wait so long, and then request data, demand being the: VAL? command.
Tags: NI Hardware
Similar Questions
-
Why does the period display NaN? What does it mean "NaN"?
I have a vi that is supposed to measure values of period 3 and 2 tension using DAQmx. The vi is attached.
When I run the vi, I get no error, but one of the counters display NaN instead of a period (in seconds) value. Why would this counter not appearing? See the .jpg image of the screenshot, which shows the lights on the front panel, after execution and stop the vi. Note that the period 2 shows "NaN" but, period 1 and 3 show a real value. "NaN" only displays in "period 2" executing too. ' " "Period 2" never displays a numeric value. Moreover, as "NaN" actually mean?
Appreciate your thoughts.
Thank you
Dave
(using 3 counters in the cDAQ-9174 and the module OR 9401 plugged into the chassis cDAQ; periods are measured from the encoders)
NaN means not 'a number '.
In your code, Mean.vi will return NaN (with the error-20003) if the input array is empty.
What happens if you connect the signal of the 1 meter or 3 to counter 2? If NaN disappears, then there is a problem with the signal currently connected to the meter 2.
- Your current code, using usrs to (unitialized shift registers), will produce NaN when running for the first time.
- The size of the usrs to will increment at each iteration.
- If your VI is used as a Subvi, the means will be bad for the first 15 iterations since they will be calculated with the values of the usrs to--> previous lengths.
You must use PtByPt.vi means that will calculate the average of the X last values without above mentioned problems.
-
Correlation coefficient vi Labview 2013 for two tables 1 d of zero, r values is NaN.
I don't know why?When you look in VI, you can see that the final calculation involves distribution of the 'r' by the size of the Y input. Therefore, when you leave the entry is empty you will have size 0 which end in "Infinity" which is displayed as NaN therotically. Can you show what are the inputs X and Y in that you are breastfeeding?
-
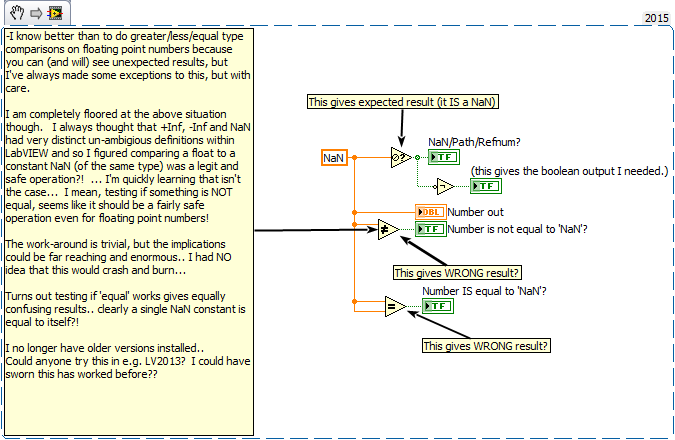
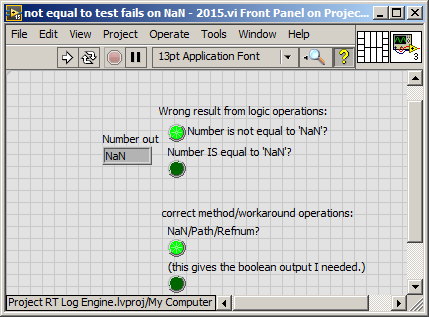
Comparing NaN constant (s) with buggy results!
Hey people NI Forum!
I know that I should be very careful when comparisons on point numbers because of rounding and representation issues.
That said, I completely took off guard when I wanted a Boolean "true" If a number is NOT equal to "NaN"... I wasn't thinking too, slinging just wire a conditional fast for Terminal loop for a few tests, I was doing a temporary VI and put in place with a primitive "does not correspond to" (instead of the "Not a number/path/refnum" primitives.)
The result took me by surprise, and when I dug into it, it became even more strange... it turns out that comparing a single constant itself will produce unexpected results too!
Is this how it has always been, or what ' s NEW in LV 2015?
I've included a LV 2011 version if someone wants to try on an old version... I ran this on a Windows 7 PC.
While it would not make sense, it's well documented behavior.
Documentation:
EQUAL? Function
If you compare two entries with the value not a number, NaN or an entry with the NaN value to an entry with a different value, this function always returns FALSE. Use the is not a number/path/Refnum? function to compare one or more entries with a value of NaN.
(even for different?)
-
Development of type float NAN of Python
I am writing the Python 2.6 code that is interfaced with NI TestStand 4.2 via COM in Windows. I want to do a value "NAN" for a variable, but if I pass
float('nan'), TestStand displays asIND. In other words, my code was something like:locals_prop_object.NewSubProperty(var_name, win32com.client.constants.PropValType_Number, False, "", 0) # Set the initial value to NaN--although it appears in TestStand as 'IND'. locals_prop_object.SetValNumber(var_name, 0, float('nan'))Apparently, TestStand distinguishes between floating point "IND" and "NAN" values According to TestStand help:
INDcorresponds to the signs of the NaN in Visual C++, whileNANcorresponds to QuietNaN
It means that Python
float('nan')is indeed a signalling NaN when passed through COM. However, from what I've read on the signaling NaN, apparently signaling NaN is somewhat "exotic" and quiet NaN is your "regular" NaN. So I have my doubts that Python would pass a signaling through COM NaN (how can I verify this?).So, any ideas how Python float ('nan') becomes TestStand "IND", the Python-> COM-> stream TestStand?
Now I tried with NI TestStand. First of all I've tried:
quiet_nan = struct.unpack(">d", "\x7f\xf8\x00\x00\x00\x00\x00\x01")[0]# Set the variable's value in TestStandlocals_prop_object.SetValNumber(var_name, 0, quiet_nan)But that always appeared in TestStand as
IND. So I created a TestStand file with the value of the variablesINDandNAN, and read values from Python. It turns out that TestStandNANhas the valueFFFF000000000001. According to summary graphics Kevin , it is a quiet NAN negative.Then, finally, it works (well that is probably specific to the platform; it works for me on Windows XP):
# Make a NAN suitable for TestStandteststand_nan = struct.unpack(">d", "\xff\xff\x00\x00\x00\x00\x00\x01")[0]# Set the variable's value in TestStandlocals_prop_object.SetValNumber(var_name, 0, teststand_nan) -
Values in a dialog box application answering the multi-line text box field
Hello
When the user clicks on a radio button in my form a response request dialog box is displayed for the user to enter data.
The value of the response dialog box is then added to a multiline text box.
The script is on the mouse to the top of the radio button action and works fine the first time you click on the radio button.
If the radio button is checked once again, the value of the response dialog box replaces the existing value in the multiline text box.
What I need to do, is to have the response values show on a new line in the text box whenever you click on the option button.
Can any advise please how to revise my script to work?
Target for the field multiline text box
var t = this.getField ("ActionAgenda");
Response from dialog when the user clicks on the radio button
var cResponse = app.response({)
cQuestion: "enter your Action Agenda Item."
({CTitre: 'Action program'});
Alert if you cancel
If (cResponse == null) {}
App.Alert ("Action point not will be not entered");
Place the data in the dialog box in the target domain
} else {}
t.Valeur = cResponse;
}
Any help will be greatly appreciated.
Thank you
Change this line:
t.Valeur = cResponse;To do this:
t.Valeur += "\n" + cResponse; -
How to check if the variable (of type uint) has a value or not?
Hi all
I'm just trying to write an instruction conditional to check if my uint variable has a value or not. I tried to check "null" and "undefined", but without any luck (see below)
private var _tempIndex:uint;
...
...
If (_tempIndex! = null) {}
code here
}
had an error with that one, then tried
If (_tempIndex! = undefined) {}
code here
}
had an error with that as well.
So, how can I check if a variable has been assigned a value or not? Any ideas? Thanks in advance!
Mike
A uint always has a value between 0 and 2 ^ 32-1 inclusive. It cannot store a value 'no' as undefined or null. If you declare a variable of type uint without assigning a value, it is given a default value of 0.
You need to maintain an indicator Boolean separate or to use a type of data larger such as number (which can store NaN), object (which can store NaN or null), or * (which can store a value, including NaN, null, and undefined).
Gordon Smith
Adobe Flex SDK team
-
200545 PCI-6033e auto calibration error
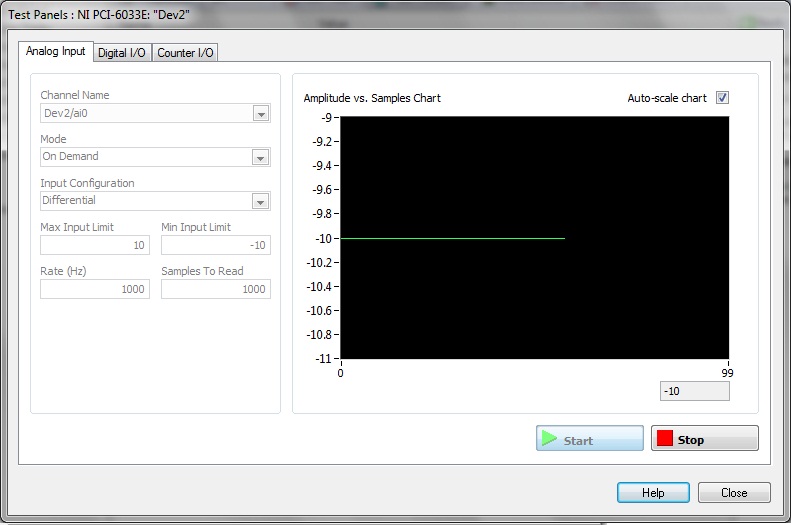
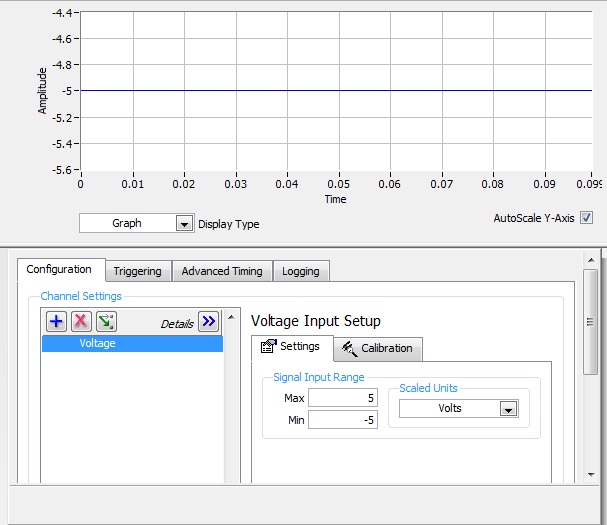
I have a PCI-6033e card that worked for a long time on an old computer (Windows 2000) who recently has the same problem, as described in THIS post. The measured voltage in all NOR-DAQmx tasks, or any VI run by BT is always the minimum voltage value in the negative area, without noise (that is, - 5V, - 10V etc.). When the voltage range is set to 0V more (i.e. 1V - 5V) the voltage is constant 0V.
I don't think I have the same problem as in the post I linked above because my card does not work on two separate computers. While the post above, the map worked in a computer and not the other.
I am trying hard to draw the card on a "new" computer (Windows 7) and have the following questions.
On both computers, old & new:
-New versions of the drivers have been downloaded and updated.
-Card past self-test-Card can be reset.
-Card fails Auto Calibration (200545 error)
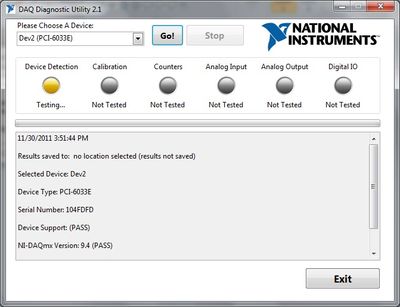
When I run the utility DAQ Diagnotistic 2.1, it get hung up after the next step:
30/11/2011 15:46:58
Results saved in: C:\Users\UWABL\Documents\Diagnostic results.txt
Select device: Dev2
Type of device: PCI-6033E
Serial number: 104FDFD
Support: (PASS)
NOR-DAQmx version: 9.4 (PASS)
Resetting the device: (PASS)
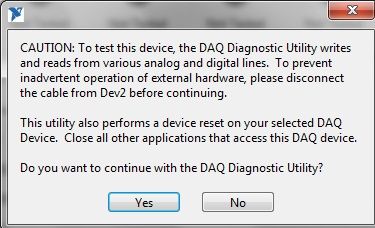
At this point, the utility Diagnotistic DAQ 2.1 has a warning to disconnect the cable to the DAQ hardware to prevent involuntary actiavation of instrumentation. However, there is nothing connected to the acquisition of data. When asked if I want to continue, the utility DAQ Diagnotistic says 'stable' but do not process with the Diagnotistic test.
Warning
Declare that the DAQ Diagnostic Utility is stuck in after I told him to continue.
Any ideas when it comes to a bad card, or it must be sent for calibration would be appreciated!
Thank you
Jeff Campbell
Hi Jeff,
Thank you for taking to the extent additional and based on the results, it seems that the map is carried out. I don't think that it is a calibration problem either since there is absolutely no response to the signal on the oscilloscope. It is clear, since you've tried the same signal on another card and it worked. If you are looking to replace the card, 6033e PPI is no longer available, but you can visit our page http://www.ni.com/daq/multifunction to see the new M series and the maps in the series X. Let me know if you have any questions, please!
-
Data loss when writing to the worksheet
I worked on a VI to acquire data from two instruments and save them in a spreadsheet. To do this, I wrote two screws slot for data - one for a scale and the other for a conductivity meter and temperature. Regardless, each sub - VI works well; However, the conductivity meter sometimes writes a 0 value in the worksheet in the main VI. I thought it could have been a problem with the sub - VI, so I wrote a small article to catch and eliminate any 0 result product (I've put in place to collect an array of results and get the average to reduce noise). It did not work and every 5 or more data points, he writes a strange value or NaN. I think there is a loss of data in main VI caused by one of a few things:
-The response time of the scale is the order of milliseconds, but the response time of the conductivity meter sends a signal every 5 seconds. This difference would cause a loss of data?
-In the main VI, the scale readable Subvi is configured to perform a loop for to generate the table in the main VI. On the sub - VI conductivity, I configured it to run the loop in the Subvi. This difference would result in a loss?
I have attached a few pictures of the block diagram to help.
Thanks for the help, guys!
I thought about it. By running the loop inside the Subvi, rather than in the main VI, he was losing some data as it came out (?). In any case, once I put in place similar to the VI scale reading, everything worked fine. I think that, anyway. It will not look like you guys don't have nothing, but forcing me to put the problems on paper has helped tremendously. Thank you!
-
Functions defined by the user with several parameters
I set features three following user using "Define."
UF1 takes a single patameter;
UF2 takes two parameters;
and UFX takes two parameters - with the second is 'X' in the definition.
Œuvres F1. F2 is the EVAL of F1 version and it works too. User functions only seem to work fine.
F3, a function of two user settings, produces a graph of NaN.
F4 is the EVAL of F3 version. Note that 'B 'is not replaced by 1'. Also produces a NaN chart.
F5 produces a graph of NaN.
F6 is EVAL of F5. The 'X' is not replaced (even with the ' B' above), and even if it looks like 'X * X', it also produces a graph of NaN.
Is it possible to get defined by the user, with several parameters, features work by tracing the curve?
Hi!, Fortin:
If you download and install the ultimate Firmware with the version of the software: 2015 6 17 (8151), with the number of Version: 1.1.2 - 11, you can trace your examples of definition of the function, with curves and values, without NaN.
-
The ' niDMM is off "function does not return a true value when the Signal is Over Range
Basically, how the document reads the behavior is inconsistent or unpredictable. The doc does not what instruments/scales/measures, the IsOverrange function will work perfectly with (other than 'For example'.)
However, this KB is 2.5 DMM OR. Does anyone know if this is fixed in subsequent revisions? I have a 4070 with 3.1 and it 'appears' to work when I test it on the bench, but the wording on the KB makes it sound like do not trust - very ambiguous wording: 'Sometimes' and 'modules '.
Hi Marc,
When a measure is greater than the specified range, but not more than 105% of the beach, it's normally a discount and a warning will be returned. If a measure is greater than 105% of the specified reange, then the measure will be replaced by a NaN and a warning will be returned. In addition, if a masurement is currently the range, it will be replaced by - Inf and a warning will be back.
simple niDMM_IsOverRange checks that a NaN value sets the Boolean value true if the value is NaN. Thus, if a measure between 100% and 105% of the beach, the only indication you will get is in the return of niDMM_Read/niDMMReadMultiPoint/niDMMReadWaveform warns.
-
spend a CVI to TestStand function reference tables
I need to switch tables (double, for example) a CVI function (usually a dll), return to TestStand. and vice versa.
I followed a method that uses features of TestStand CVI such as 'TS_PropertyGetValNumber' and 'TS_PropertySetValString' and I understand how simple values, but the tables are killing me. I do not see why it would be so difficult, so I must be missing something fundamental
Here is a simple example of what I'm doing. I need to add a way to pass an allocated array of doubles (as declared and held in TestStand) in the CVI function where it is called 'values', have my CVI function fill this table of the 'values' and then pass the array back.
void TestStand_DUT_Transfer (CAObjHandle seqContextCVI, char reportText [1024],)
short * errorOccurred, long * errorCode, char errorMsg [1024])
{
error int = 0;
char response [DUT_TS_MAX_BUF_SIZE] = {'\0'};
Double delayResponse = 0.0;
ErrMsg errMsg = {'\0'};
ERRORINFO errorInfo.get the double value of TS
tsErrChk (TS_PropertyGetValNumber (seqContextCVI, & errorInfo, 'Properties.Delay',
TS_PropOption_NoOptions, & delay));/* */
/ * How DO I GET AN ALLOCATED TEST DOUBLES TABLE? */
/* */Send command to the device, return a response string and double values table
DUT_TS_ErrChk (DUT_Transfer (delay, response, values)); //<=== here="" is="" "values"="">
/* */
/ * I PASS SUSTAIN HOW THE VALUES BACK to THE TEST BENCH? */
/* */Send the char string to TS
tsErrChk (TS_PropertySetValString (seqContextCVI, & errorInfo, 'Properties.DUTResponse',
TS_PropOption_NoOptions, response);Error:
If (error! = NO_ERROR)
{
DUT_Error_Handler (error, error);
* errorOccurred = TRUE;
* error code = error;
strcpy (errorMsg, errMsg);
}
}
Thank you for the review.
well, I received a response OR support. I guess that's a common question since they have an example written, but for later use (since I couldn't find an answer by searching on forums), I will post it here:
\Examples\AccessingArraysUsingAPI\UsingCVI -
I have LV2010 and try to trace a user on a stream event. When the user presses Post Event, the same data gets plotted as X (with the help of the plot-style) in red. See attached VI.
The table has two plots-Num and event. The plot of Num is a 1 second plot continues to random numbers. The second plot is an event of conspiracy with (line X-style plot) and drawn only when the Post event is pressed. The x-axis of the waveform is set for minutes.
The problem is, when the event Post is pressed, all the data points are highlighted with X-style plot and I want data that a single point at the time highlighted with X-style plot.
Please help and thanks in advance.
-ipc
A version that does what I think you want is attached. The waveform of the event has a point added each iteration, but the value is NaN (not a number) unless the button is pressed. These points with NaN value will not appear in the field, only those with added values when the button is pressed.
Richard
-
not enough memory to complete the operation
I looked in the forums for "memory to complete operation" error and despite the advice that I found, the error always happens.
I'm using LabVIEW 2012 to try to constantly monitor our system, recording temperature, power, etc. vs time (values obtained by acquisition of data USB-6008). The data being saved to file, is every 60 seconds using a small table (no problem here). Allocation of memory time/sleeves typical LabVIEW is about 180 MB (4 GB of RAM on computer).
The issue that I feel is related to our wish to display these data on a chart for long periods of time. The current iteration of the code works as follows.
(1) we have 2 XY charts with 2 slots of each.
(2) for each parcel, I'm initialization of clusters of berries of 2 100 000 (XY pairs) that are related to the shift registers. I know it's bigger that can be displayed on a chart, but I am currently more concerned with reducing the number of data copies.
(3) every 10th data point is added in the tables using one up Bundle/Unbundle element with a 'subset of table replace. " In other words, there are about 8640 points per day. (One day is the shortest duration usually read)
(4) for the two traces on a XY Chart, two groups are combined in a table (using the table to build). I think that's my problem here. Since every time I update the charts that LabVIEW must allocate memory for the 4 XY plots. (I'm correct here?)
Decimating the additional data during research on several days will reduce the amount written in the plots. However, this creates copies of data. It is useful in this case?
Instead of initializing 4 groups (1 for each plot) and combining in the tables later, it would be better to initialize the array of clusters of berries (2 lots per chart) and update the data by "index / unbundle / replace the subset of table / bundle replace table subset" series of operations?
Nothing obviously bad jumps to my, but this could be why it works for days sometimes. A few things to try:
(1) the section where you overwrite the oldest 3600 data points and rotate tables has code to initialize a new table. I propose this initialization outside the loop to make sure that only do you it once. You could always simply replace the elements in the table with a value of NaN.
(2) I would try to get rid of the build tables as you pointed out. Initialize these berries outside the loop and replace components as appropriate.
(3) build you tables of Irr and time according to the table of the construction and reset them once / day. You can try those external booting as well.
(4) If a problem occurs and the file write crashes your queue can fill. The dequeue item is already waiting for data before it does anything, so I don't think you need the delay in the same loop. This could help the dequeue catch up if the queue is large. You can use a vi Get Queue Status to display the number of items in the queue on the screen. As long as it is not hidden by the error message it could give you an idea if the queue is the cause of your error. You can also access the queue size to see if it develops.
(5) If your data acquisition loop error handling is not good, a mistake it can cause the loop to run as fast as possible. If you have added the 1000ms wait just to show that this is not a gourmet loop, so this could easily be the cause. I do not think that the Renault USB are very reliable, so try to use a days may run into this error.
I hope that it becomes at least you said in the right direction. My bet is on #5

-
Hi, I'm fairly new to Labview and I have this problem:
I am in a position sensitivity of radio link to microwave with the attenuator of voltage controlled od aif. First of all, I do calibration attenuator itself, if I get the file .csv with two columns (power: voltage). In the next step, I do measure. As a result, I know voltage and I need to open the file of calibration, to find the measured voltage and find the corresponding power value.
I found here ( https://decibel.ni.com/content/docs/DOC-29642 ), VI, which can do this task and I change to display found element (same row, column - 1, where power values is) and when I run it, it works corectly, but when I call this my hand VI, he sometimes returns correct value and sometimes NaN. When I ran main ten times, the values for which prright program returns the correct value, or NaN are always the same, but when I check these values manually in the Subvi, it works corectlly.
I'm really desperate with this behavior and I will be happy for all the help
1. no need at all to the structure of the sequence.
2. no need to convert 2D into a matrix table. The Index table can manage multiple dimensions.
3. what I think that your problem here, is that the soft-points are not accurate. It is a problem with all programming languages.
What you should really use is threshold D 1 table to get the index of the tension and then interpolate 1 table D to get your power. No need for loops.

Maybe you are looking for
-
I just returned from vacation with a few hundreds of photos on my iPad, but unfortunately only half load down from my office which is is paired with? all ideas
-
List of complete podcast in iTunes, but not Web Preview
Hello, our podcast is https://itunes.apple.com/us/podcast/breastfeeding-medicine-podcast/id417009927 We have 54 episodes. They all appear in iTunes Player, but only 27 show upwards in the list at the iTunes Store. I tested several podcasts that are
-
In MS access throught labview connection problem
Hello I use MS Access 2010 and 2012 of Labview. When I'm under vi of Create table and insert a column, but I get a repetitive mistake that is shown in the images. Please help me solve this problem.
-
After Windows XP update automatic, sound doesn't read correctly
After Windows XP automatic update, I have a problem with the sound. A few weeks ago after an automatic update of Windows, I had problems with the sound on my laptop. I did a lot of different tests and they all seem to be fine. I have a Sony Vaio, on
-
Need drivers USB 3.0 for laptop HP 14-f027cl
Hello Yesterday, I had to get off my OS Windows 7 Pro 64 bit. I need help, to try to find the right USB 3.0 drivers. Here is the hardware ID of the device. PCI\VEN_1022 & DEV_7814 & SUBSYS_2115103C & REV_09PCI\VEN_1022 & DEV_7814 & SUBSYS_2115103CPCI