Scale chart
Hello
I am using the following fuctions draw a graph in visual studio using the labview includes libs:
InitCVIRTE();
NewPanel();
NewCtrl();
DisplayPanel();
SetAxisScalingMode();
PlotStripChart();
Can I change the size of the window to the background by changing the values of the function NewPanel, but I Don t know how to change the size of the chart. I want it to fill most of the screen. I also tried with SetAxisScalingMode function, but it has not changed the size og the graph it only changed the scaling.
How can I change the size og the graph?
BR
Benjamin
Parameter ControAttribute specifies the attribute that you want to set. In your case, you must call SetCtrlAttribute twice: once with ATTR_WIDTH of attribute, the other with ATTR_HEIGHT.
Dimensions are expressed in pixels.
Tags: NI Software
Similar Questions
-
How to change the Excel tables in InDesign?
I can't to scale charts in Excel in the new InDesign. Only the font size changes? Please help me
Edit > Preferences, Section 'General '.
Look at the screenshot above. If you don't see something like that I am at a total loss.
-
Chart WPF: AllPlots collection does not contain the scales in the second time.
Hello
I'm using WPF OR chart, and I'm in the binder through the datasource property.
I have two axes in XAML that represent the scales.
When you press the button I create random data (shown in the code below).
But when I delete all data and adds the data in the list of places that have already been added in the past (for example: if I added 3 data in the past and now I'll add only 2 or 3), then plots that are created in the variable AllPlots not gets scales except the first (never erased) and he destroyed me certain things such as zooming.
List
newdata As new List ();
Random r = new Random();
< 6000;="">
{
NewData. Add (r.Next (-20, 45));
}
Data.Add (newdata);Hmm, a very strange problem. Unfortunately, I can't reproduce this behavior at all: I still see '2' for each parcel, before clear or after.
I guess that you have run the example as-is in a new project, without any other change to match your real application? And that you use the latest version of measurement Studio 2015?
-
Get chart scales and grids to display only whole numbers
How to make a graph of mixed signals as indicated in the attachment to only show whole on the y axis and reduce the grid to do the same thing?
Hello
programmatically, you have a property node for the scale that should do the job: 'increase '.
=> property node, Y scale, range, increment.
The grid will follow.
The minimum increment depends on the vertical size of the chart (and the size of police marker I suppose, who also has his property node)
example attached, hope it helps.
Antoine
-
It is better to define a waveform properties of scale before or after sending new data to the chart?
Hi, I wonder what is the best time to update the properties of the graphic scale waveform.
I'm sampling data every 15 minutes for 192 samples, or 48 hours. I want to draw these samples with x in absolute scale so the scale maximum x is time and x minimum scale at the time mode is x max in less than 48 hours (172800 seconds). I want also to intermediate-scale markers 6 hours apart and to be multiples of 6 hours. for example at 06:00, 12:00, 18:00. It works by using nodes of property but sometimes intermediate markers are on the hour 6 multiple and sometimes they are at 6 hours after the scale min marker. for example, 09:15, 15:15, 21:15. Is there a way to ensure that the intermediate markers are on the hour 6 multiples?
Thank you
Neville
Neville,
I don't think there is a function of the order of execution by using nodes of property information across your graph. If you are concerned about the speed of your VI, I would recommend writing to the property node before update you the chart. I believe that this will ensure that the chart will update only once: when the new data is sent to the curve, as opposed to the update with the new data, then with the new scale.
-
How to trace my chart according to the time scale?
Hey a little help please. Im trying to draw a waveform on a graph in LW/CVI. The X_Axis is the scale and time axis is amplitude. I use a loop for to generate the matrices X and Y. I'm not sure how do the X table matches the time scale. I need X for increment in milli seconds. I changed the category axis of the chart hour time / absolute relative, but the problem is how to make the loop for incrementing the X-Array according to the clock.
Thanks for your help;
Rohit
Hi Rohit,
It is a fine example called TimeDateUnits that illustrates a continuous update of a xy graph, maybe you can have a look?
-
Add the second scale of Y on the right side of a chart
Hello
I use a waveform table to display temperatures (scale Y) versus time (X-Scale).
My card is wide enough to see a range of "long", and I would just copy the scale Y
and display it on the right side of the chart once again, simply for better readability of the temperatures.
I tried with the option of customization, but I am not able to copy and paste the scale Y.
Thank you
Patrick
When using multiple scales, you need to set the "ActiveScale' before applying the changes. You can avoid race conditions if you expand the node for your property to include the active scale as the first property.
Ben
-
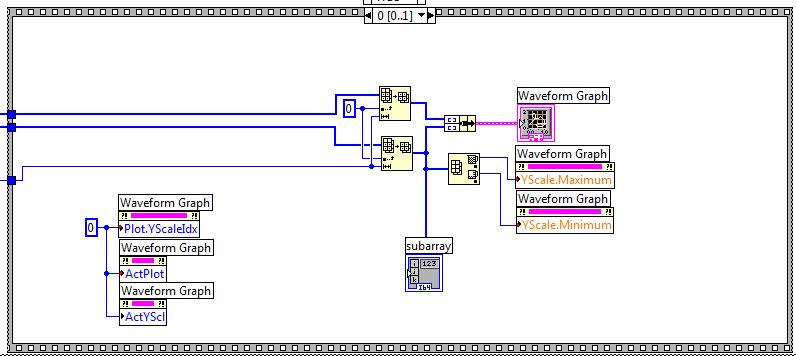
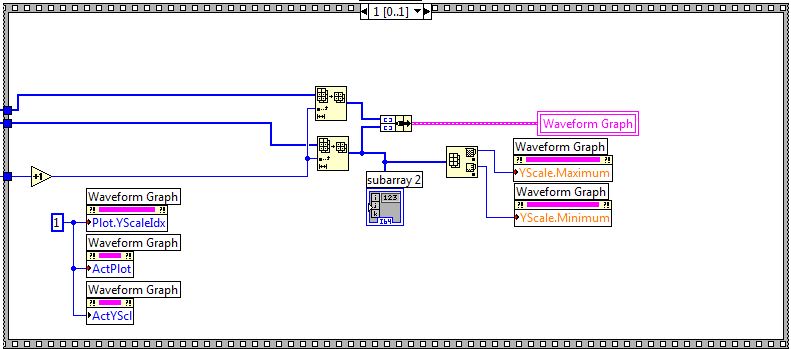
Hello, I use the Labview 8.2.1 and I would ask for a solution.
I use a graph of waveform with 1 x-scale and 2 scales of y. The scale is a rest and the other is on the right side of the chart.
I created 2 plots and I assigned corresponding scales.
I want to draw 2 XY tables one after the other with different scales there. Specifically, there must be a plot that ends at a value of the x-axis and from there the other plot should continue to use the other ladder there.
For this I tried a 'sequence Structure', in the first image, I create the first path using 3 'nodes of property': Plot.YScaleIndex, ActivePlot & ActiveYScale and I give zero for them in order to use the first scale y.
In the second frame, the second conspiracy giving the integer 1 I have create the above 'nodes of property', but the first plot disappears and the second plot does not use the second ladder there but the first.
This is the frame1:
It's the frame2:
What can I do?
Thank you in advance.
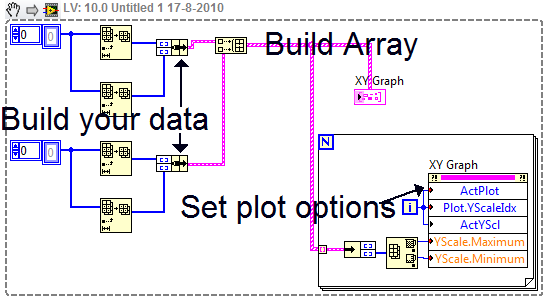
What happens in your sequence structure, is the second celebrity replaces the data of the first case.
You must create your two data sets and build an array of those, fed this in a loop for, then by all data, select the right:
-field (ActPlot)
-Y-scale (Plot.ScaleIdx)
-Y-scale to edit (ActYscl)
We then put the max and min, be aware that the second ladder must be created before running this code.
Another option would be to auto scale just scales-Y.
Tone
-
Desktop and personalization
When I did a right click on the desktop, click chart options, and then choose Panel fit, he won't go full screen "scale". I want to choose "center image", but there to "display full scale.
I thank very you much in advance!
Hello
Referring to the resolution of the screen?
I suggest you to return the item and check if it helps:
Change your screen resolution
http://Windows.Microsoft.com/en-us/Windows7/change-your-screen-resolution
Check the link for more information:
Get the best display on your monitor
http://Windows.Microsoft.com/en-us/Windows7/getting-the-best-display-on-your-monitor
-
Chart: how to set automatically the scale of the axis Y
Hello
As you can see below, I have a truncated whith graphic bar, they go beyond the top of the chart, but traore are cut.
For example, 'The Chatel Heath' has a value of 35.
I want to the scale of the y-axis to be set automatically according to the largest value.
How to do? I use APEX 5.0.1.

Kind regards.
Chipniz wrote:
As you can see below, I have a truncated whith graphic bar, they go beyond the top of the chart, but traore are cut.
For example, 'The Chatel Heath' has a value of 35.
I want to the scale of the y-axis to be set automatically according to the largest value.
How to do? I use APEX 5.0.1.

The behavior of default graph is automatically calculate the scale of the axis, which seems to indicate that your existing chart settings are responsible for this. You use custom Axes or XML parameters in the table?
Reproduce the problem on apex.oracle.com is the best way to get help with problems of this kind.
-
Chart with multiple scales of Y
Hello
As you can see in the excerpt, I'm trying to plot a graph with several scales of Y. What do you think is wrong with it to get the following error.
Possible reasons:
LabVIEW:  invalid property value.
I wouldn't change nothing to indexing. You already wrote this code.
I clicked the balance you already had and clicked on "Double ladder" to create the second and third. Once they have existed, the crux of your property has worked fine as it was.
-
time scale is not shown on my chart
Hello
This may seem a very stupid question, but I was stuck on this for the last 2 hours and I could not find an answer anywhere else on the forum, so here goes. The timestamp (dt) on my graph will not appear. It shows the whole numbers of samples and does not care what is my sampling rate (dt). I read somewhere that it could be because "the timestamp is ignored", this option is grayed out, so is not applicable here.
I added a picture of the code where the waveform is created (if it is trivial). Any thoughts?
Hello
I just noticed that the point of constraint comes from my stream. Attaching a normal array it makes the point of disappearing, and then the chart ignores my dt. So the problem must be with my bitstream.
EDIT: For some reason, wiring of the table that is normal to the curve, remove and then rewiring my flow for the chart has solved my problem... I have no idea what happened, but now the sampling frequency is taken into account. (the point of constraint moved to my block of convolution, now, which indicates a problem with my the filter coefficients, but it doesn't seem to work now).
-
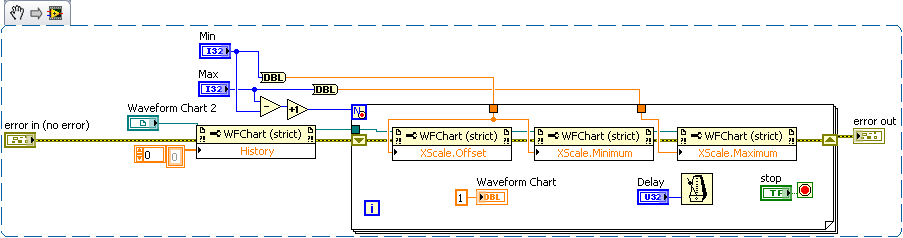
How to set the property node maximum xscale for several scale XY Chart
Hello
I use a graph XY with three X axis and three scales of axis Y to draw the three sets of data. This works well.
What I do now is to set the Xscale.Maximum property node for one of the x-axis (the other two autoscale). If I click right in the (Create Blockdiagram; Node property; X scale; Maximum) I can not choose what x-axis I want to put the Maximum for.
So my question: how to select a specific axis allows you to set the XScale.Maximum property node when having several axes?
Thank you for your help, any suggestions are appreciated!
Hello
After some more research and experimentation, I found that using the scale property X Active I can determine/set for which the XScale.Maximum Xscale is used.
This solved my problem.
I hope someone else can save themselves a few hours with this thread!
Thank you
-
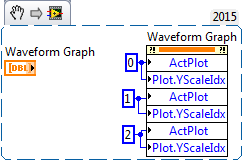
customize multiple scales of Y in a wave chart
Hello
I'm showing two channels in the same form of wave, but with scales graph Y distinct. And I want to customize the two scales Y independently using nodes property. But I found under the node property of waveform graphic, there is only a single scale of Y.
Does anyone have the experience to customize them independently using nodes of property?
Thank you
XP\LabVIEW 2011
Use the "Active Y scale" property to select the scale you want to act accordingly.
Scale Y Active value of 0 (the first scale of Y), then set all the properties that you want for that 1 scalethen Y Y Active set at the scale of 1 (the second level Y) and again to set all the properties that you want for this 2nd scale Y.
Hope this helps
-
scale of table/chart of waveform
Hello
I have 1 meter construction and I need to scan for electromagnetic fields.
The user has an option to choose the range he wants to scan. That is, he may choose to analyze only the range from 20cm to 50 cm.
I chose to use the waveform table because I need of measures to display 'live '.
So I want to set up X scale from 20 cm to 50 cm only! with the steps that are also chosen by the user.
The problem is that this table of waveform a buffer so that even that if I set up offset and multiply by property nodes as required, it works well for me if I do more than 1 scan (offset and multiply the nodes are defined before each scan.)
What can I do?
Thank you
Would be - this help?
If not, please try to develop. It is sometimes difficult to understand what the problem is is in fact a non-native English speaker


Maybe you are looking for
-
Pay Apple Safari works on a Mac, built in 2012
I have a Mac, built in 2012, and there are new features that would not work between my Mac and iOS, as the drop. Safari work between iOS and Mac built in 2012, will be Apple pay? In the same vein, will copy / paste between Mac OS and iOS work with a
-
I have a PDF I want to convert a doc Pages. Is it possible to do it outside of a cut and paste? TIA
-
Hello I installed Windows XP. I have no driver ACPI Driver and Unknow. I have not found the driver ACPI for Windows XP - SP2. Lenovo T410 / 2537 / KS7 you have a solution for this problem? Thank you
-
My Hp c6280 all-in-one cannot parse after that I got a new computer. the error message is that I is the center of the solution, but I can't seem to find one... were pleace helpe my computer is Windows 7, 64-bit
-
How to use more than 1 browser? I don't want to lose my bookmarks on IE when I switch to Chrome.
I installed the two Firefox Chrome & sometimes, but they uninstalled because I was not able to access my favorites of IE. How to install Chrome & keep IE as my default browser?